Hey, what's up guys?
It's Ezekiel Chew here.
So if you ever wanted to actually understand where the market is in a cycle right now, not just about following candles, not just about reacting to breakouts, but to know whether or not are you in an impulse or are you in a correction, you're gonna love this, because today I'm gonna break down the exact Elliott Wave framework that I use to map the structure before the move actually unfolds.
No overly complicated wave counts. There's no forcing the waves to fit our bias. no redrawing the lines every time we are wrong. No. I'm gonna talk about a structured way to identify whether or not the trend still has fuel to go, to spot when a correction is likely ending, and then to position ourselves before the next expansion leg even actually begins.
So when you understand how to use the Elliott Wave properly, the market is gonna stop feeling random, and it's gonna start moving in phases that we can anticipate. The impulse, the correction, the continuation. And then once you see how all these pieces actually connect, you're not gonna just trade the move. You are going to understand where the move sits in the bigger structure itself.
You're going to learn:
- The three corrective patterns that every Elliott Wave correction breaks down into, and how to spot each one
- The difference between impulse waves and corrective waves, and how to use them to time your entries
- How to set targets for waves three, four, and five using Fibonacci guidelines, the three golden rules, price channels, and divergence
By the end, you'll stop guessing where price might go and start trading inside a defined framework.
📺 Watch the full breakdown in the video:
Step 1: Understanding Elliott Waves
So understanding the waves in the market through Elliott Wave Theory is like catching the rhythm of a song. The bigger moves, or the impulsive waves, they push the trend forward. While the smaller, corrective waves, it offers the chance to enter during the trend. So when you recognize these patterns, this becomes essential. When you don't understand the flow, you are just guessing.
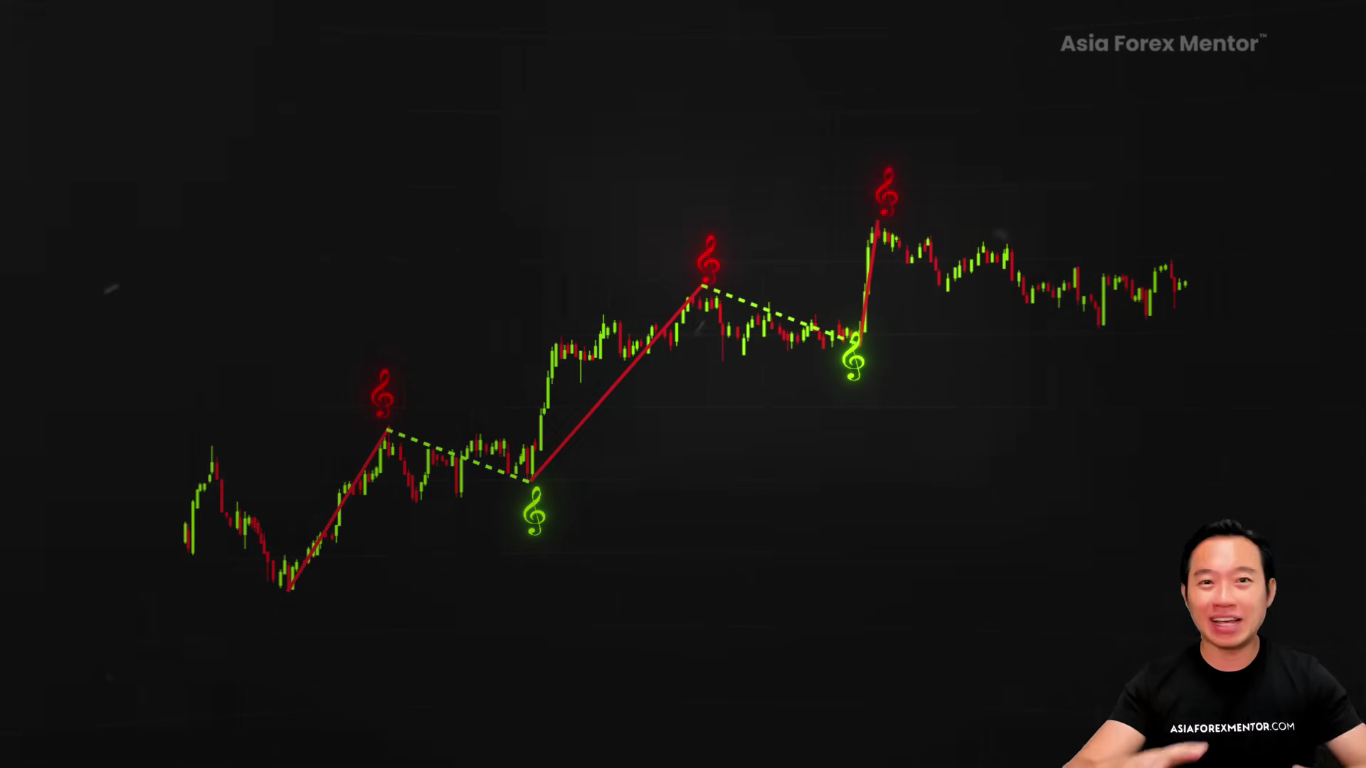
The real power in Elliott Wave is not just about knowing which wave for us to ride on, but also knowing when to wait for the right moment. Now to fully master this, let's dive into how to validate these waves before we actually make our next move. The Elliott Wave holds the secret to the market moves. Master them and you will know exactly when to strike. So let's break down these waves and we're gonna see how they guide our entries in the market.
In the Elliott Wave theory, there are 21 types of corrective ABC patterns. Don't worry. We don't need to memorize all 21 patterns. They all break down into three simple and easy to understand formations. Zigzag, flats and triangles. So once you recognize this, you're gonna easily identify the type of correction that is unfolding in the market. And then we're going to adjust our strategy accordingly.
Zigzag Pattern
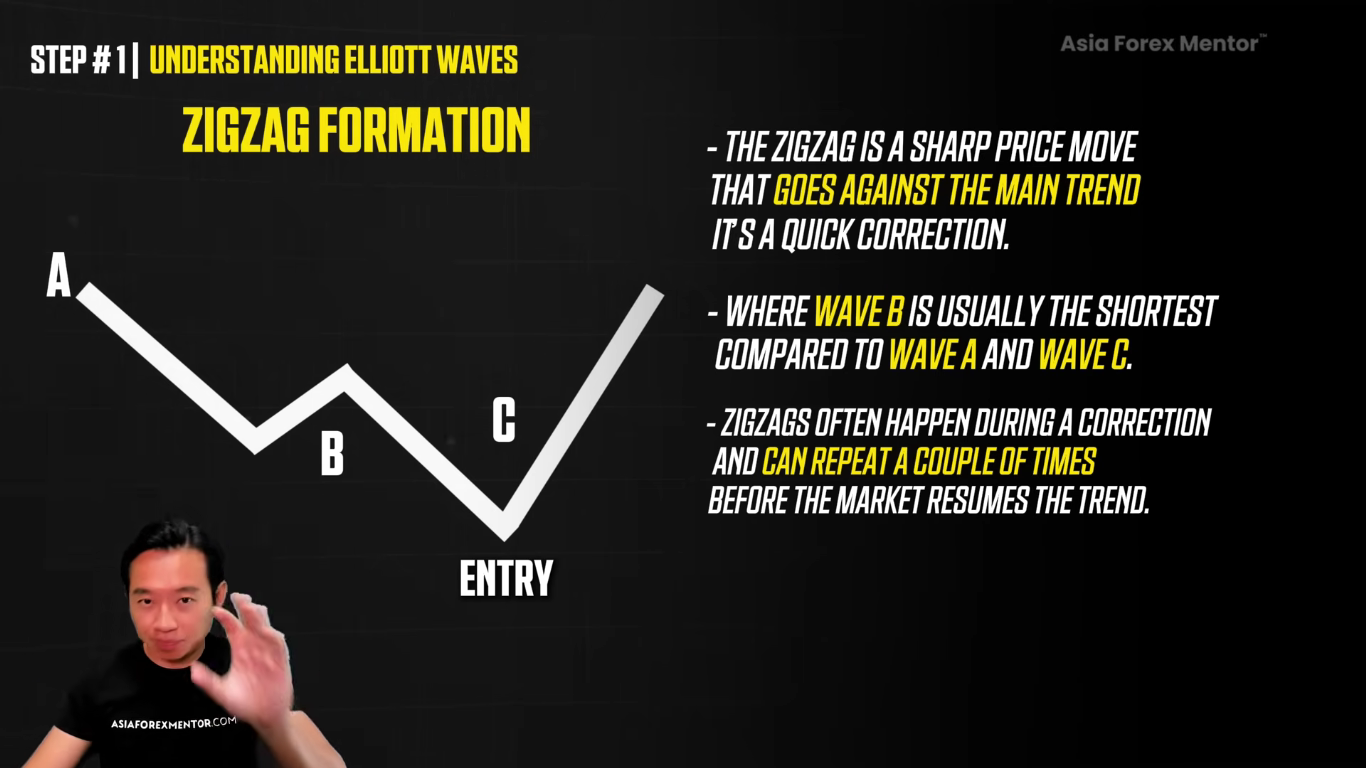
Let's start with the zigzag formation. The zigzag is a sharp price move that goes against the main trend. It is a quick correction, where wave B is usually the shortest compared to wave A and wave C. So zigzag often happens during a correction and they can repeat a couple of times before the market actually resumes the trend. the steepness of the move shows strong momentum against the trend. So this gives us a prime entry point when the market actually starts to reverse. now that is zigzag.
Flat Pattern
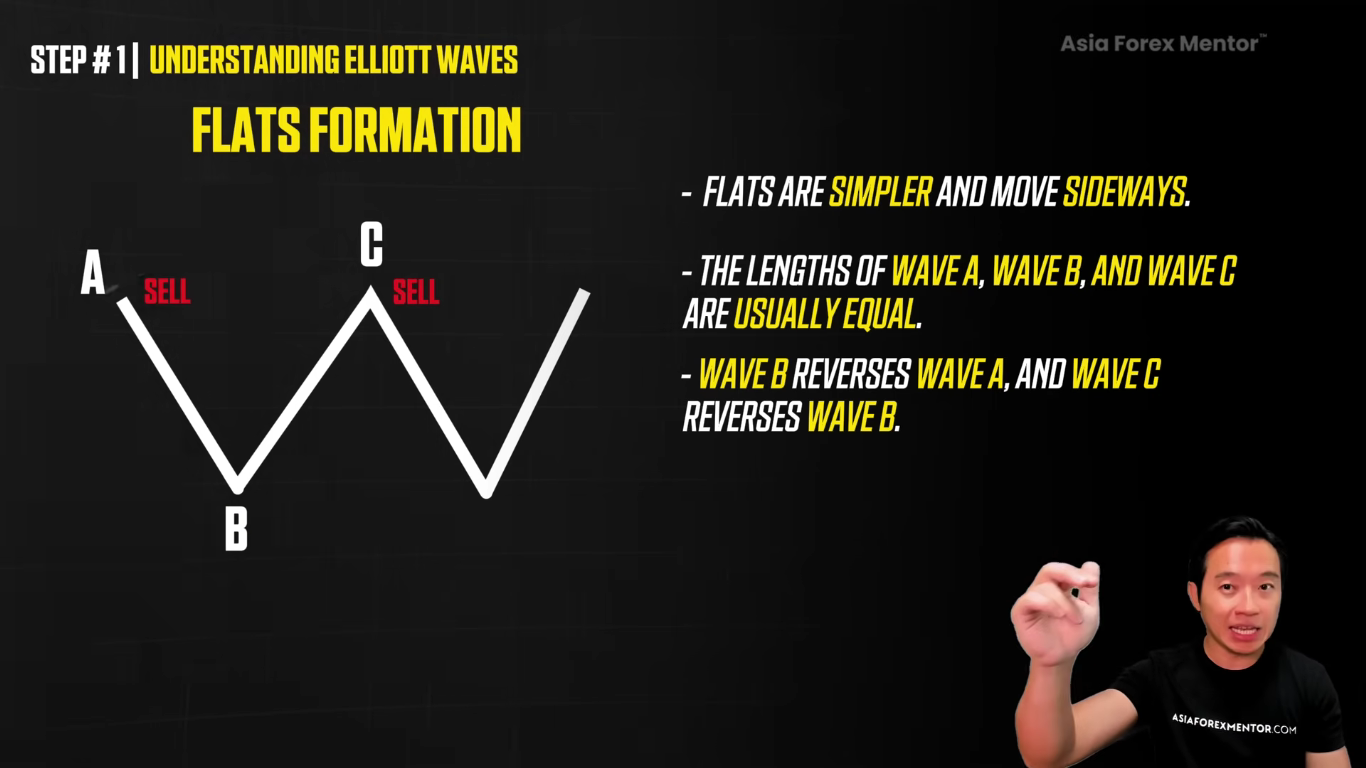
Next we have the flat formation. flats are simpler and they move sideways. in this pattern, the length of wave A and wave B and wave C, they are usually equal. Wave B reverses wave A. Wave C reverses wave B. So flats, we call them flats, can feel like the market is stuck in a range, but they are actually great for spotting when the trend is about to pick up again. So for traders, they are good opportunities for us to buy near the bottom in an uptrend
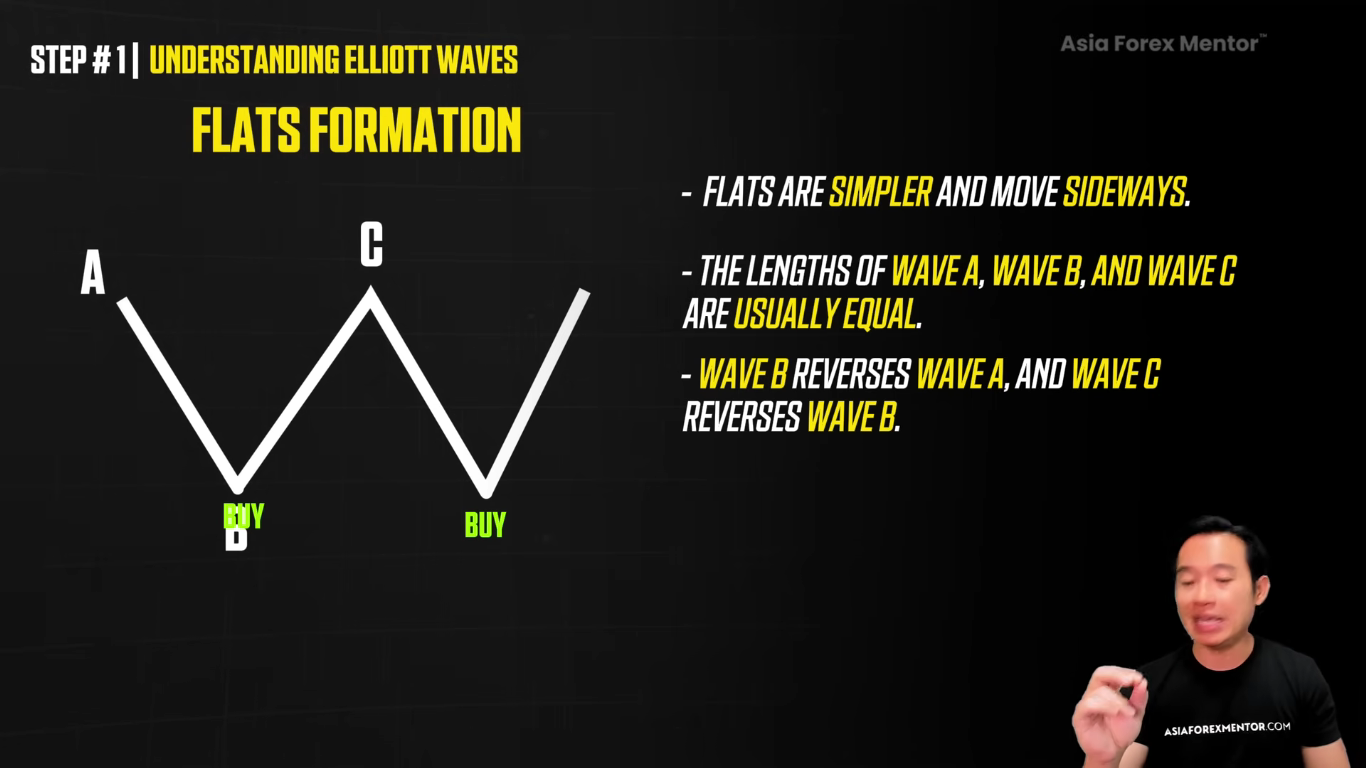
or to sell near the top in a downtrend. So this is flat.
Triangle Pattern
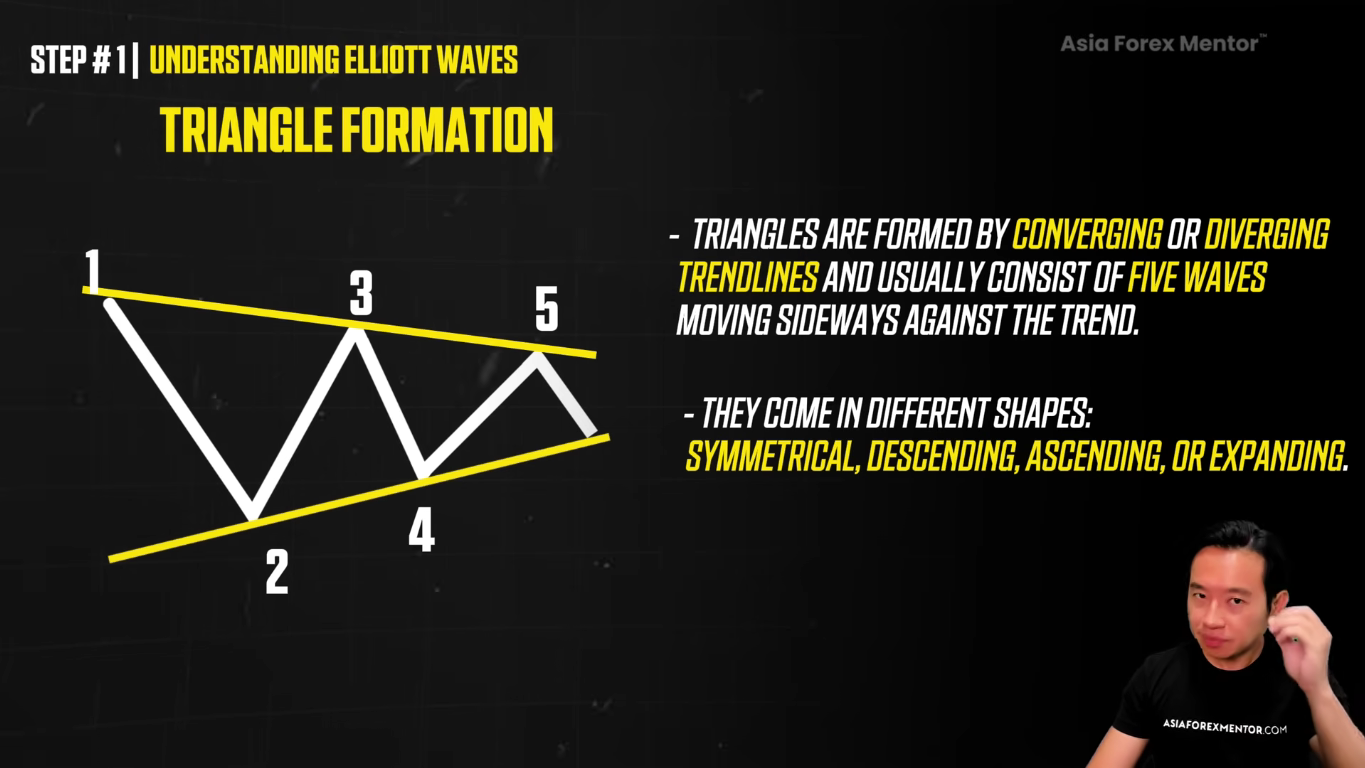
So now the last one. We've got the triangle formation. So the triangles are formed by converging and diverging trend lines. And they usually consist of five waves that are moving sideways against the trend. So they come in different shapes. They could be symmetrical. could be ascending. They could be descending. could be expanding. So the key with triangles, I'm just going to give you the bigger concept for you to understand. The key with triangles is that they signal a period of consolidation before a breakout. So when you spot a triangle forming, we just gonna get ready for a big move once it breaks.
Impulse Waves vs Corrective Waves
Now that you understand the three, the zigzag, the flat and the triangles, when it comes to trading it, understanding the difference between impulse waves and corrective waves is now important.
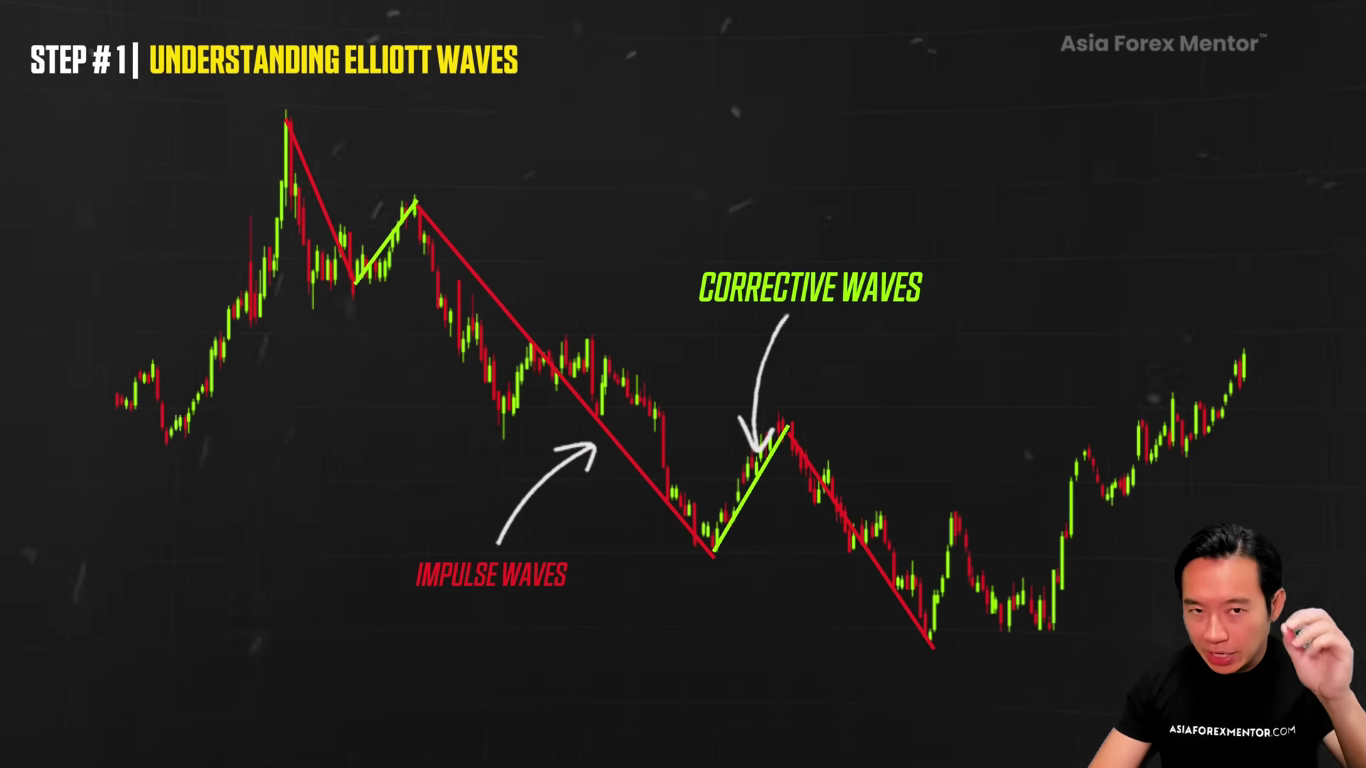
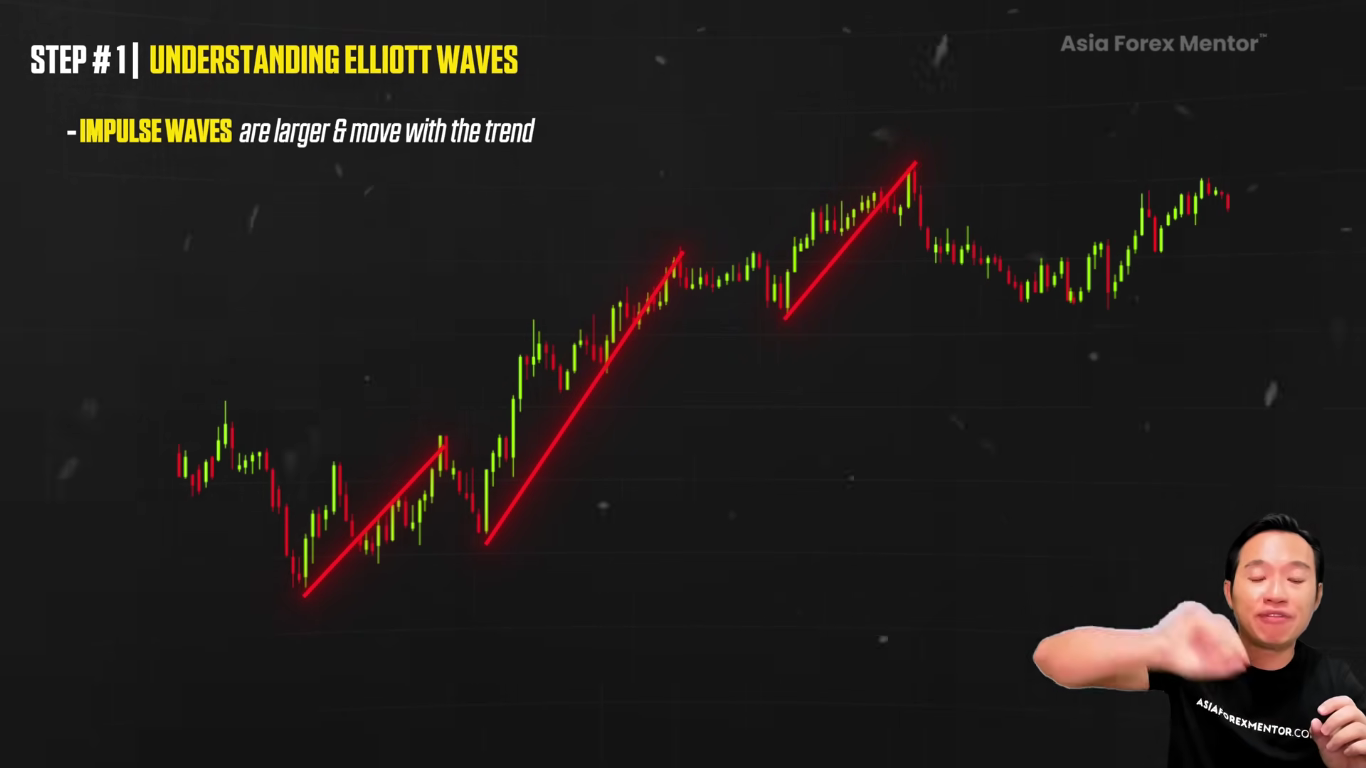
So let's talk about impulse waves. Impulse waves are powerful.
They are the big moves. the large price shift. They create momentum in one direction. these waves are the ones that push the trends forward, whether the market is rising or whether the market is falling.
These are the ones that we want to ride. So by entering during these waves, we are moving with the force of the market itself in the same trend.
then there are corrective waves.
These waves are the smaller pullback within the bigger trend. We think of them as the market taking a quick breather before it pushes forward again. So this correction, they don't change the overall trend.
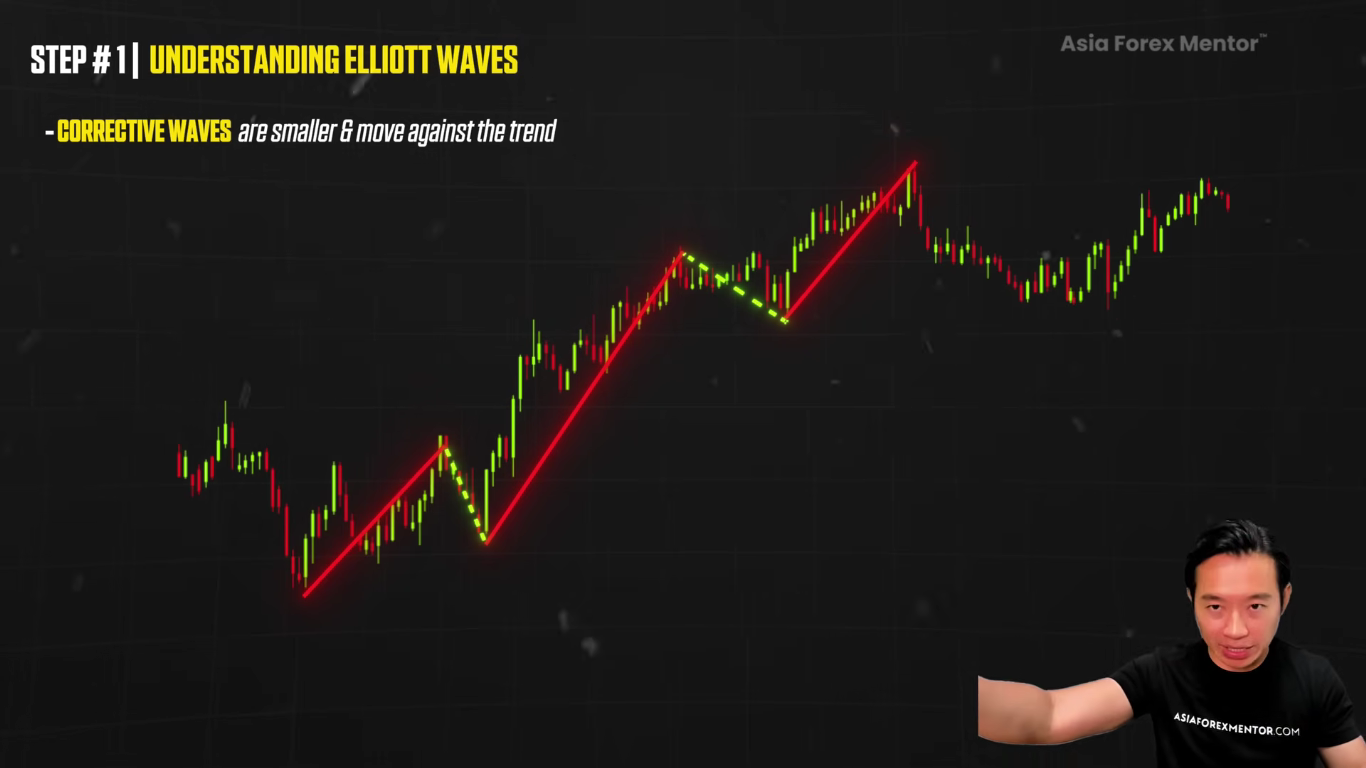
They just give us a chance to enter at a better pricing before the trend actually picks up again. So if you're aiming for the best risk to reward ratio, trading during this kind of pullbacks, they are the key. They offer lower risk entry points. They are in the direction of the main trend itself. So we are not catching the trend when the trend is moving. We are entering at an optimal point in a pullback.
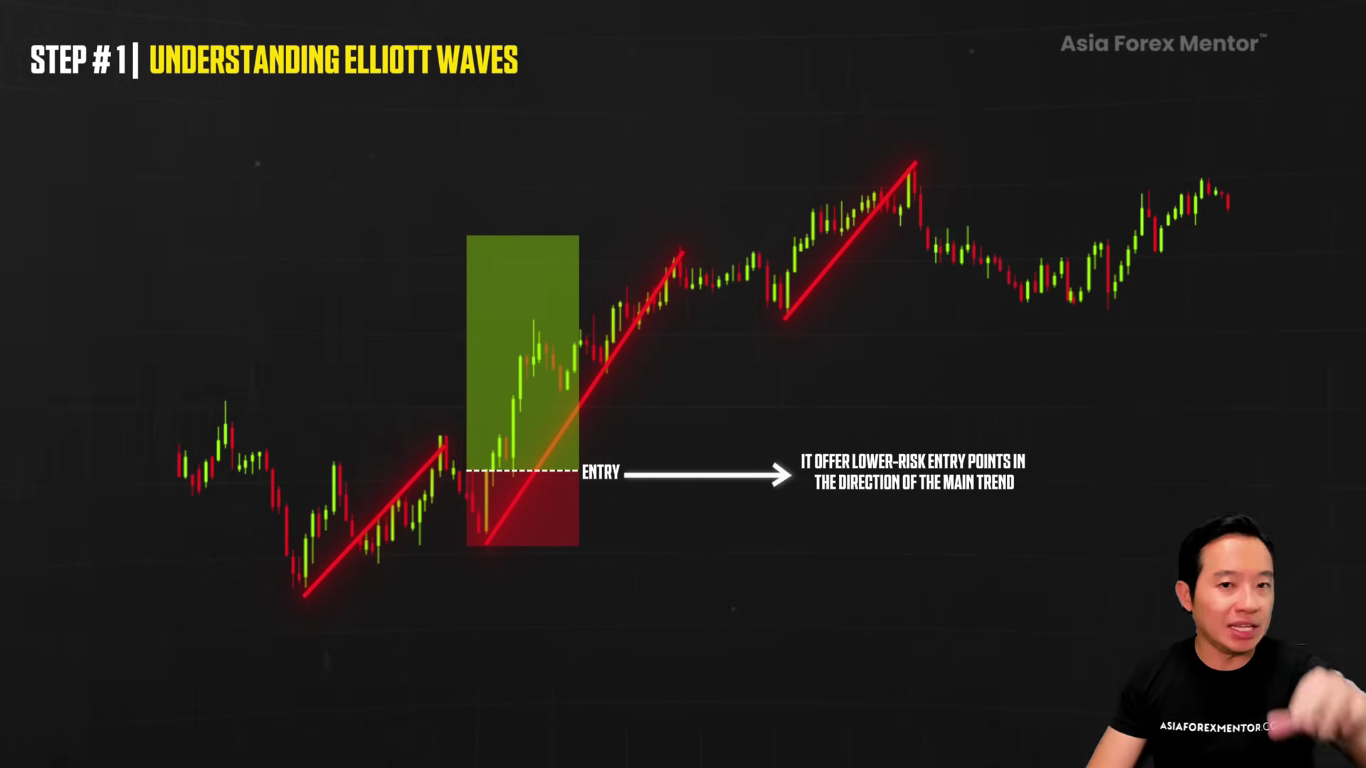
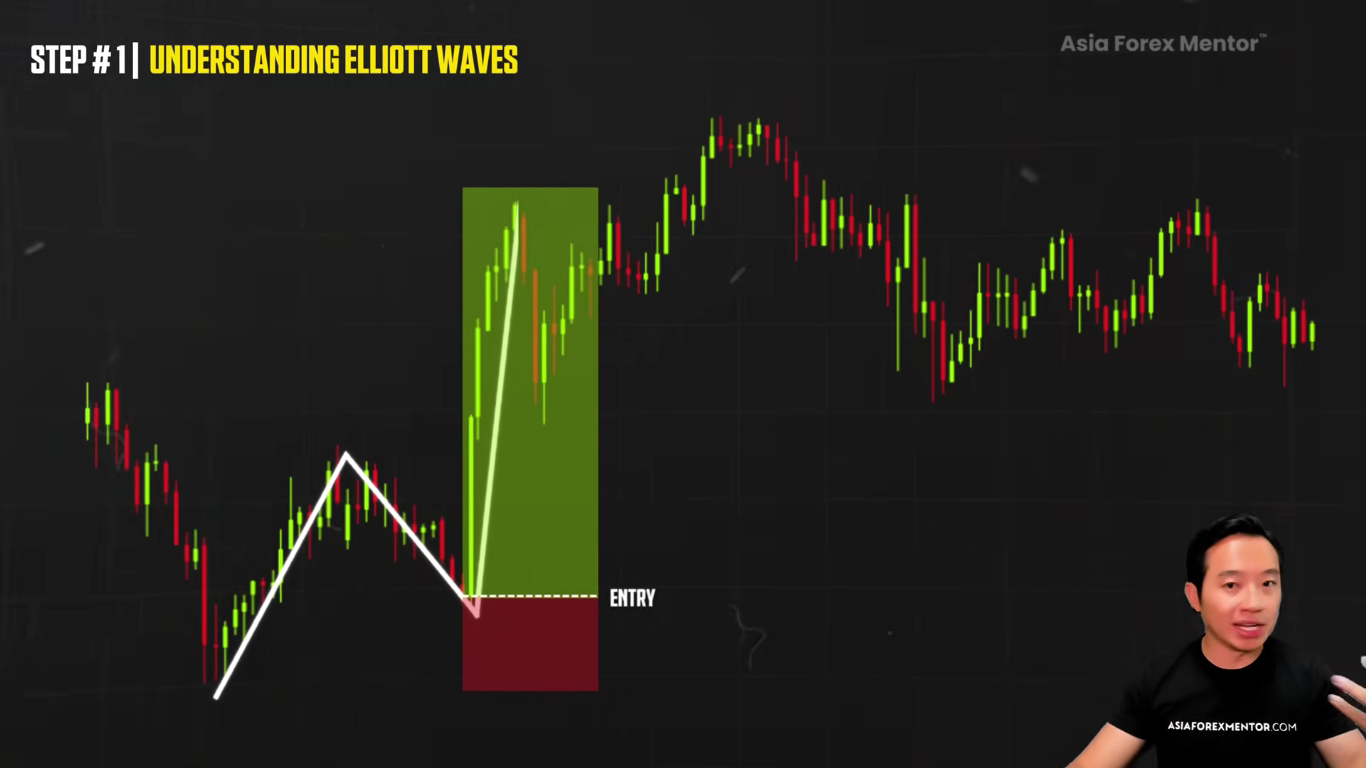
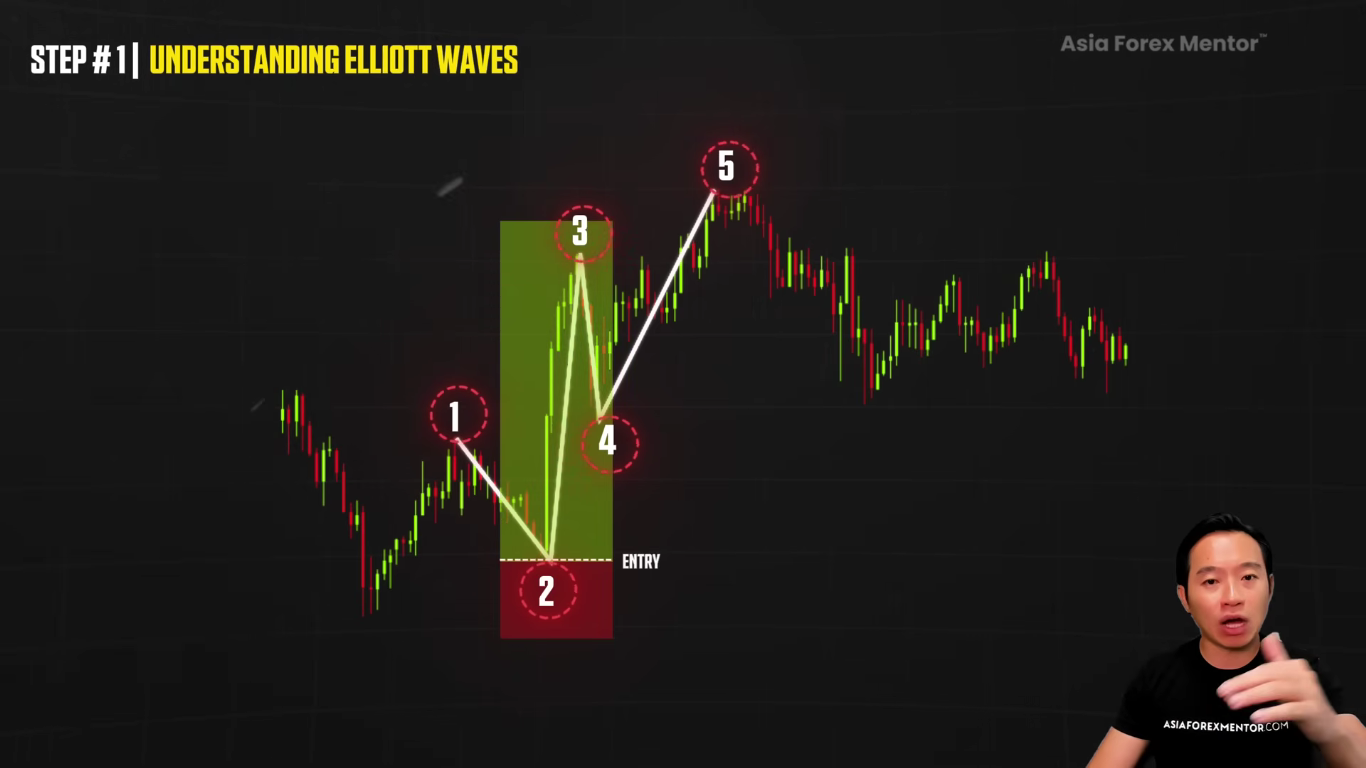
So in an uptrend, price move higher, higher highs in an impulsive wave. When it pulls back, this is our chance to buy
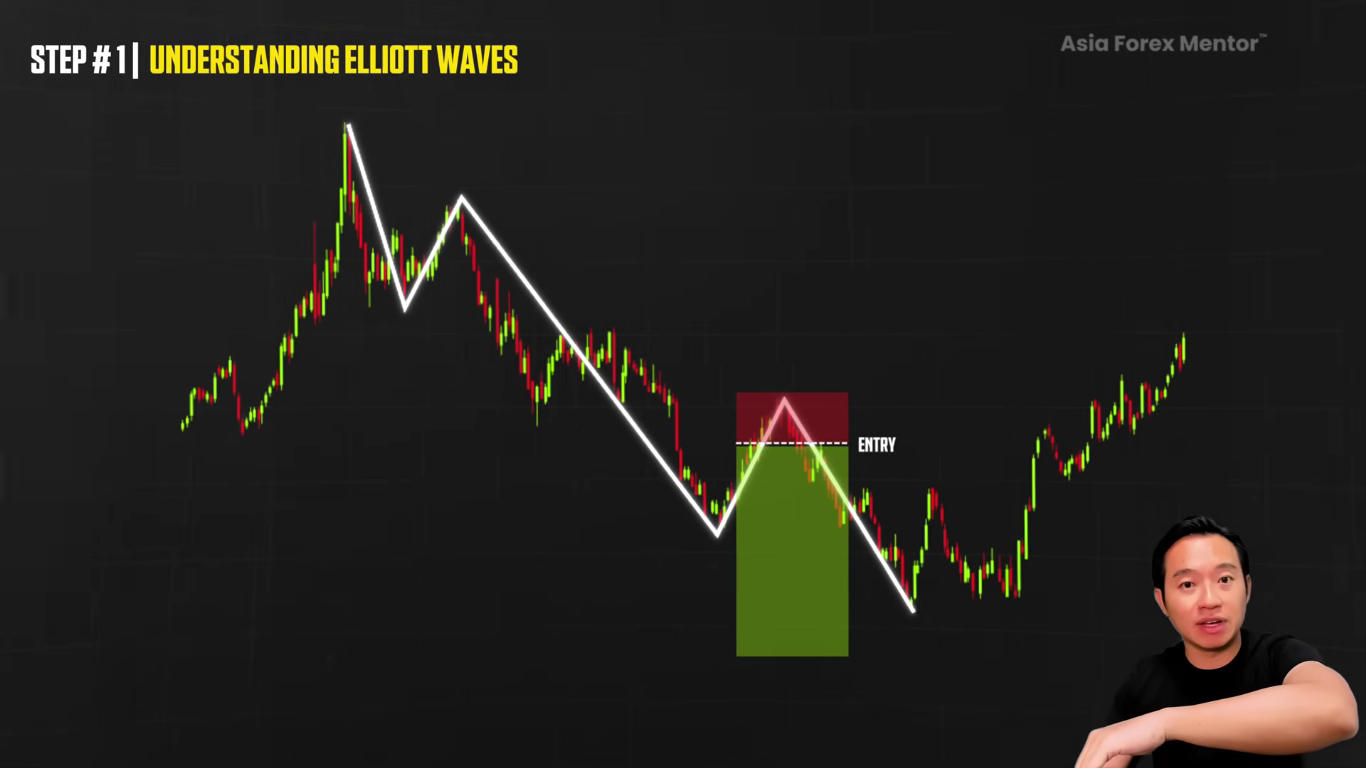
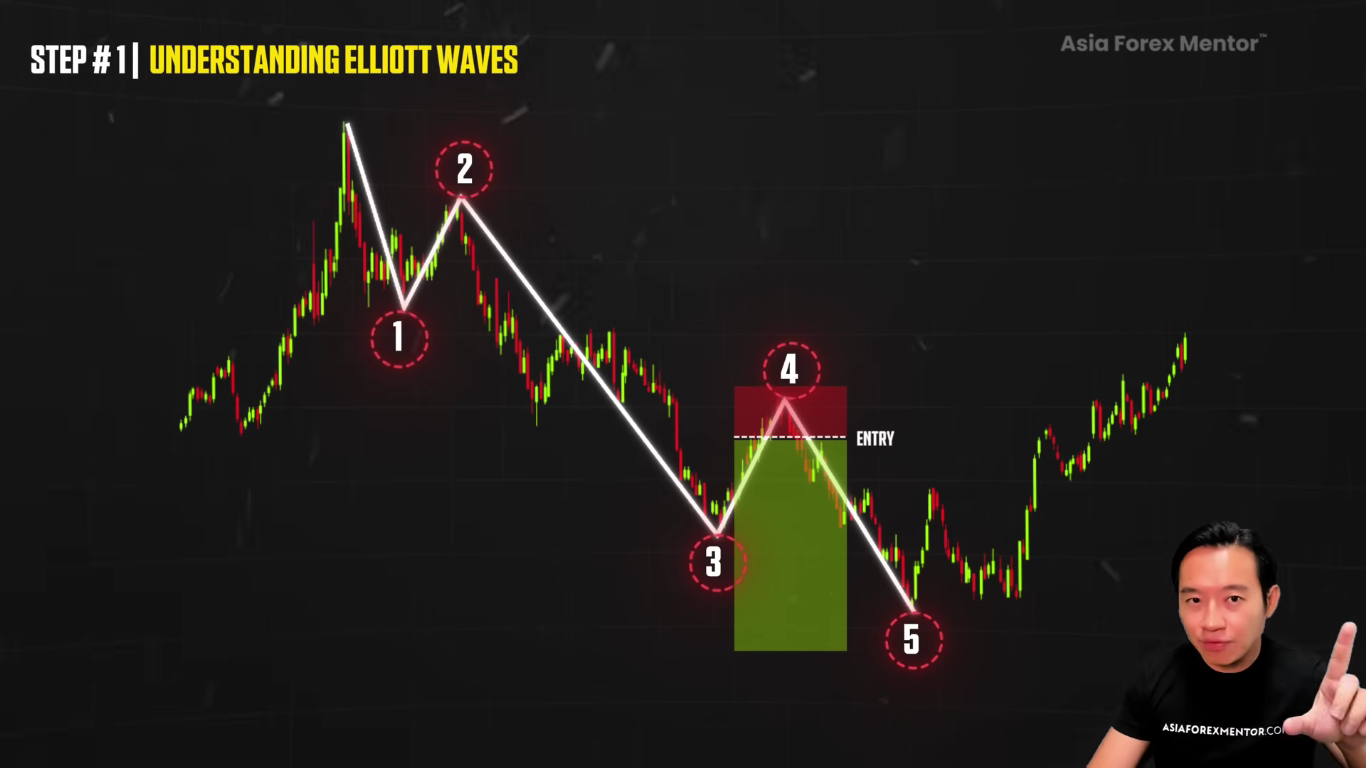
So in a downtrend, we sell during the pullback and then we ride the next impulse wave downwards.
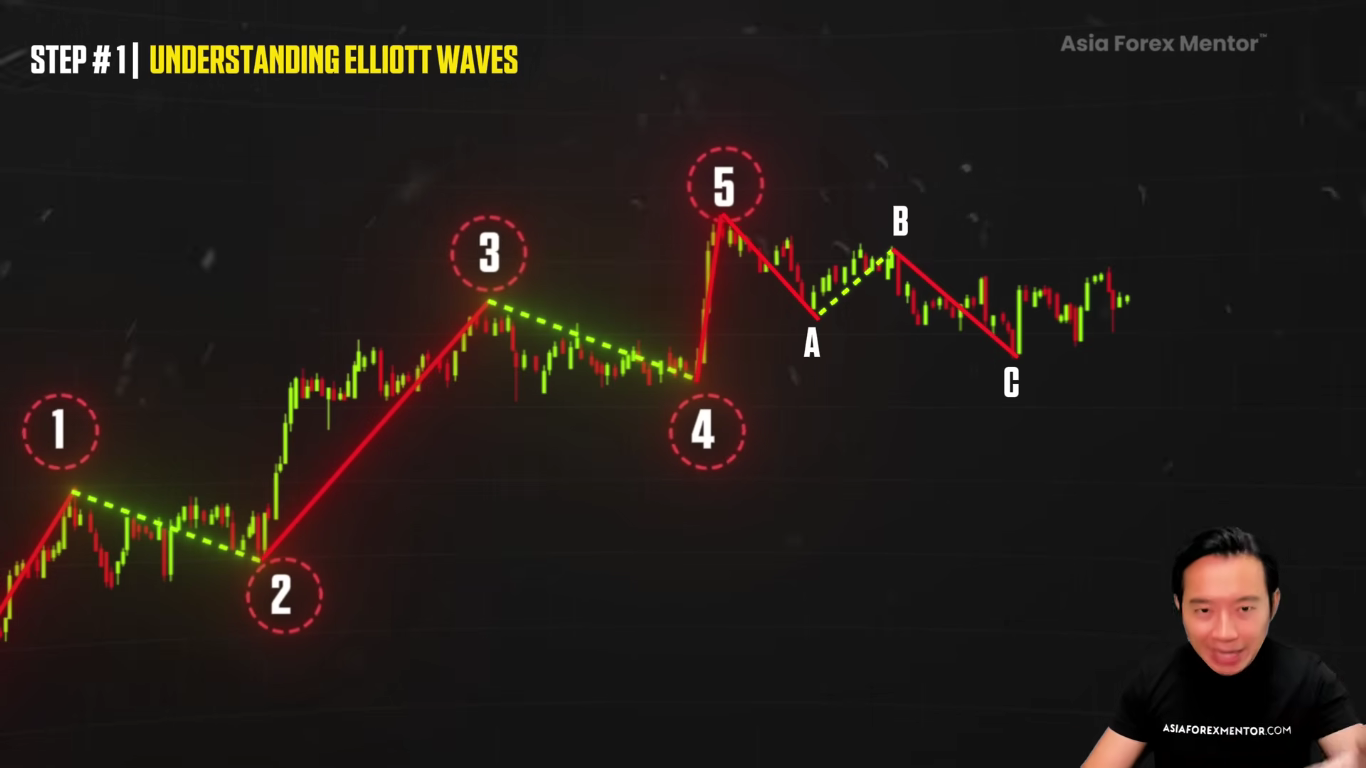
The Five Wave Pattern
So now in Elliott Wave, there are the five wave pattern in an uptrend. There are three impulse wave. Wave one, wave three, and wave five. There are two corrective waves. Wave two and wave four. So now after the one, two, three, four, five, the market then moves down in three waves. An impulse down with A, correction up with B, and then another impulse down with C. So after the uptrend, the three waves, it goes down. An impulse down, a correction up, and then another impulse down. So these waves are like what we said, A, B, and C.
So why is understanding the size of the correction important? It's about knowing what is normal. So when the market is going up, like what we said, we wanna buy on a correction.
When it's going down, we wanna sell on a correction.
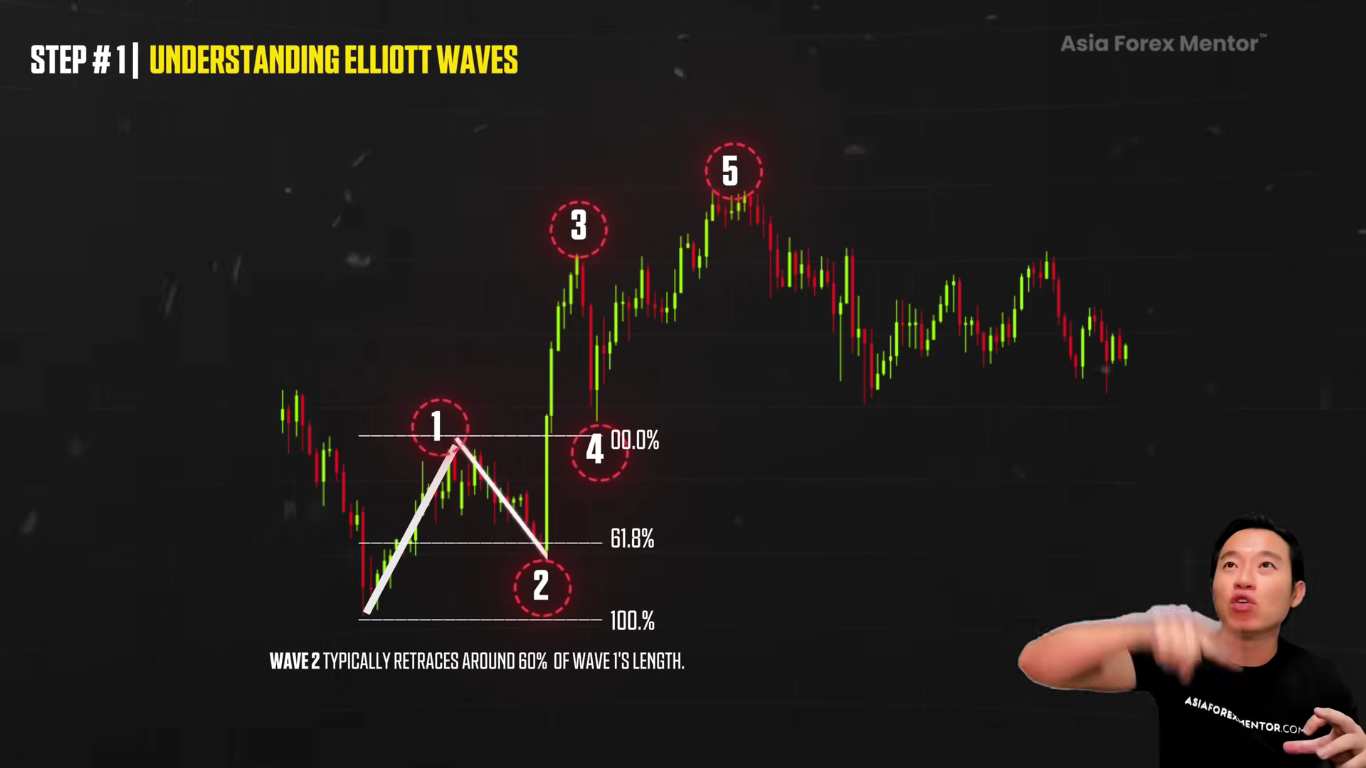
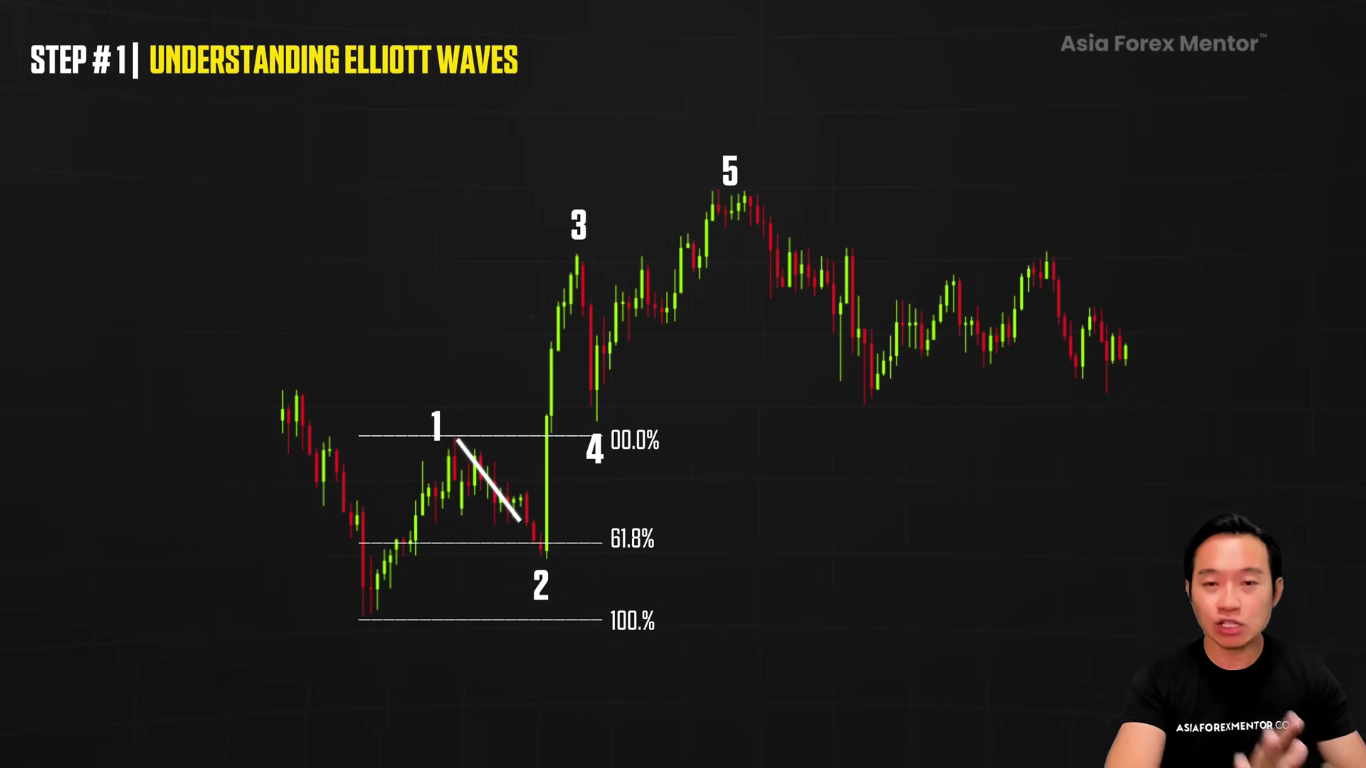
So the Elliott Wave suggests that wave two typically retraces 50 to 61.8% of wave one itself.
And then wave four retraces 30 to 40% of wave three itself.
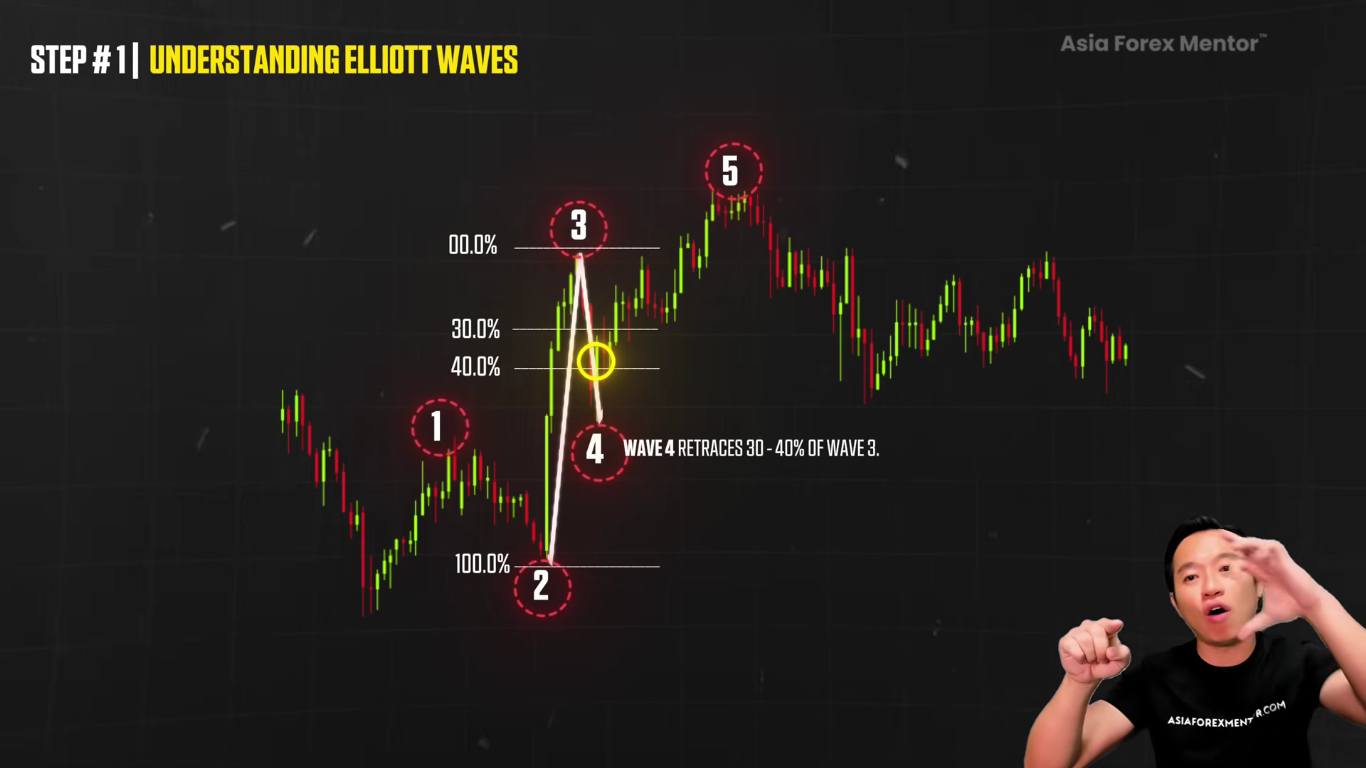
Now, these are guidelines. And these guidelines help to tell us if the market is just in a correction, or it is about to reverse. So if a correction is too deep, meaning it goes beyond the levels that I just told you, or it's too shallow, meaning it's not in the range of the levels that I told you, something else might be happening.
So we want to spot these patterns. Now the real strength of the Elliott Wave is understanding these patterns, it gives us the edge in predicting the next move. So let's say wave two doesn't retrace about the 50% level, or let's say wave four goes too far, too deep into wave one territory. This would probably mean that the whole wave structure might be off. So this is why checking these rules is important.
The Three Golden Rules of Elliott Wave
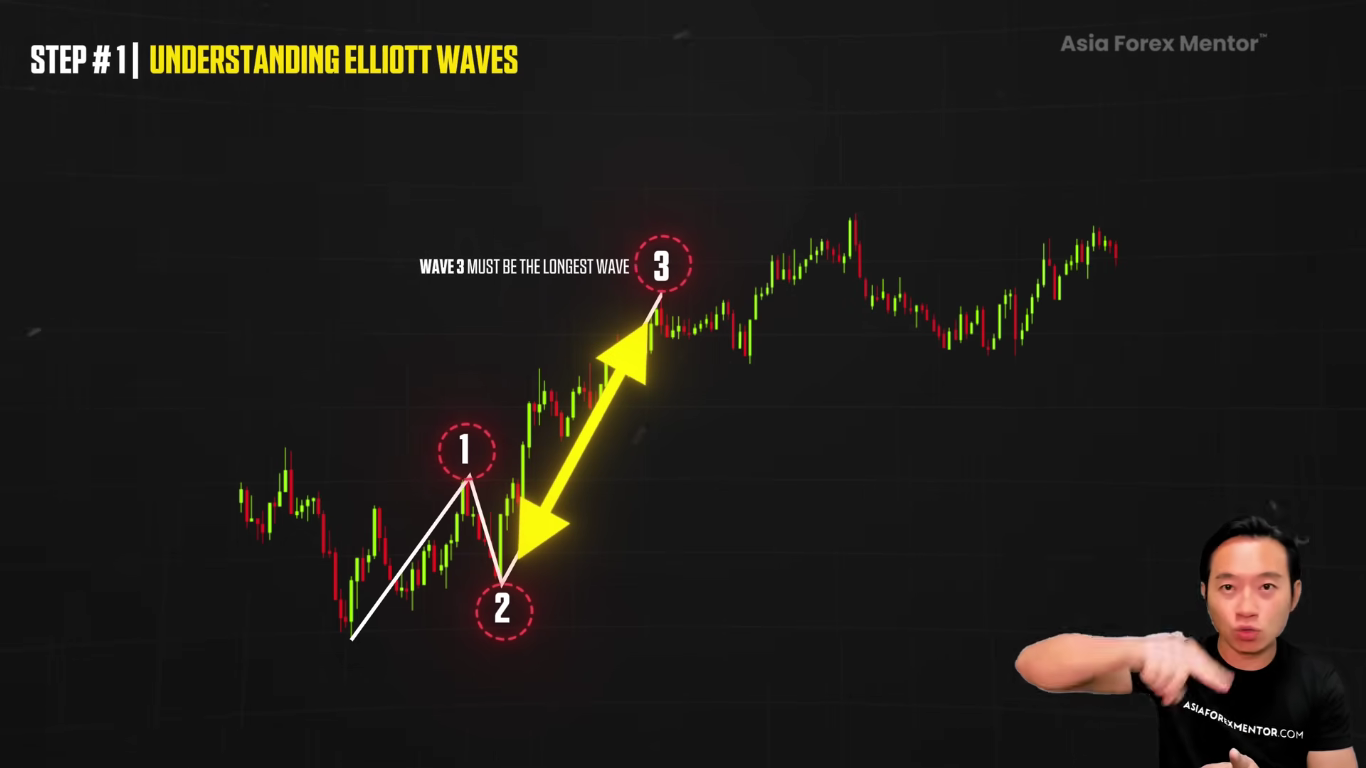
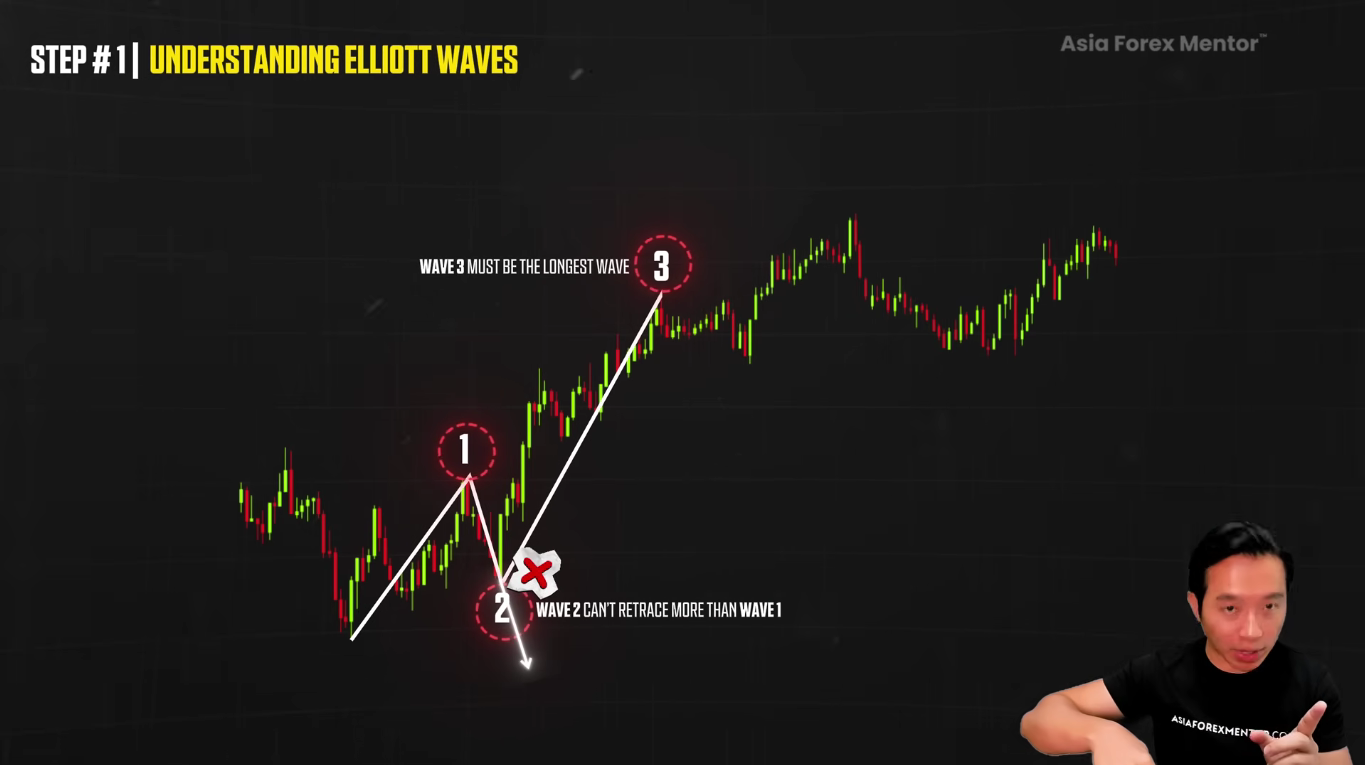
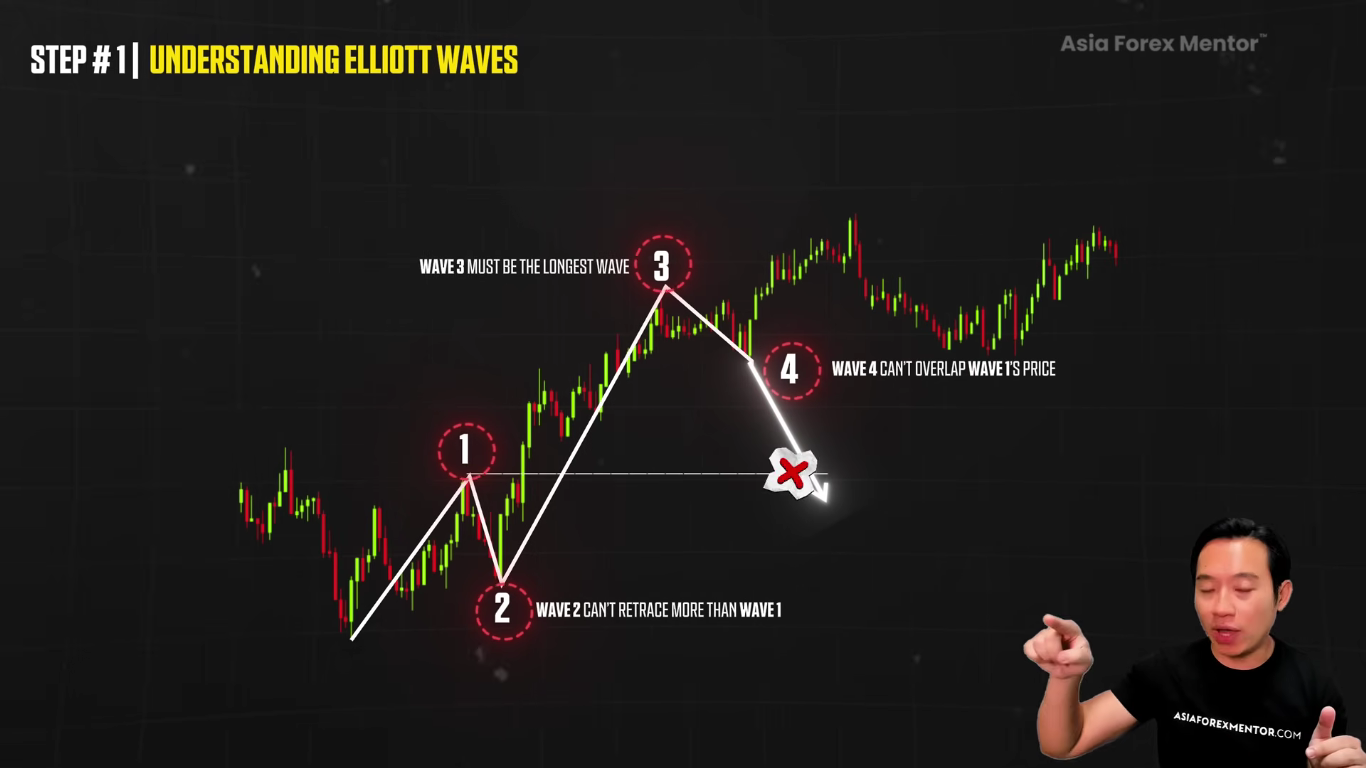
There are also three golden rules in the Elliott Wave. Here are the three golden rules. Listen up. Wave three, it must be the longest wave of all. Of all one, two, three, four, five. It must be the longest wave.
Wave number two, the correction, it cannot be retraced more or lower than wave number one.
Wave number four, the correction, cannot also overlap with number one pricing itself, which means that it's too deep. So these are the three golden rules.
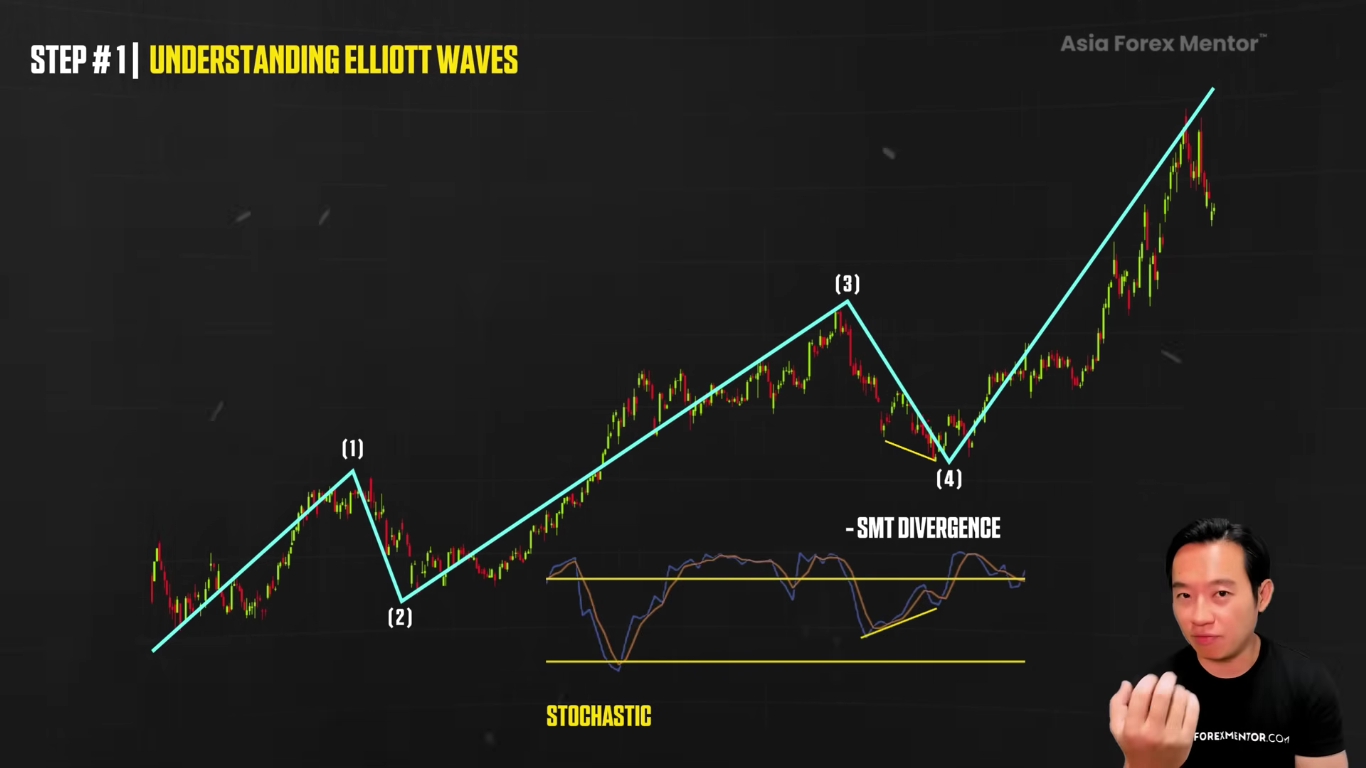
Using Divergence for Confirmation
So now, to take it one step further, when a trend starts to lose the steam, divergence can help you spot it. So it happens when price, for example, it makes a new high or new low. But the momentum indicator, for example, like the Stochastic or the MACD, they don't follow. So this tells us that a reversal might be coming. So you don't just rely on the Fibonacci ratio in the Elliott Wave. You can also use the Stochastic, the MACD and the ones that I told you earlier for extra confirmation, for confluence to give you the perfect moment to jump in.
So now I'm gonna go deeper on how to spot the patterns without Fibonacci, but using price action itself.
Step 2: Using Price Action in Elliott Waves
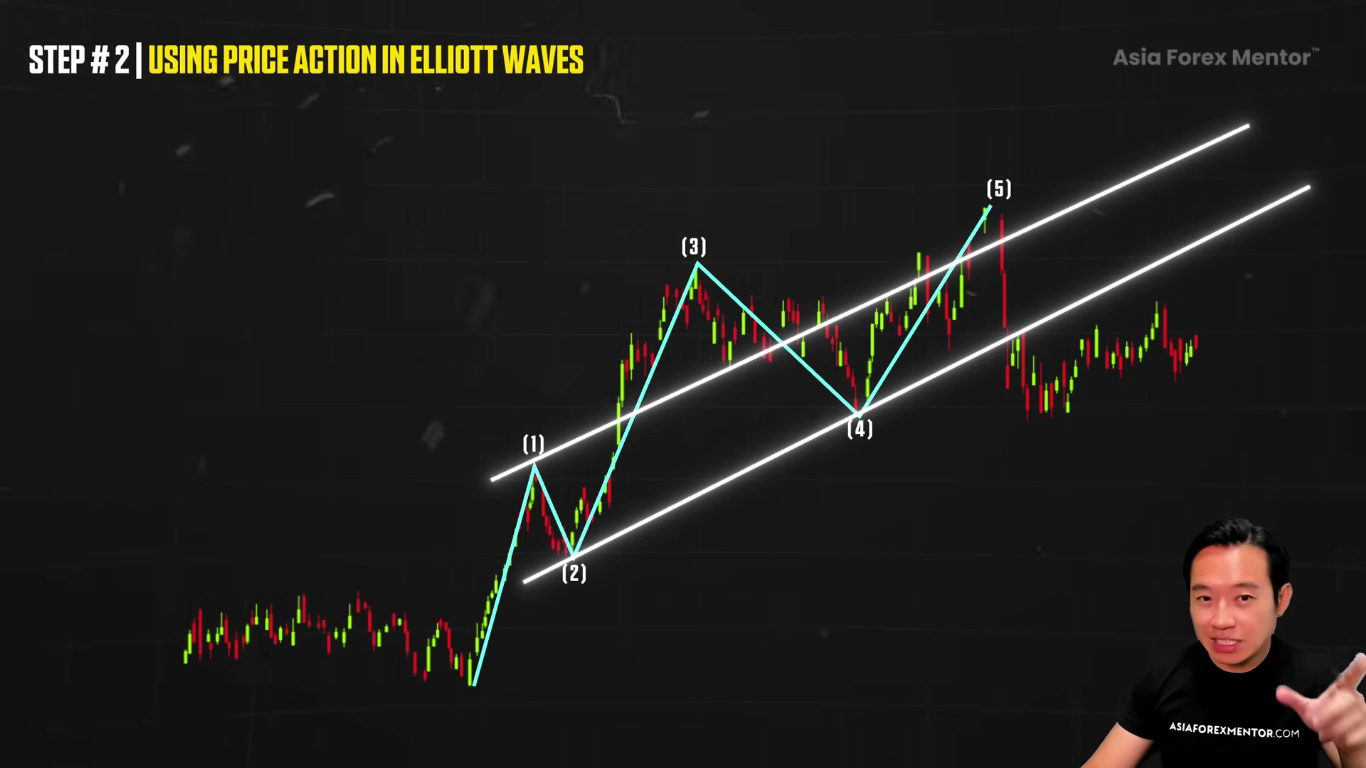
So now for those of you who may not prefer to use the Fibonacci levels like the one I told you, you can still use simple price action to define your trade entries and your exits. So one of the most basic yet effective techniques is to draw a channel. After you identify wave one and wave two,
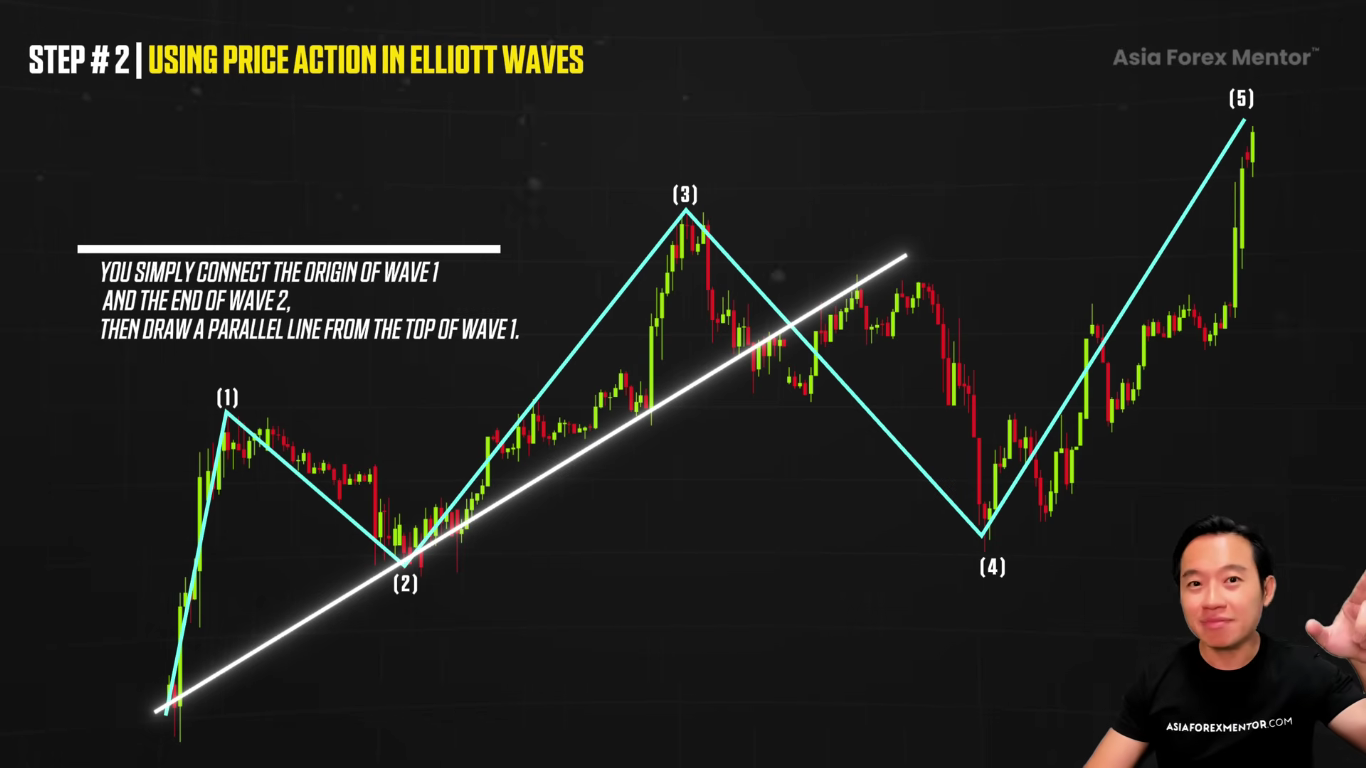
And then you draw a parallel line from the top of wave 1. So this channel becomes your minimum target for wave 3 to hit. So we don't need ratios. It's as simple as that. This is a simple method. Pretty simple, isn't it? But when applied properly, it's going to help us visualize. It's not perfect, but it's gonna help you visualize the market's next potential move, the area, the stopping area potentially.
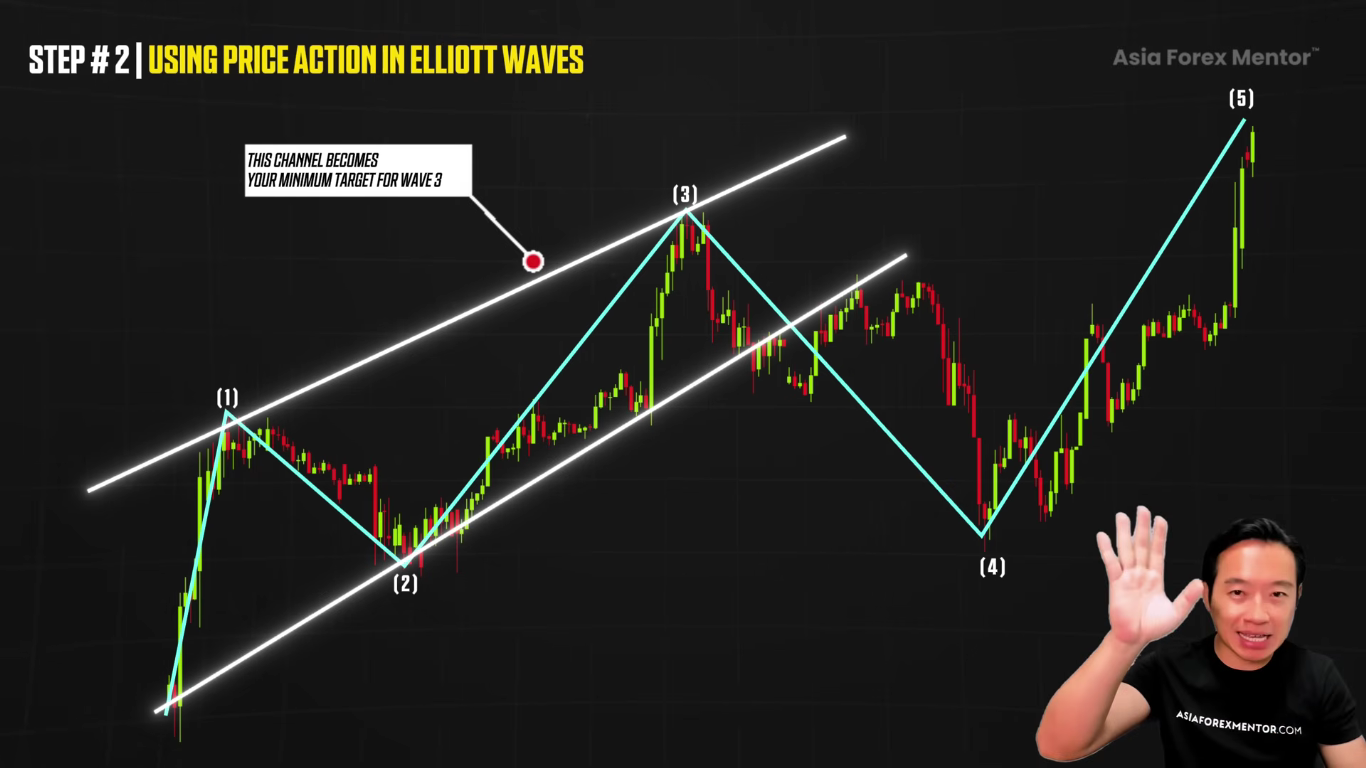
So we're gonna avoid chasing the market when it's already around the parallel level, when price is already hitting that area itself. But there's more. If wave three cannot break through the upper trend line of the channel, or it fails to reach the projected target, then something's off with our analysis.
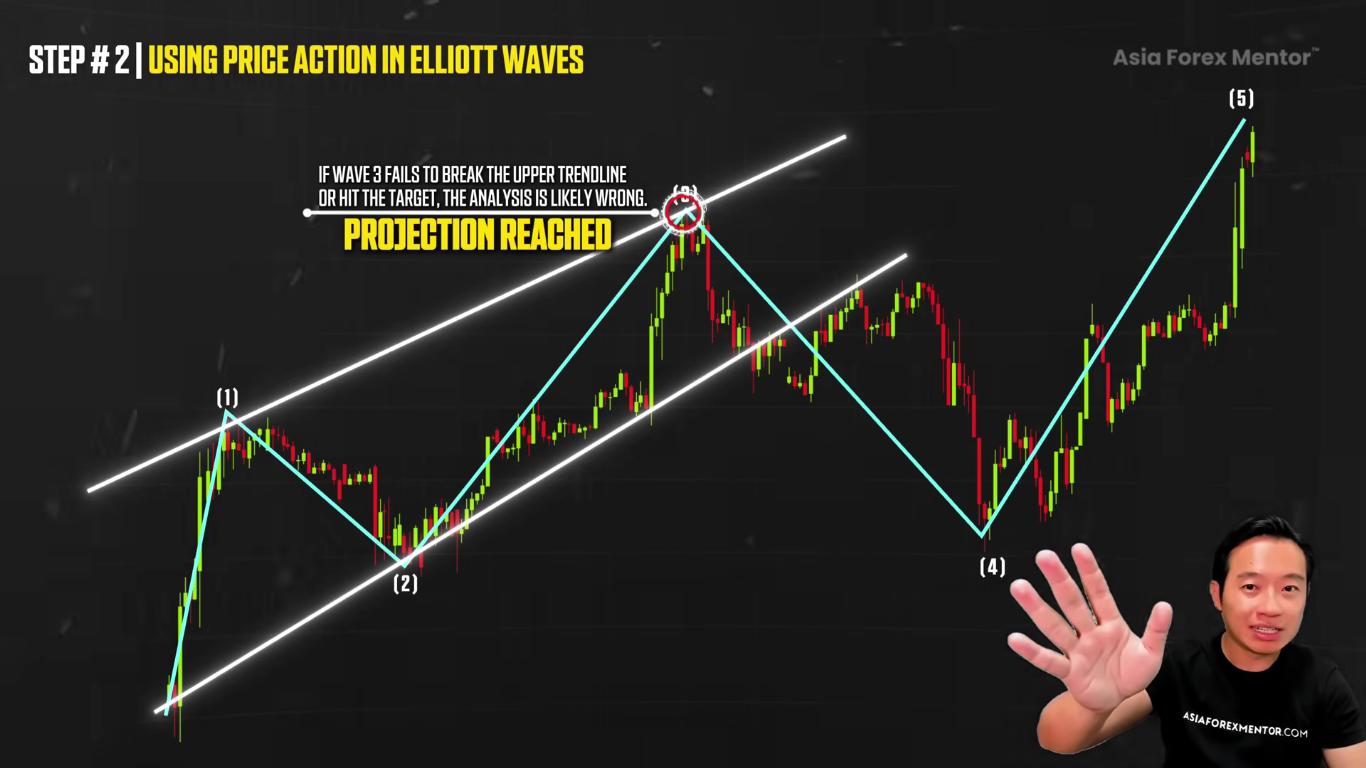
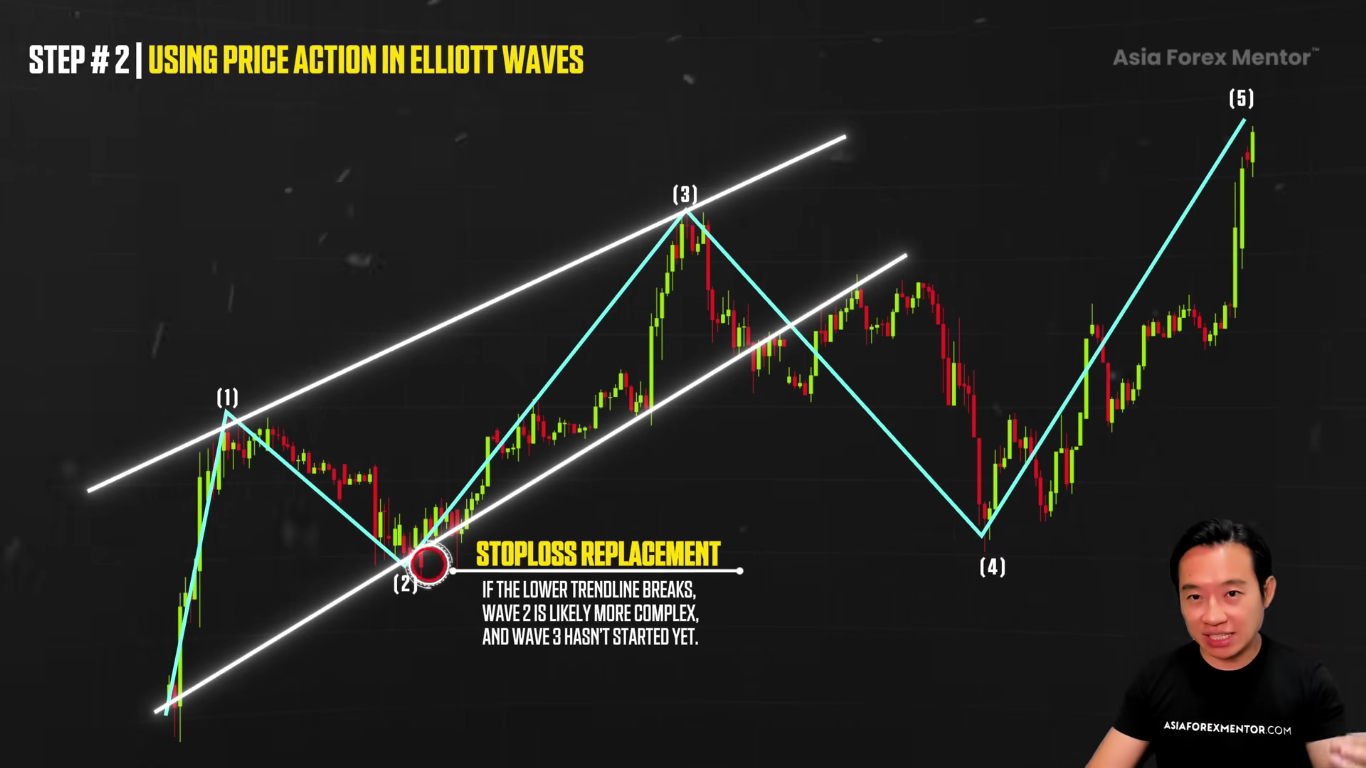
The trend might be weakening. So this is a red flag. If, on the other hand, the lower trend line of our channel gets broken, it's a strong sign that the wave 2 is more complex than initially thought. So wave 3 hasn't really begun yet.
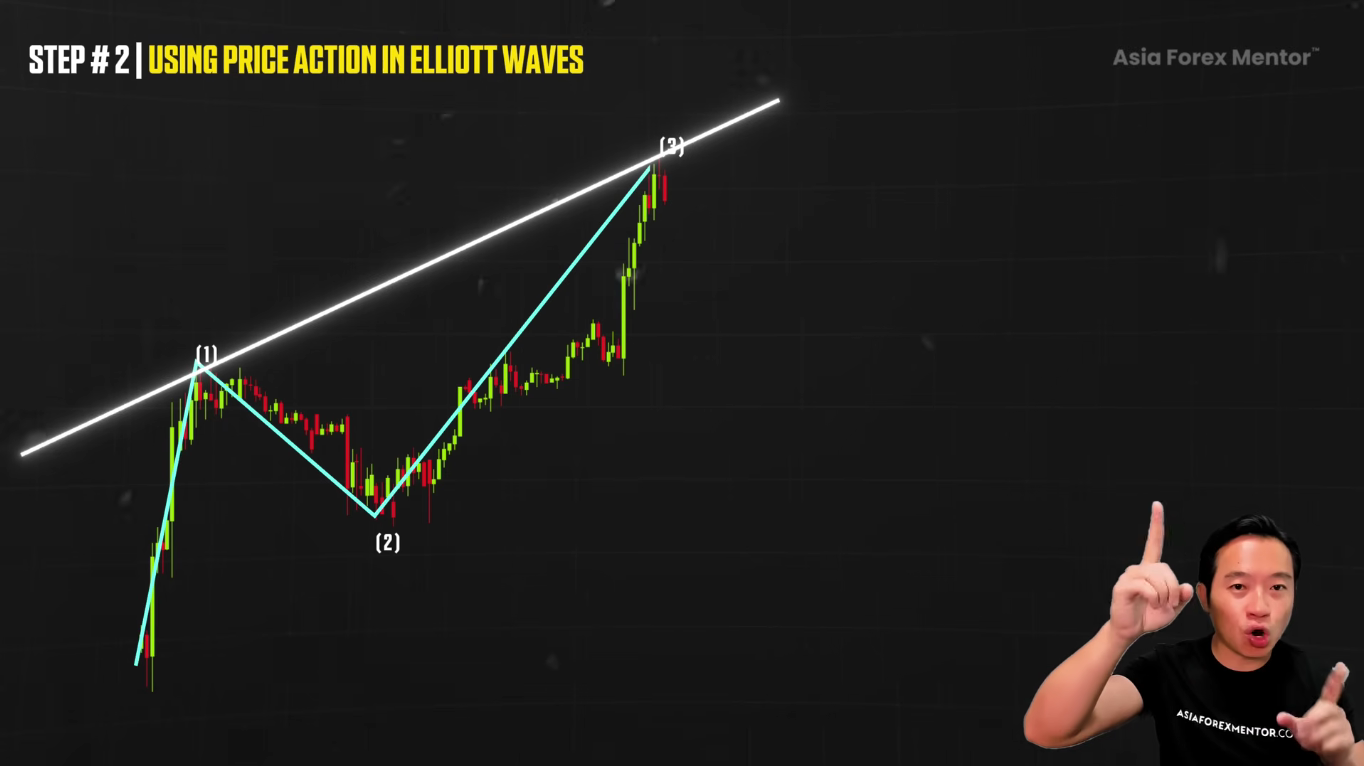
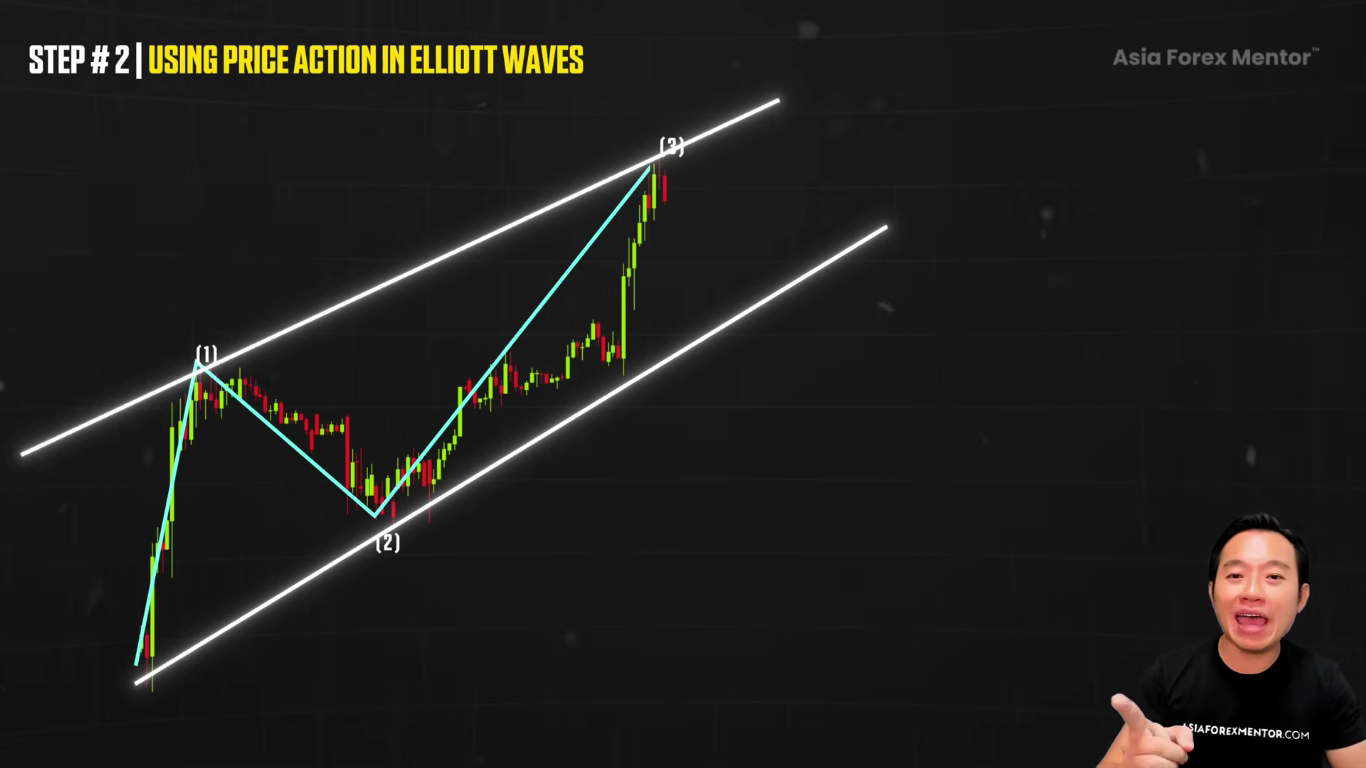
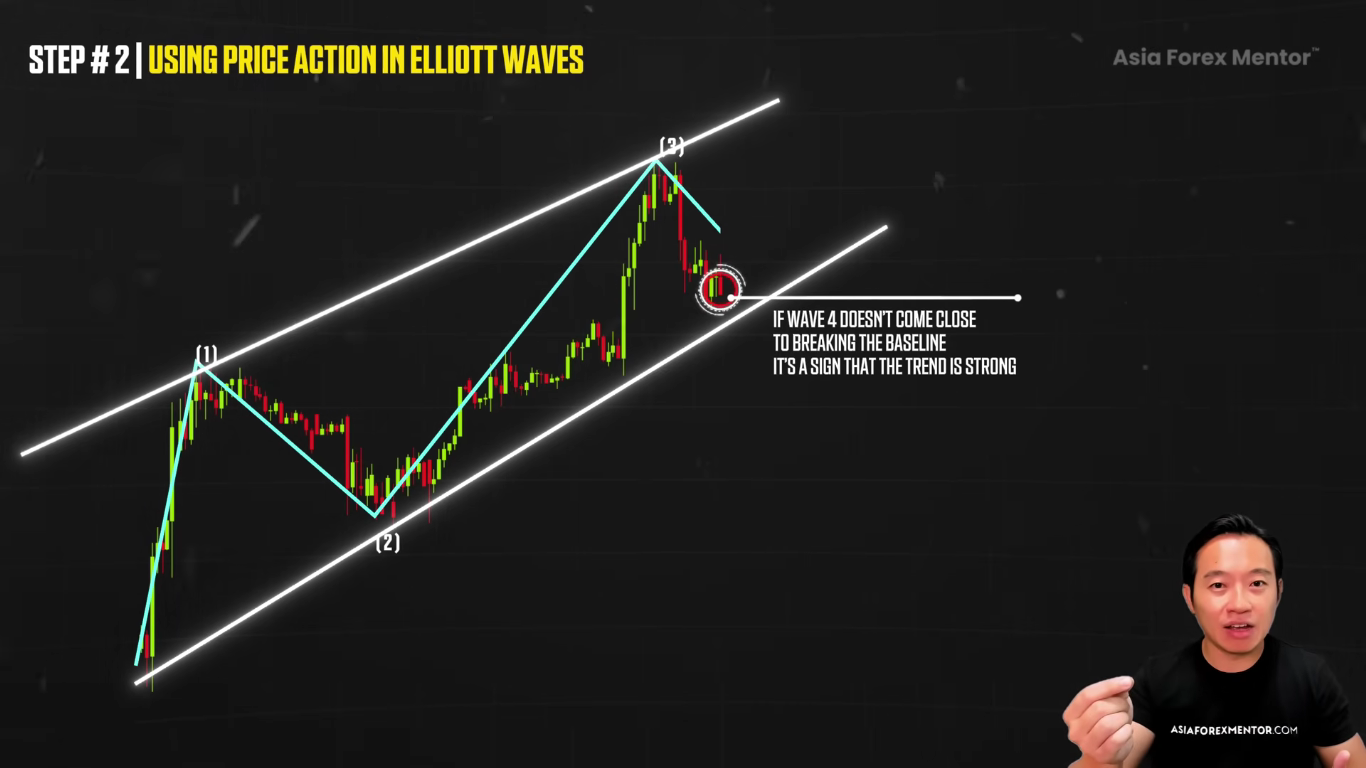
we want to keep in mind that wave three is usually the strongest and the biggest and the fastest moving wave in any cycle. if it doesn't move big time, if it doesn't accelerate like a car going real fast, this means that the market momentum is slowing. Now, once wave three has finished its move, you can now draw another channel. This time connecting wave one and wave three with a trend line.
And then you draw a parallel line from the end of wave two itself. So now we have our target for wave four itself.
So now, if wave four doesn't come close to breaking the baseline of the channel from wave three, it is a sign that the overall trend is strong. That's good. The tighter the price action, the more likely the trend is about to continue into wave 5.
But if wave 4 breaks in and breaks the baseline too much, this could indicate a weakening trend.
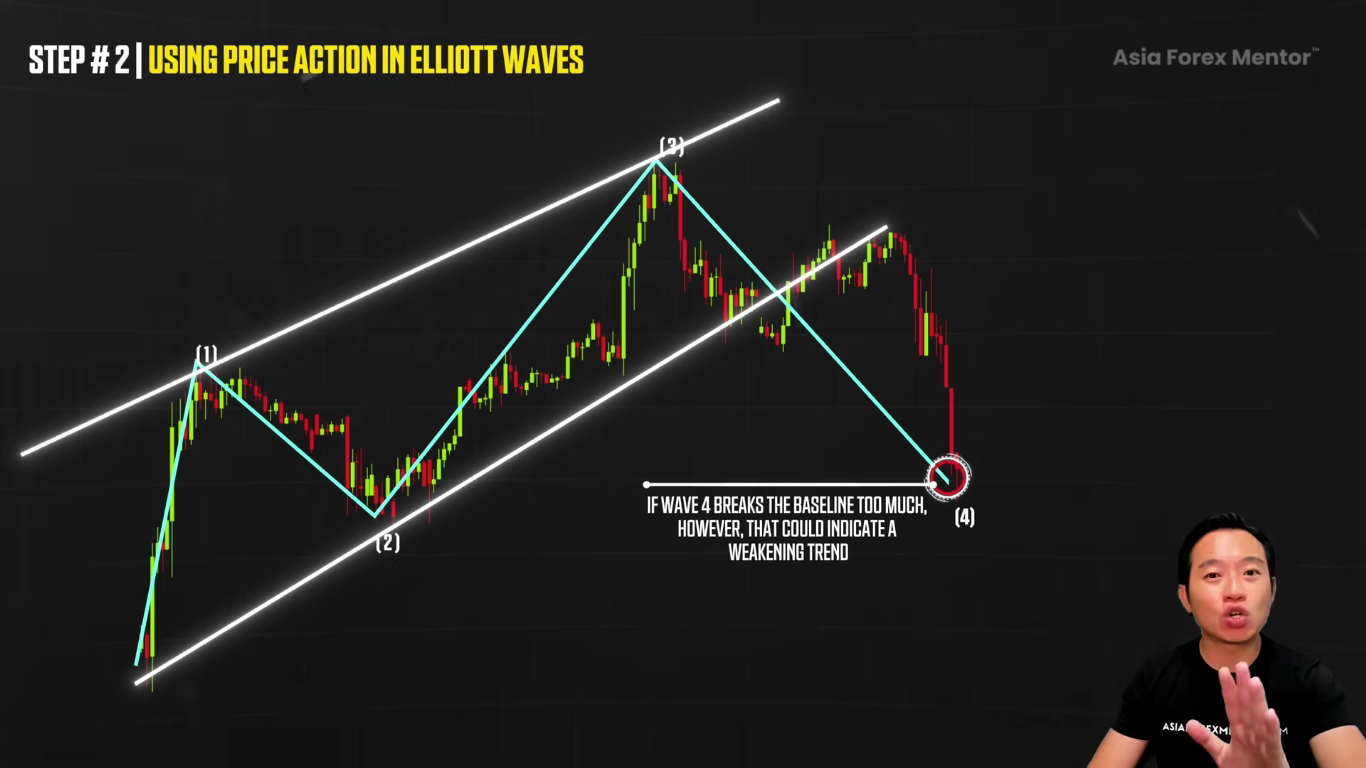
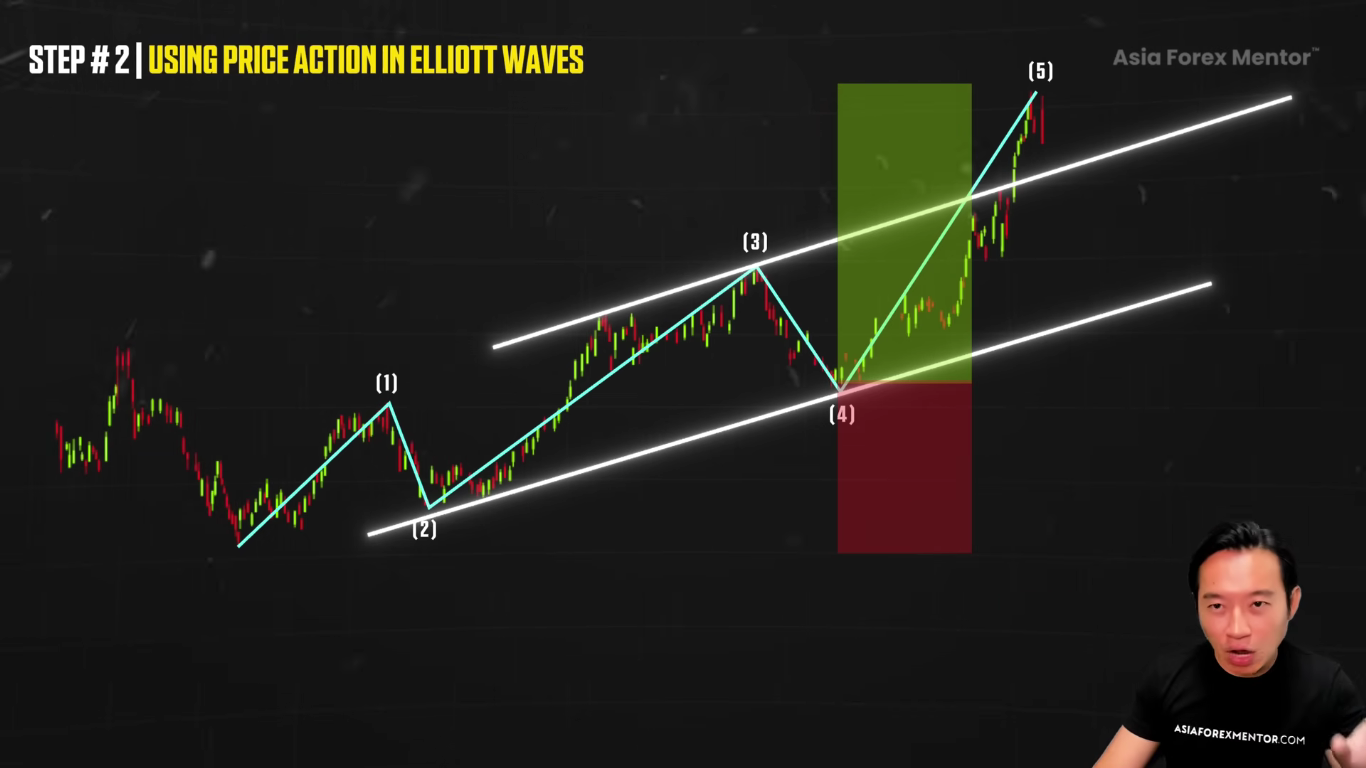
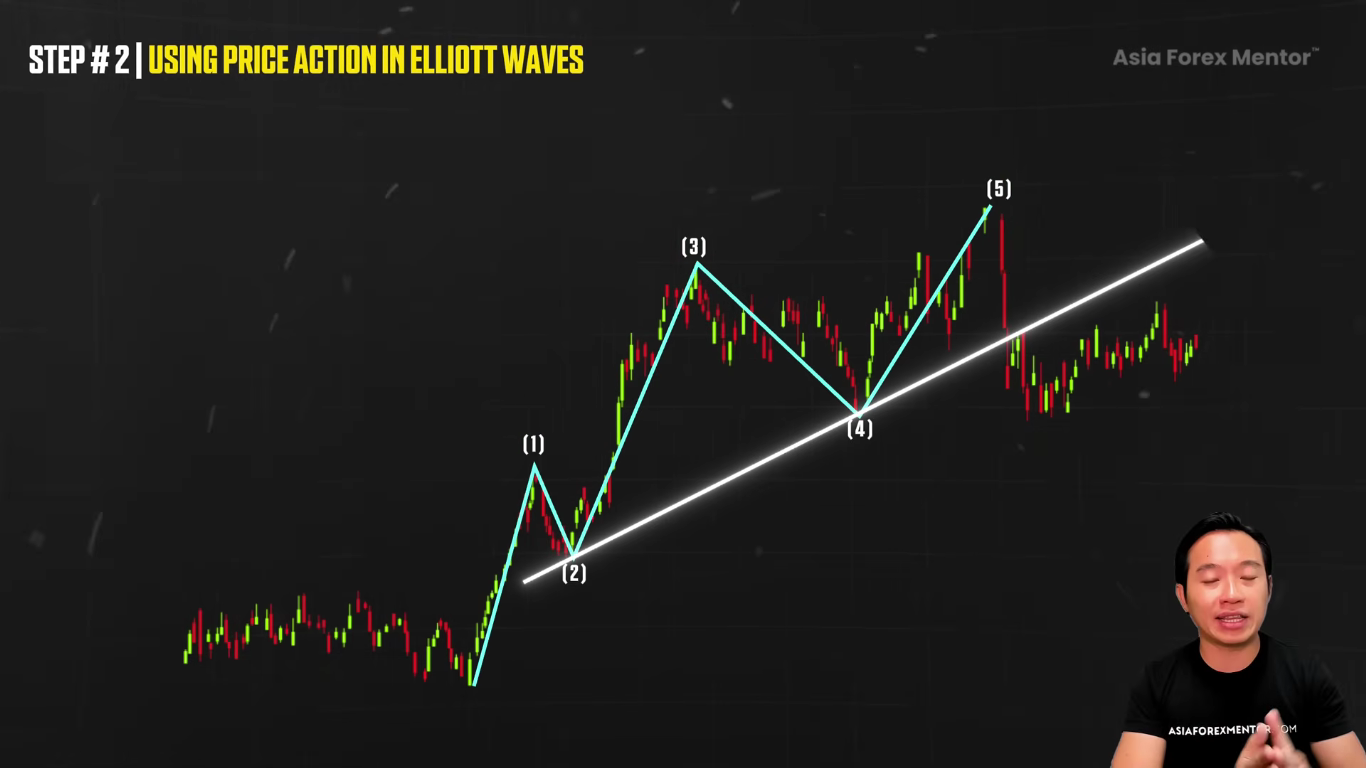
So as soon as wave 4 is completed, you can now draw a trend line from the beginning of wave 2 to the end of wave 3. And then we can now project a parallel line from the end of wave three, upwards. So this becomes our target for wave five. One, two, three, four, wave five. So you are now in the position to capture the final thrust, the final move of the overall trend itself. The overall Elliott Wave trend itself.
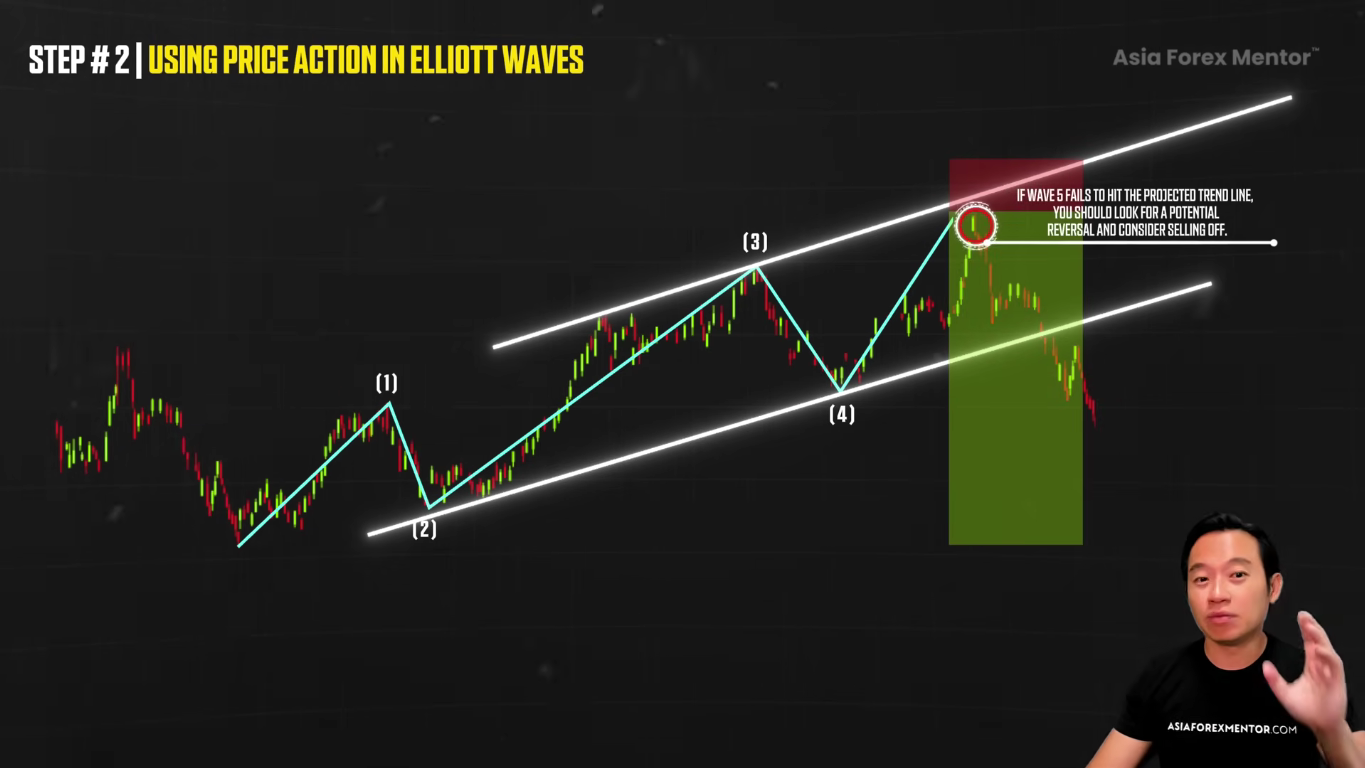
If wave five fails to hit the projected trend line, we want to look for potential reversal or even consider selling it off.
Now to wrap it up, wave three is the most important wave to watch. It is the fastest and it could be even nearly vertical movement. Big fast movement, in its rise or in its fall if it's a downtrend.
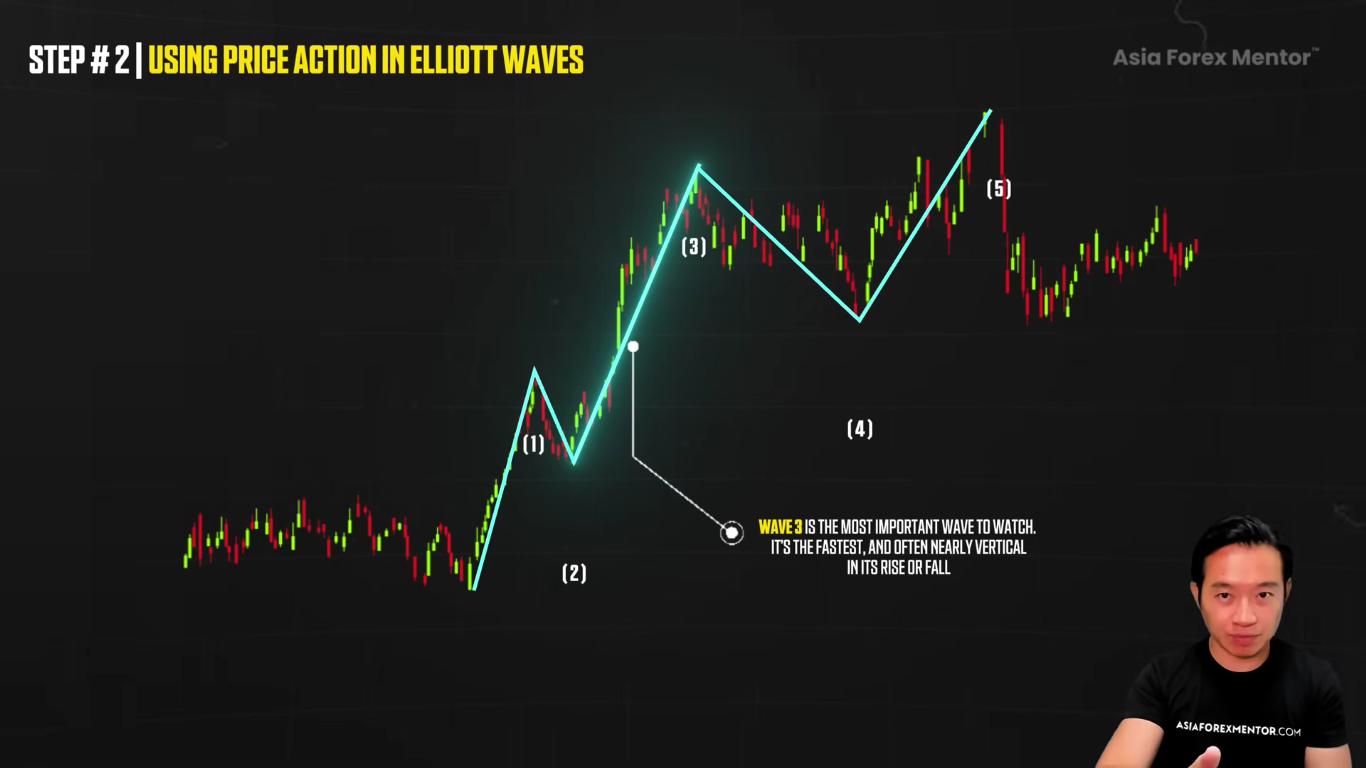
You can draw a trend line connecting wave two and wave four.
And then you can draw a parallel line from wave one itself. This parallel line will often just cut through wave 3.
And this gives us a target for wave number 5. It's like our target level.
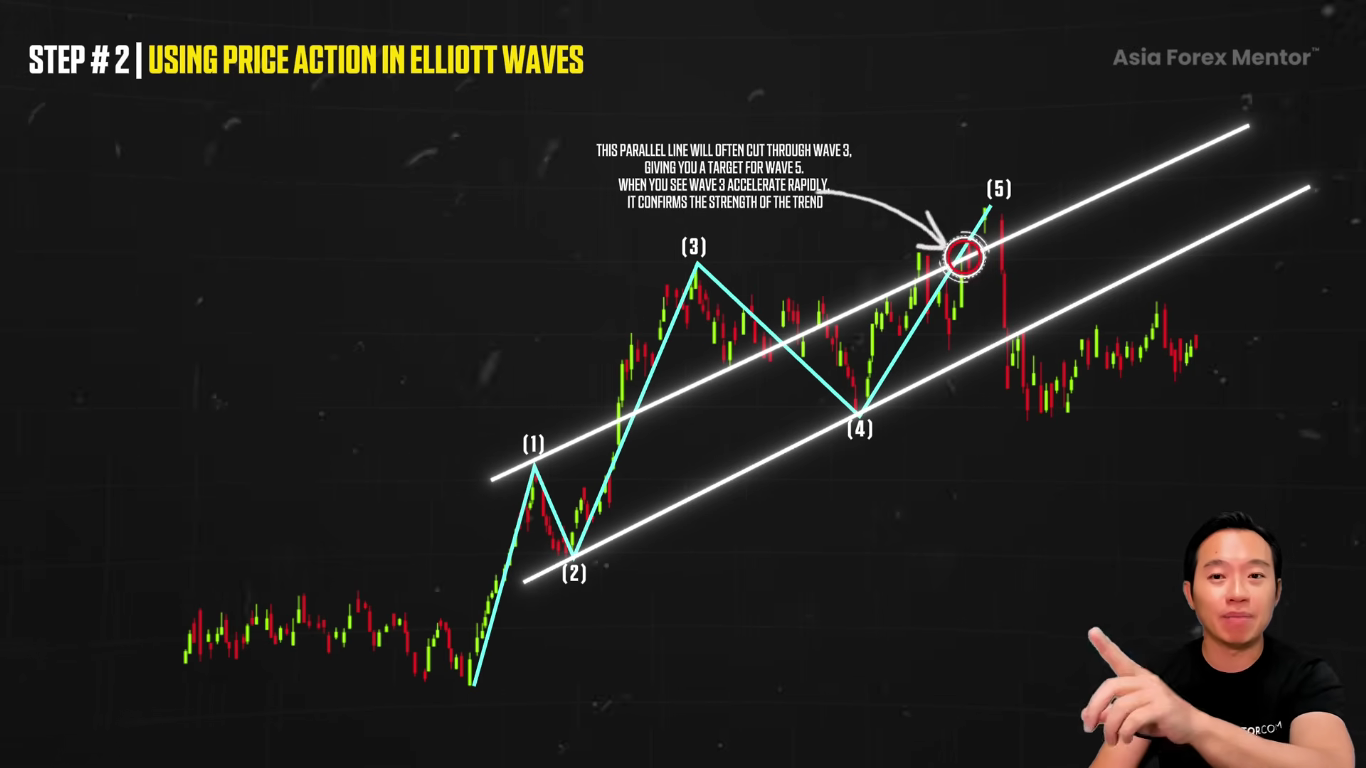
When you see wave 3 shoots rapidly, it confirms the strength of the trend itself.
But remember, Elliott Wave is all about structure. If the waves are not following the expected path, you do not hesitate to adjust your analysis. Like I said, it's a projection. It's not guaranteed. It's a projection with a good degree of probability. That's why the Elliott Wave has been successful and has been used time after time.
Putting Elliott Wave Together
The Elliott Wave is not about drawing the perfect counts, or trying to label everything, every swing as one, two, three, five. No. It's about understanding the overall market rhythm.
The impulse waves, it tells us where the real momentum is. The corrective waves, it tells us where the opportunity is for us to go in, like I told you on how to enter itself. And then we combine the structure with the Fibonacci retracement rules, which is what I told you earlier. And then you can also add on price channels.
you can also add on all the divergence confirmation like how I told you earlier. So you're no longer guessing where price might go. You're now trading within a defined framework itself. It's always good to trade in a framework. So you know when a pullback is normal, you know when a structure is actually breaking, you know when the next expansion leg is likely to begin.
What To Do Next
So here's what to do next. I wanna give you something that's gonna change the way that you trade forever. I've put together a free training that walks you through the exact three step system that I use to find high probability trades with sniper level entries, real risk control, and zero guesswork. So this is the same system that I use myself and the same one that has helped thousands of traders go from frustration to consistent wins. And I'm giving it to you for free. There's no fluff, no filler, just pure strategy. So if you ever wanted to trade with clarity and real conviction, this is the place to start. So click on the link below and I'll see you inside the training.
👉 FREE 3-Step Training: https://bit.ly/Free-3-StepTraining
FAQs
What is the Elliott Wave theory in trading? Elliott Wave theory says the market moves in repeating patterns of impulse waves and corrective waves. The impulse waves push the trend forward and the corrective waves pull back against it. When you read these waves, the market stops feeling random and starts moving in phases that you can anticipate.
What are the three golden rules of Elliott Wave? Wave three must be the longest wave of all five. Wave two cannot retrace more or lower than the start of wave one. And wave four cannot overlap the price territory of wave one. If any one of these is broken, the wave count is off and you adjust your analysis.
How far does a correction retrace in Elliott Wave? Wave two typically retraces 50 to 61.8% of wave one, and wave four typically retraces 30 to 40% of wave three. These are guidelines that help tell you whether the market is in a normal correction or about to reverse.
Can you trade Elliott Wave without Fibonacci? Yes. You can use simple price action by drawing a channel. Connect the origin of wave one to the end of wave two, draw a parallel line from the top of wave one, and that channel becomes your minimum target for wave three. You repeat the same method to project the target for wave four and wave five.
Which is the most important Elliott Wave to trade? Wave three. It is usually the strongest, biggest and fastest moving wave in the cycle, often nearly vertical. Wave three gives you the momentum, wave two and wave four give you the entries, and wave five gives you the final push.