

Learn To Trade Forex • Best Forex Trading Course • AsiaForexMentor

How to Read Candlesticks (Most Traders Get This Wrong)

Written by

Ezekiel Chew

Updated on

August 18, 2026

i
Its a default text

How to Read Candlesticks (Most Traders Get This Wrong)

Written by:

Last updated on:

August 18, 2026

Most traders who spend months learning how to read candlesticks still lose on setups that looked textbook. The pattern was never the problem. Reading it without context was.

ABOUT THIS GUIDE This guide covers three specific candlestick signals used in professional price action trading, the Fibonacci golden zone context tool, and the trend line confluence method. You will learn how to identify which signals carry real edge, how to combine them into a high probability entry sequence, and how to use multi-timeframe execution to improve your risk to reward ratio.


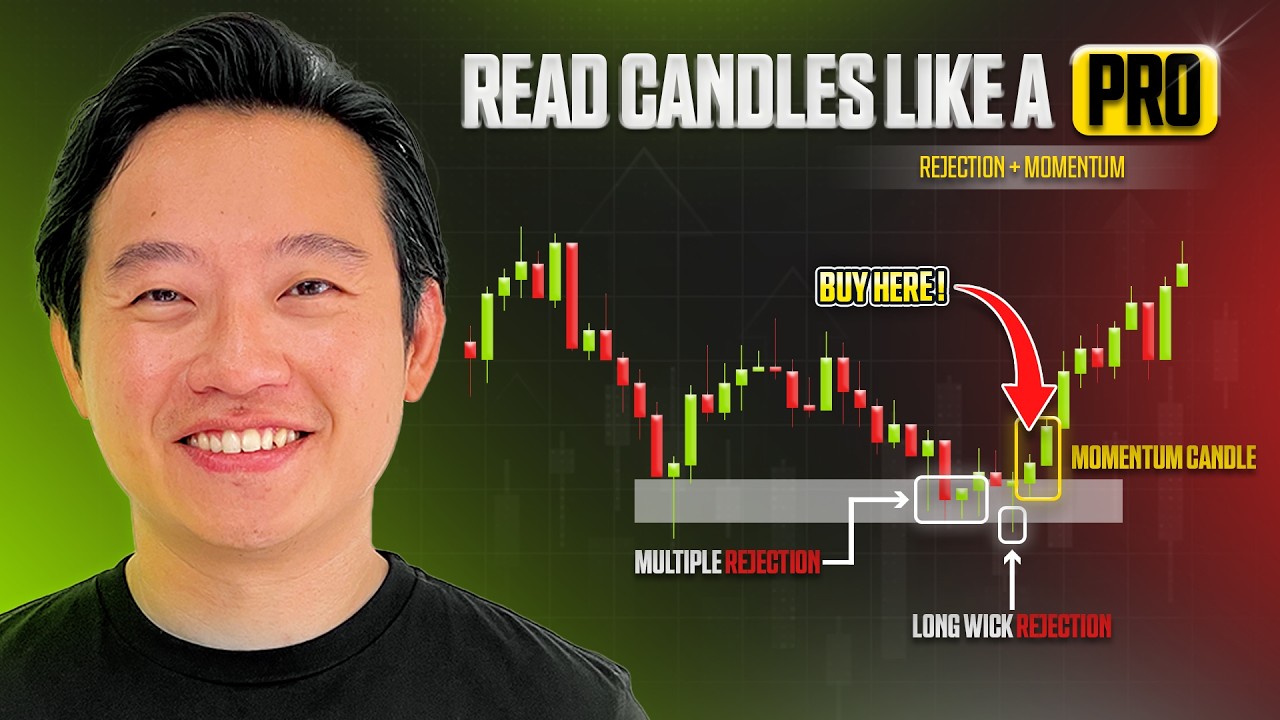
QUICK ANSWER To read candlesticks effectively, focus on three signals: the long wick rejection, multiple rejections at the same level, and the momentum candlestick. These signals only carry edge when they form at a meaningful location, such as the Fibonacci golden zone between 61.8% and 78.6%, or where a trend line intersects a structure level. Context determines whether a candle is worth acting on.


🎥 Watch the full method explained on video:
Key Takeaways

  • A candlestick pattern alone is never the signal. Location and context determine whether it has real edge.
  • The long wick rejection reveals which side pushed price hard and failed at a key level.
  • Multiple wick rejections at the same level confirm a zone actively defended with real market orders.
  • A momentum candlestick with an expanding second candle body signals accelerating buyer or seller commitment.
  • The Fibonacci golden zone (61.8% to 78.6%) identifies where deep pullbacks are most likely to reverse in an uptrend.
  • Combining a candlestick signal with trend line and structure confluence produces the highest probability entry setups.

Why Pattern Memorization Fails Most Traders

The standard approach to candlestick trading looks like this: memorize the hammer, the engulfing candle, the doji, spot the pattern on the chart, and enter. The problem is that this method treats every candle equally, regardless of where it forms or what the market is doing around it.

A hammer at a random point in the middle of a trend carries almost no predictive weight. The same pattern at a confirmed support level, following a bearish momentum candle and an indecision bar, is a completely different signal. Location and the sequence of events around the candle determine its reliability, not the shape of the candle itself.

Asia Forex Mentor has trained more than 100,000 traders across 50+ countries, and the most consistent error across all skill levels is treating pattern recognition as a standalone skill. Candlestick reading is not a catalog of shapes to memorize. It is a method for understanding who is in control at a specific price and why that matters for the next move.

Effective price action trading requires two things before any entry: a meaningful level in the market and a candlestick signal that confirms what the market is doing at that level. Remove either element and the edge disappears.

Signal 1: The Long Wick Rejection

A long wick rejection candle has a small body and a wick that extends far in one direction. One side pushed price hard during the candle. The other side pushed back before the close and reversed the move. The wick is the physical record of that failed attempt.

On a bullish long wick rejection, sellers drive price down aggressively within the candle. Buyers absorb that selling and push price back up before the close. The result is a candle with a small body near the top and a long lower wick. Sellers failed to close a strong bearish candle, and that failure signals buyers are now in control.

The candle color is not the signal. A long lower wick at support means sellers tried to break the level and got absorbed. A long upper wick at resistance means buyers pushed into a defended zone and got rejected. According to Investopedia's overview of candlestick charts , the wick or shadow represents the price extremes within the period, making it the clearest visible indicator of rejection at a level.

A wick rejection in the middle of open price action carries very little meaning. At a confirmed key level, it becomes a high probability reversal signal. This distinction is what separates traders who use wicks as genuine context from those scanning for any long wick they can find.

Signal 2: Multiple Wick Rejections at the Same Level

One wick rejection is a signal. Multiple wick rejections at the same level are a statement about where the market has placed real orders.

Price returns to a level. A wick forms. Price gets pushed back. Price returns again. Another wick forms. Another pushback. No candle closes beyond the level. Each test ends the same way.

What this behavior reveals is active defense. Real orders are sitting at that price. The more times price touches and gets rejected without closing past the level, the stronger that confirmation becomes. This is not a pattern to memorize. It is market behavior to recognize and respect.

The principle works equally in both directions. Multiple wicks at support mean buyers are absorbing every attempt to push price lower. Multiple wicks at resistance mean sellers are defending the zone with every test. When this forms, traders are watching a level the market itself has confirmed repeatedly, and that repetition is the source of the edge.

Signal 3: The Momentum Candlestick

A momentum candlestick setup is two consecutive candles of the same color where the second candle has a larger body than the first. The expanding body signals that the move is not just continuing. It is accelerating.

The detail most traders miss is in the wick on the second candle. In a bullish momentum setup, if the second candle closes with no upper wick, buyers controlled price from open to close with zero pushback. Price moved straight up and held. That clean close signals strong continuation on the following candle.

The reverse applies in a bearish momentum setup. A second bearish candle with no lower wick means sellers dominated the entire session. No buyers were strong enough to push back at any point. That candle shows where the market intends to go next.

When the second candle is larger and has no opposing wick, the market is not just moving in a direction. It is committing to it. That distinction separates a momentum candlestick worth trading from a weak continuation move worth only watching.

The Three Signals Side by Side

Here is a comparison of all three signals, what they look like, and where they carry the most weight.

Signal What It Looks Like What It Confirms Best Location
Long Wick Rejection Small body, long wick in one direction Failed push by one side, other side now in control Key support or resistance
Multiple Wick Rejections Repeated wicks at the same price, no candle closes past the level Level actively defended with real orders Horizontal structure zone
Momentum Candlestick Two same-color candles, second body larger, clean close with no opposing wick Accelerating commitment by buyers or sellers Inside a golden zone or at a breakout

The Fibonacci Golden Zone as Context

A candlestick signal without a meaningful location is just noise. The Fibonacci golden zone provides that location with precision.

When price is in an uptrend, the behavior is consistent: impulsive pushes higher followed by corrective pullbacks. The job is to identify where the next pullback is likely to end, because that is where the next buying opportunity sits. Applying the Fibonacci retracement tool from the bottom wick to the top wick of an impulsive move reveals those levels automatically.

The zone to watch is between the 61.8% and 78.6% retracement levels. This area represents a deep pullback where price is at a discount within the trend. It is deep enough to offer a meaningful entry but not so deep that the uptrend structure is broken. As Investopedia notes on Fibonacci retracement levels , the 61.8% level corresponds to the golden ratio and is considered the most significant of the key retracement zones. Institutions add to positions in this area rather than at the top of a move.

For traders who want to extend this framework into exit planning, the companion approach is covered in detail in the guide on mastering Fibonacci extension for precise exits. The entry and exit tools use the same underlying logic from opposite ends of the move.

The Entry Sequence Inside the Golden Zone

Here is the specific sequence to watch for inside the Fibonacci golden zone. Each step must occur in order before any entry is valid.

  1. Identify a clear impulsive move on the higher timeframe chart.
  2. Apply the Fibonacci retracement tool from the bottom wick to the top wick of that move.
  3. Mark the golden zone between 61.8% and 78.6%.
  4. Wait for price to enter the zone. Do not enter the moment price first touches.
  5. Watch for a bearish momentum candle as price moves down into the zone.
  6. Wait for an indecision candle with wicks on both sides and a close in the middle.
  7. Wait for a large bullish engulfing candle to close. That close is the entry confirmation.

How to Refine Your Entry on a Lower Timeframe

Entering directly on the higher timeframe engulfing candle creates a structural problem. The candle is large. The stop loss has to sit below the full candle. The risk to reward ratio often ends up at approximately 1:1 or worse.

The solution is to drop to a lower timeframe such as the 15-minute chart. Apply the Fibonacci tool again to the latest bullish move within the golden zone, measuring from the bottom wick of the lowest candle in that move. This produces a tighter golden zone on the lower timeframe and a more precise entry point.

The resulting setup uses the higher timeframe for identification and the lower timeframe for execution. The stop loss sits on the lower timeframe. The take profit target uses the structure on the higher timeframe. This approach stacks confirmations and produces a significantly better risk to reward ratio from the same underlying setup.

Understanding how to read forex charts across multiple timeframes is the foundation this technique builds on. Without that skill, the multi-timeframe execution step loses most of its practical value.

The Trend Line as Dynamic Support and Resistance

A trend line connects the swing lows in an uptrend or the swing highs in a downtrend. It moves with the market rather than sitting at a fixed price, making it dynamic support and resistance rather than a static zone.

When price pulls back into a valid trend line, that is a potential continuation entry. When price breaks through the trend line with a strong close, that is a potential reversal signal. The trend line identifies where to watch. The candlestick signal at that level determines when to act.

The highest priority setups combine a trend line with a horizontal structure level. When both point to the same price area at the same time, price has two independent reasons to react there. Understanding how these elements interact with broader market structure is what allows traders to build a consistent framework rather than reacting to individual setups in isolation.

The confirmation at a trend line and structure confluence zone follows the same logic as the Fibonacci entry sequence. An indecision candle with wicks on both sides comes first. Then a strong bullish momentum candle closes. Structure plus trend line plus candlestick signal, all aligning at one point, is the high probability setup worth waiting for.

How to Apply the Full Framework

This is the complete practical sequence for combining all three signals with both context tools. Each step filters out low quality setups. Only entries that pass all seven steps qualify as high probability trades.

Here are the seven steps to apply from chart to entry.

  1. Identify the trend: Confirm a clear uptrend with impulsive pushes and corrective pullbacks on the higher timeframe.
  2. Mark the golden zone: Apply the Fibonacci retracement tool from bottom wick to top wick. Mark 61.8% to 78.6%.
  3. Check for confluence: Look for a trend line or structure level intersecting the golden zone. Confluence raises the priority of the setup.
  4. Wait for price to enter the zone: Do not anticipate. Let price come to the level.
  5. Read the candle sequence: Watch for a bearish momentum candle, then an indecision candle inside the zone.
  6. Confirm with the engulfing candle: A large bullish engulfing candle close inside the zone is the trigger.
  7. Execute on the lower timeframe: Drop to the 15-minute chart for a tighter entry, smaller stop, and better risk to reward ratio.

A signal without a location fails at steps 2 and 3. A location without a confirming candle fails at step 6. Both must be present. That requirement is not a restriction. It is what makes the setups that do qualify genuinely reliable.

Also Read: How to Read Forex Charts Before You Lose Another Trade

Conclusion

Learning how to read candlesticks is not a question of memorizing more patterns. It is a question of understanding what each candle reveals about the balance between buyers and sellers at a specific location in the market. The long wick rejection, the multiple rejection setup, and the momentum candlestick each answer a different part of that question. The Fibonacci golden zone and the trend line confluence tell you where those answers carry real weight.

The traders who apply this framework stop reacting to every pattern they recognize and start reading what the market is actually doing. Every wick documents a failure. A rejection confirms the level is being actively defended. Momentum candles show where commitment is building and where the market intends to go next.

Traders who want to apply this in a structured system can access free forex training at Asia Forex Mentor, rated by Investopedia as the Most Comprehensive Forex Course and by Benzinga as the Best Forex Trading Course, where candlestick signals, Fibonacci levels, and market structure are taught as one integrated method.

Frequently Asked Questions

What Does It Mean to Read Candlesticks in Forex?

Reading candlesticks in forex means interpreting what each candle reveals about the behavior of buyers and sellers at a specific price level. The body of the candle shows where price opened and closed during the period. The wicks show how far price moved in each direction and where it got pushed back. Together they tell you who is in control, whether a level is being defended, and where the market is likely to move next.

What Is a Wick Rejection Candle?

A wick rejection candle has a small body and a long wick extending in one direction. The wick shows that one side pushed price aggressively during the candle but failed to hold it by the close. At key support, a long lower wick means sellers were absorbed by buyers. At resistance, a long upper wick means buyers were rejected by sellers. The candle color is a secondary detail. The wick and the level are what carry the signal.

What Is the Fibonacci Golden Zone?

The Fibonacci golden zone is the area between the 61.8% and 78.6% retracement levels, measured from the bottom wick to the top wick of an impulsive move. It identifies where deep pullbacks are most likely to find support in an uptrend. The zone matters because it represents a discounted price within the trend, deep enough for a good entry but not so deep that the trend structure is considered broken.

Why Use a Lower Timeframe Entry After Identifying a Setup on a Higher Timeframe?

Entering directly on the higher timeframe candlestick signal often creates a wide stop loss because the candles on that timeframe are large. Dropping to a lower timeframe such as the 15-minute chart allows a more precise entry within the same zone, which tightens the stop loss and improves the risk to reward ratio significantly. The setup is identified on the higher timeframe but executed on the lower timeframe for better trade mechanics.

What Makes Trend Line and Structure Confluence More Reliable Than a Single Level?

A trend line and structure confluence zone combines two different types of support or resistance at the same price point. Horizontal structure is static and sits at a fixed price. The trend line is dynamic and reflects the direction and momentum of the trend. When both align at the same area at the same time, price has two independent reasons to react there. Adding a candlestick confirmation at that intersection produces a setup supported by three separate layers of evidence rather than one.
About Ezekiel Chew​

Ezekiel Chew, founder and head of training at Asia Forex Mentor, is a renowned forex expert, frequently invited to speak at major industry events. Known for his deep market insights, Ezekiel is one of the top traders committed to supporting the trading community. Making six figures per trade, he also trains traders working in banks, fund management, and prop trading firms.

What Profit Factor Tells You Before Going Live

Profit factor is calculated by dividing a strategy’s total gross profit by its total gross loss, and most experienced traders reject any system that reads below 1.5 before risking real capital. Most traders see any positive number and call it a green light. That is where the costly mistake starts.

Read More

6 Forex Trading Scams Every Beginner Should Know

The most effective forex trading scams do not announce themselves as threats. They arrive as opportunities, come through referrals and social media, and are often indistinguishable from legitimate services until the first withdrawal request is made. ABOUT THIS GUIDE This guide covers the six most common forex trading scams, the

Read More

How to Use Fibonacci Retracement Step by Step in 2026

Most traders learn how to use Fibonacci retracement and immediately draw it wrong. This tool comes from a mathematical sequence first documented in 1202, and institutional traders use it daily to plan entries at precise price levels. The majority of retail traders miss the one placement rule that makes every

Read More

Free Margin in Forex What the MT4 Panel Shows

Free margin in forex is the one figure on the MT4 or MT5 account panel that determines whether another position can open right now, and it is consistently the last number most traders learn to read. ABOUT THIS GUIDE This guide explains what free margin is and how it connects

Read More

Scalping Trading Strategy The Pros Actually Use

The scalping trading strategy most retail traders use is not actually scalping. They are gambling on 1-minute candles with no defined edge, no position-sizing rules, and no plan for when the losses come. ABOUT THIS GUIDE This guide covers what scalping is, how professional scalpers build a repeatable edge, and

Read More

AFM Trading Summit Live

Date: Coming Soon

Join us at the AFM Trading Summit Live and learn from top industry experts through live trading sessions, market insights, and actionable strategies.

How to Read Candlesticks (Most Traders Get This Wrong)

4.0
Overall Trust Index

Written by:

Updated:

August 18, 2026
Most traders who spend months learning how to read candlesticks still lose on setups that looked textbook. The pattern was never the problem. Reading it without context was.
ABOUT THIS GUIDE This guide covers three specific candlestick signals used in professional price action trading, the Fibonacci golden zone context tool, and the trend line confluence method. You will learn how to identify which signals carry real edge, how to combine them into a high probability entry sequence, and how to use multi-timeframe execution to improve your risk to reward ratio.
 
QUICK ANSWER To read candlesticks effectively, focus on three signals: the long wick rejection, multiple rejections at the same level, and the momentum candlestick. These signals only carry edge when they form at a meaningful location, such as the Fibonacci golden zone between 61.8% and 78.6%, or where a trend line intersects a structure level. Context determines whether a candle is worth acting on.
  🎥 Watch the full method explained on video: https://youtu.be/y3Tgd6qHX-I?si=E-_Tfl1svjxBnSNn

Key Takeaways

  • A candlestick pattern alone is never the signal. Location and context determine whether it has real edge.
  • The long wick rejection reveals which side pushed price hard and failed at a key level.
  • Multiple wick rejections at the same level confirm a zone actively defended with real market orders.
  • A momentum candlestick with an expanding second candle body signals accelerating buyer or seller commitment.
  • The Fibonacci golden zone (61.8% to 78.6%) identifies where deep pullbacks are most likely to reverse in an uptrend.
  • Combining a candlestick signal with trend line and structure confluence produces the highest probability entry setups.

Why Pattern Memorization Fails Most Traders

The standard approach to candlestick trading looks like this: memorize the hammer, the engulfing candle, the doji, spot the pattern on the chart, and enter. The problem is that this method treats every candle equally, regardless of where it forms or what the market is doing around it. A hammer at a random point in the middle of a trend carries almost no predictive weight. The same pattern at a confirmed support level, following a bearish momentum candle and an indecision bar, is a completely different signal. Location and the sequence of events around the candle determine its reliability, not the shape of the candle itself. Asia Forex Mentor has trained more than 100,000 traders across 50+ countries, and the most consistent error across all skill levels is treating pattern recognition as a standalone skill. Candlestick reading is not a catalog of shapes to memorize. It is a method for understanding who is in control at a specific price and why that matters for the next move. Effective price action trading requires two things before any entry: a meaningful level in the market and a candlestick signal that confirms what the market is doing at that level. Remove either element and the edge disappears.

Signal 1: The Long Wick Rejection

A long wick rejection candle has a small body and a wick that extends far in one direction. One side pushed price hard during the candle. The other side pushed back before the close and reversed the move. The wick is the physical record of that failed attempt. On a bullish long wick rejection, sellers drive price down aggressively within the candle. Buyers absorb that selling and push price back up before the close. The result is a candle with a small body near the top and a long lower wick. Sellers failed to close a strong bearish candle, and that failure signals buyers are now in control. The candle color is not the signal. A long lower wick at support means sellers tried to break the level and got absorbed. A long upper wick at resistance means buyers pushed into a defended zone and got rejected. According to Investopedia's overview of candlestick charts, the wick or shadow represents the price extremes within the period, making it the clearest visible indicator of rejection at a level. A wick rejection in the middle of open price action carries very little meaning. At a confirmed key level, it becomes a high probability reversal signal. This distinction is what separates traders who use wicks as genuine context from those scanning for any long wick they can find.

Signal 2: Multiple Wick Rejections at the Same Level

One wick rejection is a signal. Multiple wick rejections at the same level are a statement about where the market has placed real orders. Price returns to a level. A wick forms. Price gets pushed back. Price returns again. Another wick forms. Another pushback. No candle closes beyond the level. Each test ends the same way. What this behavior reveals is active defense. Real orders are sitting at that price. The more times price touches and gets rejected without closing past the level, the stronger that confirmation becomes. This is not a pattern to memorize. It is market behavior to recognize and respect. The principle works equally in both directions. Multiple wicks at support mean buyers are absorbing every attempt to push price lower. Multiple wicks at resistance mean sellers are defending the zone with every test. When this forms, traders are watching a level the market itself has confirmed repeatedly, and that repetition is the source of the edge.

Signal 3: The Momentum Candlestick

A momentum candlestick setup is two consecutive candles of the same color where the second candle has a larger body than the first. The expanding body signals that the move is not just continuing. It is accelerating. The detail most traders miss is in the wick on the second candle. In a bullish momentum setup, if the second candle closes with no upper wick, buyers controlled price from open to close with zero pushback. Price moved straight up and held. That clean close signals strong continuation on the following candle. The reverse applies in a bearish momentum setup. A second bearish candle with no lower wick means sellers dominated the entire session. No buyers were strong enough to push back at any point. That candle shows where the market intends to go next. When the second candle is larger and has no opposing wick, the market is not just moving in a direction. It is committing to it. That distinction separates a momentum candlestick worth trading from a weak continuation move worth only watching.

The Three Signals Side by Side

Here is a comparison of all three signals, what they look like, and where they carry the most weight.
Signal What It Looks Like What It Confirms Best Location
Long Wick Rejection Small body, long wick in one direction Failed push by one side, other side now in control Key support or resistance
Multiple Wick Rejections Repeated wicks at the same price, no candle closes past the level Level actively defended with real orders Horizontal structure zone
Momentum Candlestick Two same-color candles, second body larger, clean close with no opposing wick Accelerating commitment by buyers or sellers Inside a golden zone or at a breakout

The Fibonacci Golden Zone as Context

A candlestick signal without a meaningful location is just noise. The Fibonacci golden zone provides that location with precision. When price is in an uptrend, the behavior is consistent: impulsive pushes higher followed by corrective pullbacks. The job is to identify where the next pullback is likely to end, because that is where the next buying opportunity sits. Applying the Fibonacci retracement tool from the bottom wick to the top wick of an impulsive move reveals those levels automatically. The zone to watch is between the 61.8% and 78.6% retracement levels. This area represents a deep pullback where price is at a discount within the trend. It is deep enough to offer a meaningful entry but not so deep that the uptrend structure is broken. As Investopedia notes on Fibonacci retracement levels, the 61.8% level corresponds to the golden ratio and is considered the most significant of the key retracement zones. Institutions add to positions in this area rather than at the top of a move. For traders who want to extend this framework into exit planning, the companion approach is covered in detail in the guide on mastering Fibonacci extension for precise exits. The entry and exit tools use the same underlying logic from opposite ends of the move.

The Entry Sequence Inside the Golden Zone

Here is the specific sequence to watch for inside the Fibonacci golden zone. Each step must occur in order before any entry is valid.
  1. Identify a clear impulsive move on the higher timeframe chart.
  2. Apply the Fibonacci retracement tool from the bottom wick to the top wick of that move.
  3. Mark the golden zone between 61.8% and 78.6%.
  4. Wait for price to enter the zone. Do not enter the moment price first touches.
  5. Watch for a bearish momentum candle as price moves down into the zone.
  6. Wait for an indecision candle with wicks on both sides and a close in the middle.
  7. Wait for a large bullish engulfing candle to close. That close is the entry confirmation.

How to Refine Your Entry on a Lower Timeframe

Entering directly on the higher timeframe engulfing candle creates a structural problem. The candle is large. The stop loss has to sit below the full candle. The risk to reward ratio often ends up at approximately 1:1 or worse. The solution is to drop to a lower timeframe such as the 15-minute chart. Apply the Fibonacci tool again to the latest bullish move within the golden zone, measuring from the bottom wick of the lowest candle in that move. This produces a tighter golden zone on the lower timeframe and a more precise entry point. The resulting setup uses the higher timeframe for identification and the lower timeframe for execution. The stop loss sits on the lower timeframe. The take profit target uses the structure on the higher timeframe. This approach stacks confirmations and produces a significantly better risk to reward ratio from the same underlying setup. Understanding how to read forex charts across multiple timeframes is the foundation this technique builds on. Without that skill, the multi-timeframe execution step loses most of its practical value.

The Trend Line as Dynamic Support and Resistance

A trend line connects the swing lows in an uptrend or the swing highs in a downtrend. It moves with the market rather than sitting at a fixed price, making it dynamic support and resistance rather than a static zone. When price pulls back into a valid trend line, that is a potential continuation entry. When price breaks through the trend line with a strong close, that is a potential reversal signal. The trend line identifies where to watch. The candlestick signal at that level determines when to act. The highest priority setups combine a trend line with a horizontal structure level. When both point to the same price area at the same time, price has two independent reasons to react there. Understanding how these elements interact with broader market structure is what allows traders to build a consistent framework rather than reacting to individual setups in isolation. The confirmation at a trend line and structure confluence zone follows the same logic as the Fibonacci entry sequence. An indecision candle with wicks on both sides comes first. Then a strong bullish momentum candle closes. Structure plus trend line plus candlestick signal, all aligning at one point, is the high probability setup worth waiting for.

How to Apply the Full Framework

This is the complete practical sequence for combining all three signals with both context tools. Each step filters out low quality setups. Only entries that pass all seven steps qualify as high probability trades. Here are the seven steps to apply from chart to entry.
  1. Identify the trend: Confirm a clear uptrend with impulsive pushes and corrective pullbacks on the higher timeframe.
  2. Mark the golden zone: Apply the Fibonacci retracement tool from bottom wick to top wick. Mark 61.8% to 78.6%.
  3. Check for confluence: Look for a trend line or structure level intersecting the golden zone. Confluence raises the priority of the setup.
  4. Wait for price to enter the zone: Do not anticipate. Let price come to the level.
  5. Read the candle sequence: Watch for a bearish momentum candle, then an indecision candle inside the zone.
  6. Confirm with the engulfing candle: A large bullish engulfing candle close inside the zone is the trigger.
  7. Execute on the lower timeframe: Drop to the 15-minute chart for a tighter entry, smaller stop, and better risk to reward ratio.
A signal without a location fails at steps 2 and 3. A location without a confirming candle fails at step 6. Both must be present. That requirement is not a restriction. It is what makes the setups that do qualify genuinely reliable.

Also Read: How to Read Forex Charts Before You Lose Another Trade

Conclusion

Learning how to read candlesticks is not a question of memorizing more patterns. It is a question of understanding what each candle reveals about the balance between buyers and sellers at a specific location in the market. The long wick rejection, the multiple rejection setup, and the momentum candlestick each answer a different part of that question. The Fibonacci golden zone and the trend line confluence tell you where those answers carry real weight. The traders who apply this framework stop reacting to every pattern they recognize and start reading what the market is actually doing. Every wick documents a failure. A rejection confirms the level is being actively defended. Momentum candles show where commitment is building and where the market intends to go next. Traders who want to apply this in a structured system can access free forex training at Asia Forex Mentor, rated by Investopedia as the Most Comprehensive Forex Course and by Benzinga as the Best Forex Trading Course, where candlestick signals, Fibonacci levels, and market structure are taught as one integrated method.

Frequently Asked Questions

What Does It Mean to Read Candlesticks in Forex?

Reading candlesticks in forex means interpreting what each candle reveals about the behavior of buyers and sellers at a specific price level. The body of the candle shows where price opened and closed during the period. The wicks show how far price moved in each direction and where it got pushed back. Together they tell you who is in control, whether a level is being defended, and where the market is likely to move next.

What Is a Wick Rejection Candle?

A wick rejection candle has a small body and a long wick extending in one direction. The wick shows that one side pushed price aggressively during the candle but failed to hold it by the close. At key support, a long lower wick means sellers were absorbed by buyers. At resistance, a long upper wick means buyers were rejected by sellers. The candle color is a secondary detail. The wick and the level are what carry the signal.

What Is the Fibonacci Golden Zone?

The Fibonacci golden zone is the area between the 61.8% and 78.6% retracement levels, measured from the bottom wick to the top wick of an impulsive move. It identifies where deep pullbacks are most likely to find support in an uptrend. The zone matters because it represents a discounted price within the trend, deep enough for a good entry but not so deep that the trend structure is considered broken.

Why Use a Lower Timeframe Entry After Identifying a Setup on a Higher Timeframe?

Entering directly on the higher timeframe candlestick signal often creates a wide stop loss because the candles on that timeframe are large. Dropping to a lower timeframe such as the 15-minute chart allows a more precise entry within the same zone, which tightens the stop loss and improves the risk to reward ratio significantly. The setup is identified on the higher timeframe but executed on the lower timeframe for better trade mechanics.

What Makes Trend Line and Structure Confluence More Reliable Than a Single Level?

A trend line and structure confluence zone combines two different types of support or resistance at the same price point. Horizontal structure is static and sits at a fixed price. The trend line is dynamic and reflects the direction and momentum of the trend. When both align at the same area at the same time, price has two independent reasons to react there. Adding a candlestick confirmation at that intersection produces a setup supported by three separate layers of evidence rather than one.

ezekiel chew asiaforexmentor

About Ezekiel Chew

Ezekiel Chew, founder and head of training at Asia Forex Mentor, is a renowned forex expert, frequently invited to speak at major industry events. Known for his deep market insights, Ezekiel is one of the top traders committed to supporting the trading community. Making six figures per trade, he also trains traders working in banks, fund management, and prop trading firms.

RELATED ARTICLES

How to Read Candlesticks (Most Traders Get This Wrong)

4.0
Overall Trust Index

Written by:

Updated:

August 18, 2026
Most traders who spend months learning how to read candlesticks still lose on setups that looked textbook. The pattern was never the problem. Reading it without context was.
ABOUT THIS GUIDE This guide covers three specific candlestick signals used in professional price action trading, the Fibonacci golden zone context tool, and the trend line confluence method. You will learn how to identify which signals carry real edge, how to combine them into a high probability entry sequence, and how to use multi-timeframe execution to improve your risk to reward ratio.
 
QUICK ANSWER To read candlesticks effectively, focus on three signals: the long wick rejection, multiple rejections at the same level, and the momentum candlestick. These signals only carry edge when they form at a meaningful location, such as the Fibonacci golden zone between 61.8% and 78.6%, or where a trend line intersects a structure level. Context determines whether a candle is worth acting on.
  🎥 Watch the full method explained on video: https://youtu.be/y3Tgd6qHX-I?si=E-_Tfl1svjxBnSNn

Key Takeaways

  • A candlestick pattern alone is never the signal. Location and context determine whether it has real edge.
  • The long wick rejection reveals which side pushed price hard and failed at a key level.
  • Multiple wick rejections at the same level confirm a zone actively defended with real market orders.
  • A momentum candlestick with an expanding second candle body signals accelerating buyer or seller commitment.
  • The Fibonacci golden zone (61.8% to 78.6%) identifies where deep pullbacks are most likely to reverse in an uptrend.
  • Combining a candlestick signal with trend line and structure confluence produces the highest probability entry setups.

Why Pattern Memorization Fails Most Traders

The standard approach to candlestick trading looks like this: memorize the hammer, the engulfing candle, the doji, spot the pattern on the chart, and enter. The problem is that this method treats every candle equally, regardless of where it forms or what the market is doing around it. A hammer at a random point in the middle of a trend carries almost no predictive weight. The same pattern at a confirmed support level, following a bearish momentum candle and an indecision bar, is a completely different signal. Location and the sequence of events around the candle determine its reliability, not the shape of the candle itself. Asia Forex Mentor has trained more than 100,000 traders across 50+ countries, and the most consistent error across all skill levels is treating pattern recognition as a standalone skill. Candlestick reading is not a catalog of shapes to memorize. It is a method for understanding who is in control at a specific price and why that matters for the next move. Effective price action trading requires two things before any entry: a meaningful level in the market and a candlestick signal that confirms what the market is doing at that level. Remove either element and the edge disappears.

Signal 1: The Long Wick Rejection

A long wick rejection candle has a small body and a wick that extends far in one direction. One side pushed price hard during the candle. The other side pushed back before the close and reversed the move. The wick is the physical record of that failed attempt. On a bullish long wick rejection, sellers drive price down aggressively within the candle. Buyers absorb that selling and push price back up before the close. The result is a candle with a small body near the top and a long lower wick. Sellers failed to close a strong bearish candle, and that failure signals buyers are now in control. The candle color is not the signal. A long lower wick at support means sellers tried to break the level and got absorbed. A long upper wick at resistance means buyers pushed into a defended zone and got rejected. According to Investopedia's overview of candlestick charts, the wick or shadow represents the price extremes within the period, making it the clearest visible indicator of rejection at a level. A wick rejection in the middle of open price action carries very little meaning. At a confirmed key level, it becomes a high probability reversal signal. This distinction is what separates traders who use wicks as genuine context from those scanning for any long wick they can find.

Signal 2: Multiple Wick Rejections at the Same Level

One wick rejection is a signal. Multiple wick rejections at the same level are a statement about where the market has placed real orders. Price returns to a level. A wick forms. Price gets pushed back. Price returns again. Another wick forms. Another pushback. No candle closes beyond the level. Each test ends the same way. What this behavior reveals is active defense. Real orders are sitting at that price. The more times price touches and gets rejected without closing past the level, the stronger that confirmation becomes. This is not a pattern to memorize. It is market behavior to recognize and respect. The principle works equally in both directions. Multiple wicks at support mean buyers are absorbing every attempt to push price lower. Multiple wicks at resistance mean sellers are defending the zone with every test. When this forms, traders are watching a level the market itself has confirmed repeatedly, and that repetition is the source of the edge.

Signal 3: The Momentum Candlestick

A momentum candlestick setup is two consecutive candles of the same color where the second candle has a larger body than the first. The expanding body signals that the move is not just continuing. It is accelerating. The detail most traders miss is in the wick on the second candle. In a bullish momentum setup, if the second candle closes with no upper wick, buyers controlled price from open to close with zero pushback. Price moved straight up and held. That clean close signals strong continuation on the following candle. The reverse applies in a bearish momentum setup. A second bearish candle with no lower wick means sellers dominated the entire session. No buyers were strong enough to push back at any point. That candle shows where the market intends to go next. When the second candle is larger and has no opposing wick, the market is not just moving in a direction. It is committing to it. That distinction separates a momentum candlestick worth trading from a weak continuation move worth only watching.

The Three Signals Side by Side

Here is a comparison of all three signals, what they look like, and where they carry the most weight.
Signal What It Looks Like What It Confirms Best Location
Long Wick Rejection Small body, long wick in one direction Failed push by one side, other side now in control Key support or resistance
Multiple Wick Rejections Repeated wicks at the same price, no candle closes past the level Level actively defended with real orders Horizontal structure zone
Momentum Candlestick Two same-color candles, second body larger, clean close with no opposing wick Accelerating commitment by buyers or sellers Inside a golden zone or at a breakout

The Fibonacci Golden Zone as Context

A candlestick signal without a meaningful location is just noise. The Fibonacci golden zone provides that location with precision. When price is in an uptrend, the behavior is consistent: impulsive pushes higher followed by corrective pullbacks. The job is to identify where the next pullback is likely to end, because that is where the next buying opportunity sits. Applying the Fibonacci retracement tool from the bottom wick to the top wick of an impulsive move reveals those levels automatically. The zone to watch is between the 61.8% and 78.6% retracement levels. This area represents a deep pullback where price is at a discount within the trend. It is deep enough to offer a meaningful entry but not so deep that the uptrend structure is broken. As Investopedia notes on Fibonacci retracement levels, the 61.8% level corresponds to the golden ratio and is considered the most significant of the key retracement zones. Institutions add to positions in this area rather than at the top of a move. For traders who want to extend this framework into exit planning, the companion approach is covered in detail in the guide on mastering Fibonacci extension for precise exits. The entry and exit tools use the same underlying logic from opposite ends of the move.

The Entry Sequence Inside the Golden Zone

Here is the specific sequence to watch for inside the Fibonacci golden zone. Each step must occur in order before any entry is valid.
  1. Identify a clear impulsive move on the higher timeframe chart.
  2. Apply the Fibonacci retracement tool from the bottom wick to the top wick of that move.
  3. Mark the golden zone between 61.8% and 78.6%.
  4. Wait for price to enter the zone. Do not enter the moment price first touches.
  5. Watch for a bearish momentum candle as price moves down into the zone.
  6. Wait for an indecision candle with wicks on both sides and a close in the middle.
  7. Wait for a large bullish engulfing candle to close. That close is the entry confirmation.

How to Refine Your Entry on a Lower Timeframe

Entering directly on the higher timeframe engulfing candle creates a structural problem. The candle is large. The stop loss has to sit below the full candle. The risk to reward ratio often ends up at approximately 1:1 or worse. The solution is to drop to a lower timeframe such as the 15-minute chart. Apply the Fibonacci tool again to the latest bullish move within the golden zone, measuring from the bottom wick of the lowest candle in that move. This produces a tighter golden zone on the lower timeframe and a more precise entry point. The resulting setup uses the higher timeframe for identification and the lower timeframe for execution. The stop loss sits on the lower timeframe. The take profit target uses the structure on the higher timeframe. This approach stacks confirmations and produces a significantly better risk to reward ratio from the same underlying setup. Understanding how to read forex charts across multiple timeframes is the foundation this technique builds on. Without that skill, the multi-timeframe execution step loses most of its practical value.

The Trend Line as Dynamic Support and Resistance

A trend line connects the swing lows in an uptrend or the swing highs in a downtrend. It moves with the market rather than sitting at a fixed price, making it dynamic support and resistance rather than a static zone. When price pulls back into a valid trend line, that is a potential continuation entry. When price breaks through the trend line with a strong close, that is a potential reversal signal. The trend line identifies where to watch. The candlestick signal at that level determines when to act. The highest priority setups combine a trend line with a horizontal structure level. When both point to the same price area at the same time, price has two independent reasons to react there. Understanding how these elements interact with broader market structure is what allows traders to build a consistent framework rather than reacting to individual setups in isolation. The confirmation at a trend line and structure confluence zone follows the same logic as the Fibonacci entry sequence. An indecision candle with wicks on both sides comes first. Then a strong bullish momentum candle closes. Structure plus trend line plus candlestick signal, all aligning at one point, is the high probability setup worth waiting for.

How to Apply the Full Framework

This is the complete practical sequence for combining all three signals with both context tools. Each step filters out low quality setups. Only entries that pass all seven steps qualify as high probability trades. Here are the seven steps to apply from chart to entry.
  1. Identify the trend: Confirm a clear uptrend with impulsive pushes and corrective pullbacks on the higher timeframe.
  2. Mark the golden zone: Apply the Fibonacci retracement tool from bottom wick to top wick. Mark 61.8% to 78.6%.
  3. Check for confluence: Look for a trend line or structure level intersecting the golden zone. Confluence raises the priority of the setup.
  4. Wait for price to enter the zone: Do not anticipate. Let price come to the level.
  5. Read the candle sequence: Watch for a bearish momentum candle, then an indecision candle inside the zone.
  6. Confirm with the engulfing candle: A large bullish engulfing candle close inside the zone is the trigger.
  7. Execute on the lower timeframe: Drop to the 15-minute chart for a tighter entry, smaller stop, and better risk to reward ratio.
A signal without a location fails at steps 2 and 3. A location without a confirming candle fails at step 6. Both must be present. That requirement is not a restriction. It is what makes the setups that do qualify genuinely reliable.

Also Read: How to Read Forex Charts Before You Lose Another Trade

Conclusion

Learning how to read candlesticks is not a question of memorizing more patterns. It is a question of understanding what each candle reveals about the balance between buyers and sellers at a specific location in the market. The long wick rejection, the multiple rejection setup, and the momentum candlestick each answer a different part of that question. The Fibonacci golden zone and the trend line confluence tell you where those answers carry real weight. The traders who apply this framework stop reacting to every pattern they recognize and start reading what the market is actually doing. Every wick documents a failure. A rejection confirms the level is being actively defended. Momentum candles show where commitment is building and where the market intends to go next. Traders who want to apply this in a structured system can access free forex training at Asia Forex Mentor, rated by Investopedia as the Most Comprehensive Forex Course and by Benzinga as the Best Forex Trading Course, where candlestick signals, Fibonacci levels, and market structure are taught as one integrated method.

Frequently Asked Questions

What Does It Mean to Read Candlesticks in Forex?

Reading candlesticks in forex means interpreting what each candle reveals about the behavior of buyers and sellers at a specific price level. The body of the candle shows where price opened and closed during the period. The wicks show how far price moved in each direction and where it got pushed back. Together they tell you who is in control, whether a level is being defended, and where the market is likely to move next.

What Is a Wick Rejection Candle?

A wick rejection candle has a small body and a long wick extending in one direction. The wick shows that one side pushed price aggressively during the candle but failed to hold it by the close. At key support, a long lower wick means sellers were absorbed by buyers. At resistance, a long upper wick means buyers were rejected by sellers. The candle color is a secondary detail. The wick and the level are what carry the signal.

What Is the Fibonacci Golden Zone?

The Fibonacci golden zone is the area between the 61.8% and 78.6% retracement levels, measured from the bottom wick to the top wick of an impulsive move. It identifies where deep pullbacks are most likely to find support in an uptrend. The zone matters because it represents a discounted price within the trend, deep enough for a good entry but not so deep that the trend structure is considered broken.

Why Use a Lower Timeframe Entry After Identifying a Setup on a Higher Timeframe?

Entering directly on the higher timeframe candlestick signal often creates a wide stop loss because the candles on that timeframe are large. Dropping to a lower timeframe such as the 15-minute chart allows a more precise entry within the same zone, which tightens the stop loss and improves the risk to reward ratio significantly. The setup is identified on the higher timeframe but executed on the lower timeframe for better trade mechanics.

What Makes Trend Line and Structure Confluence More Reliable Than a Single Level?

A trend line and structure confluence zone combines two different types of support or resistance at the same price point. Horizontal structure is static and sits at a fixed price. The trend line is dynamic and reflects the direction and momentum of the trend. When both align at the same area at the same time, price has two independent reasons to react there. Adding a candlestick confirmation at that intersection produces a setup supported by three separate layers of evidence rather than one.

ezekiel chew asiaforexmentor

About Ezekiel Chew

Ezekiel Chew, founder and head of training at Asia Forex Mentor, is a renowned forex expert, frequently invited to speak at major industry events. Known for his deep market insights, Ezekiel is one of the top traders committed to supporting the trading community. Making six figures per trade, he also trains traders working in banks, fund management, and prop trading firms.

RELATED ARTICLES

Join the Live Event
Get Your Free Ticket Now

I consent to receiving emails and/or text message reminders for this event.

REGISTER FOR THE MASTERCLASS!