Everything that you have been taught about the market structure is making you enter too late. I've watched thousands of traders, they get this wrong itself. They got a clean analysis. They got a perfect read, but they still get stopped out before the move even starts. So the analysis is not the problem. The location is. Wrong location, wrong timing, wrong phase of the market itself. So by the end of this video, all three are fixed and that shift alone could change your next 10 trades.
You're going to learn:
- How to time your entry on the pullback, so you stop entering after the move is already done
- How to read dynamic structure with trend lines and the 8 and 21 SMA when price won't come back to a clean level
- How to read the full market cycle with Wyckoff, so you stop trading the wrong phase of the market
Fix your location, your timing, and your phase and you stop guessing and start reading.
📺 Watch the full breakdown in the video:
Strategy 1: Timing the Pullback Entry
Most traders, they lose because they enter too late. After the move has already been done. Now let's fix that with a simple idea.
This is where the market structure starts becoming useful in a real trade itself. Because a trend is not just about price moving up in an uptrend or moving down in a downtrend. A trend also gives you a very repeatable way to enter after a pullback itself.
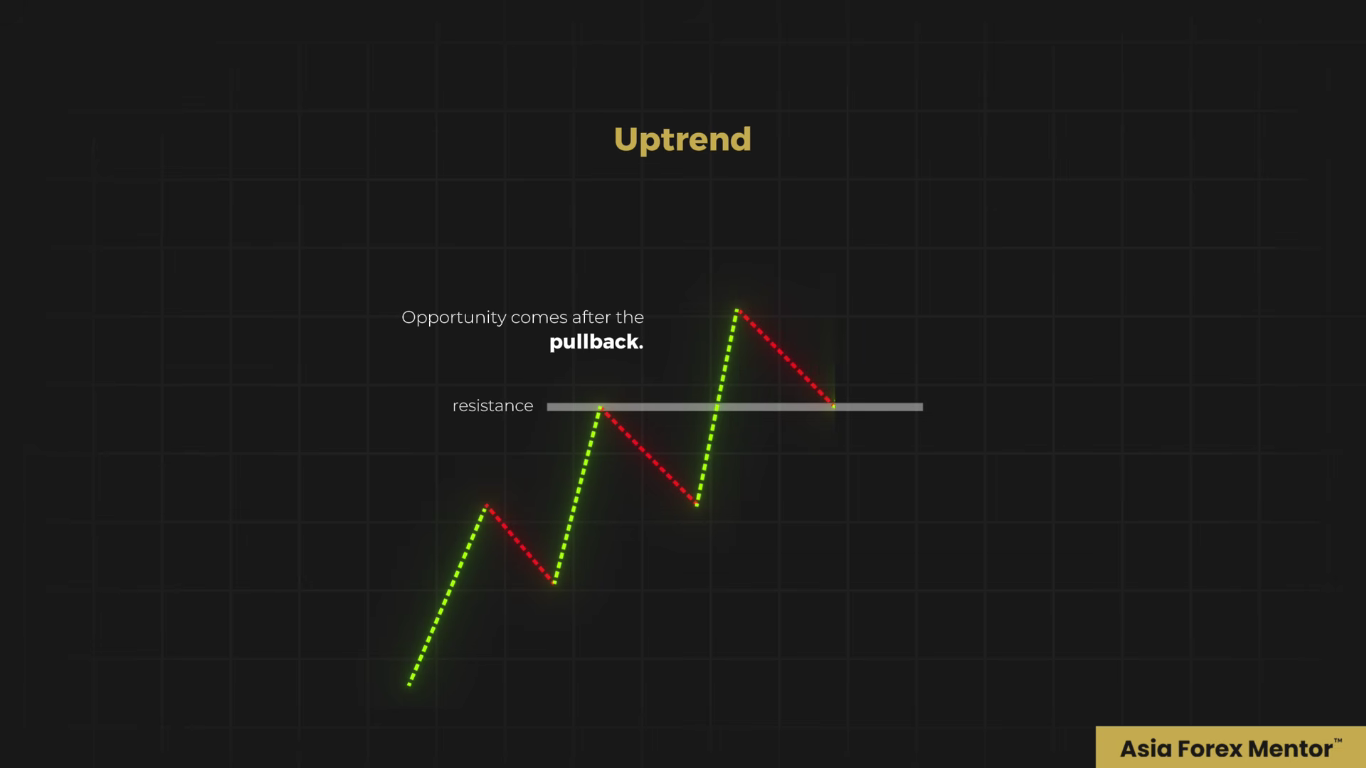
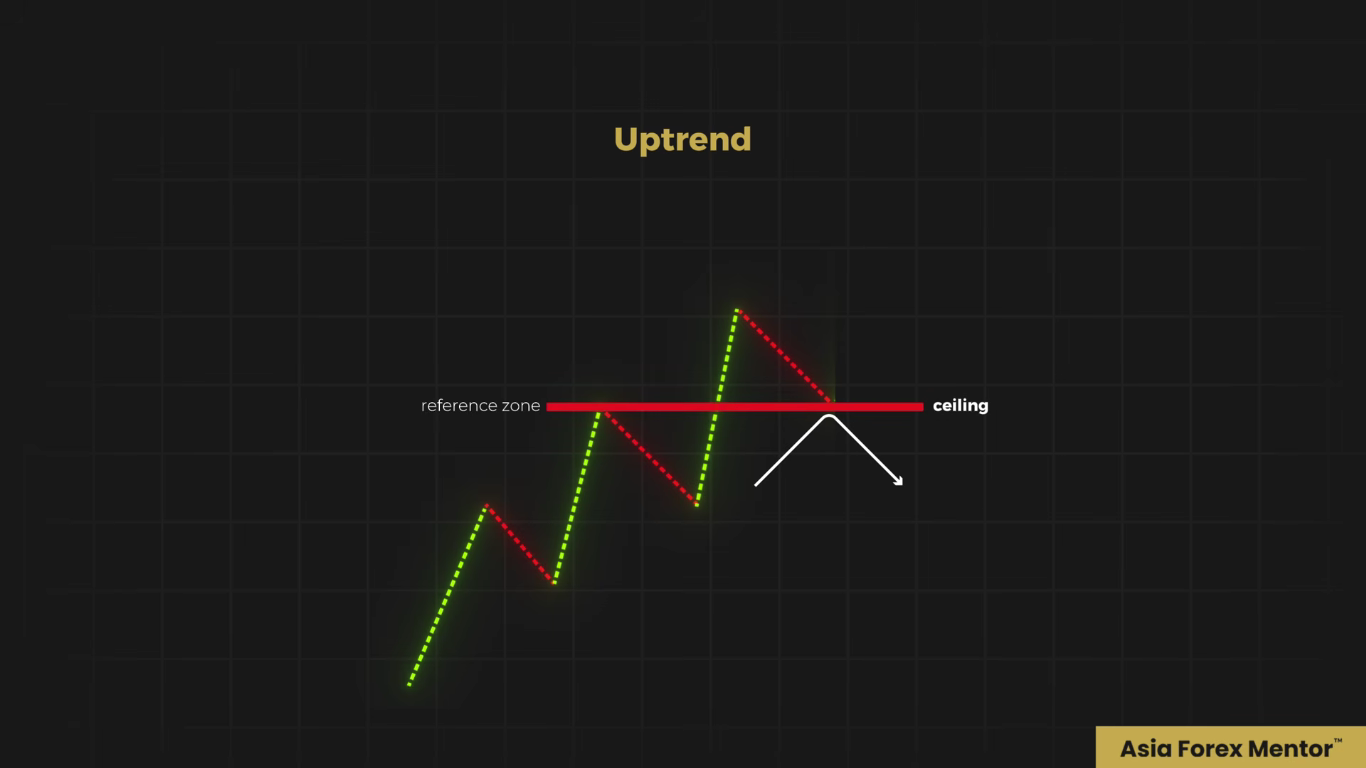
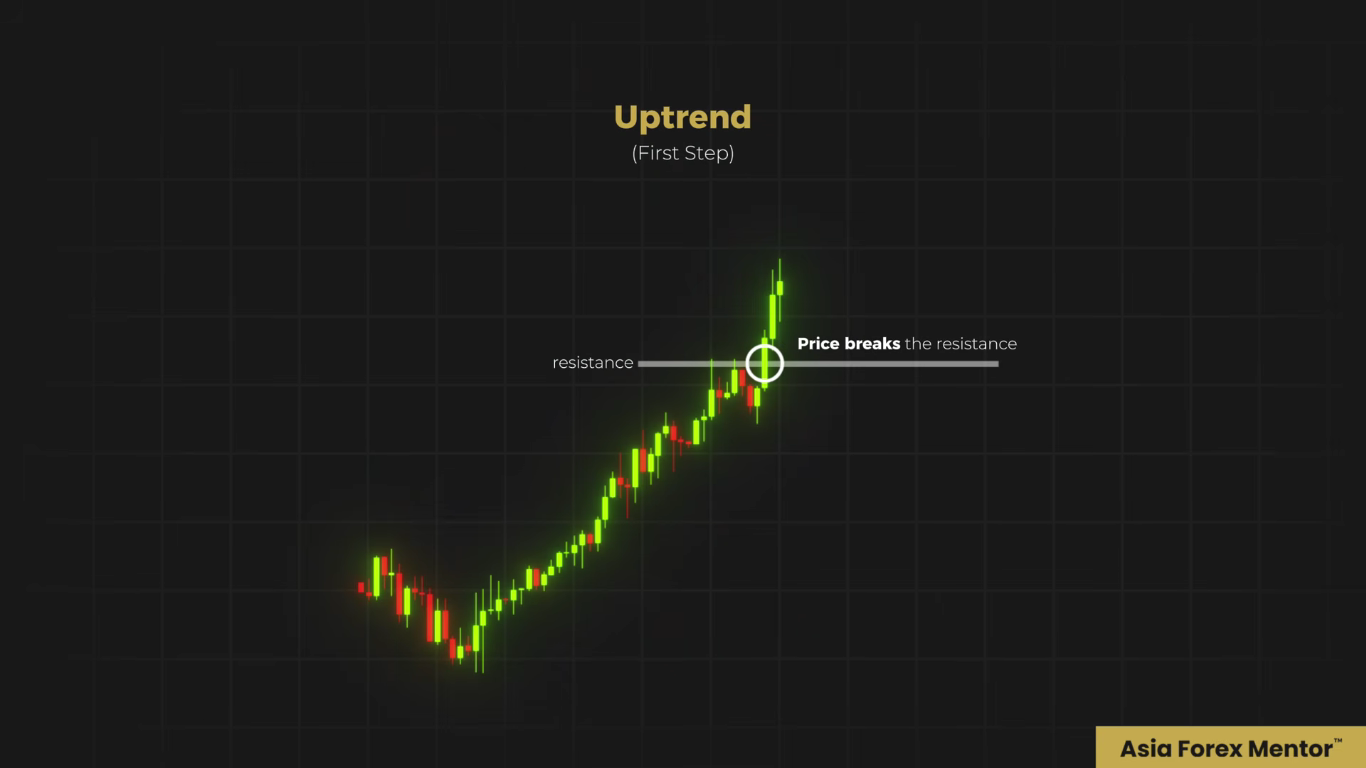
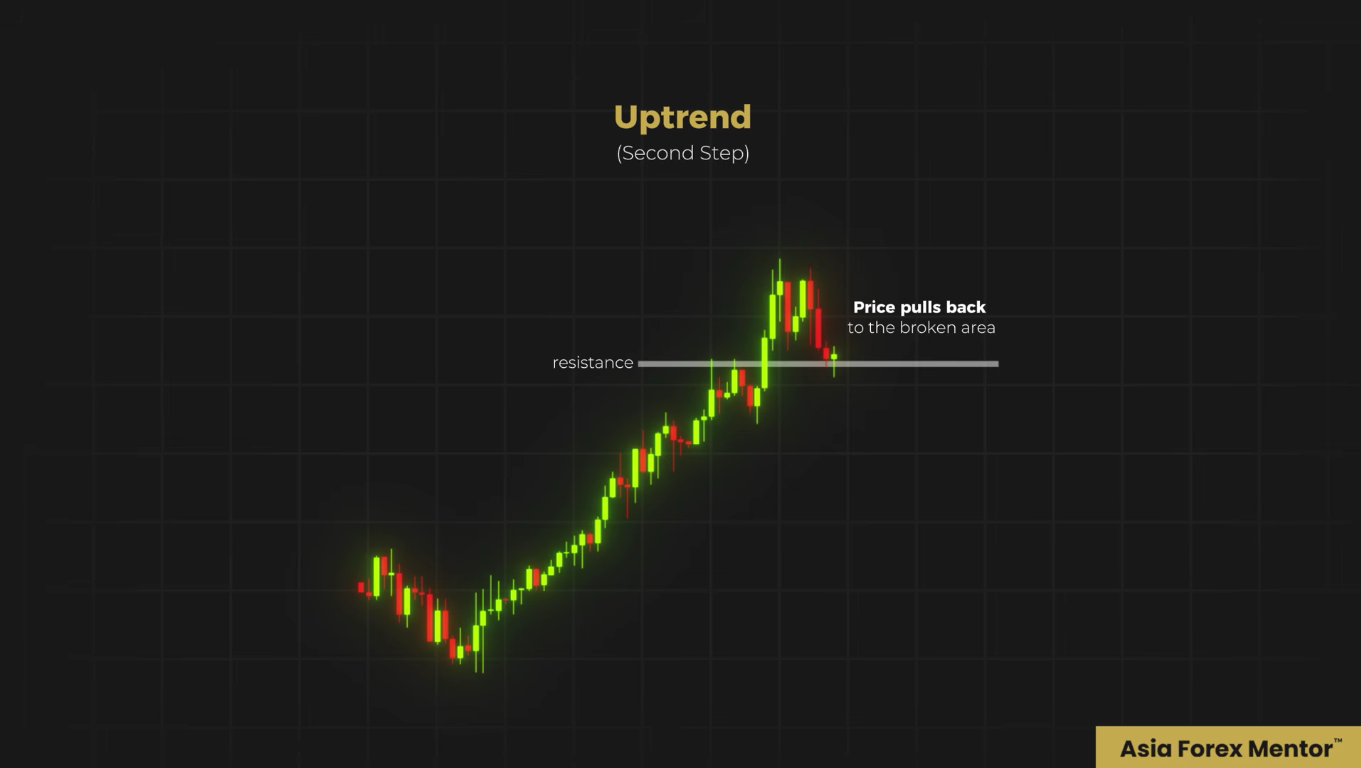
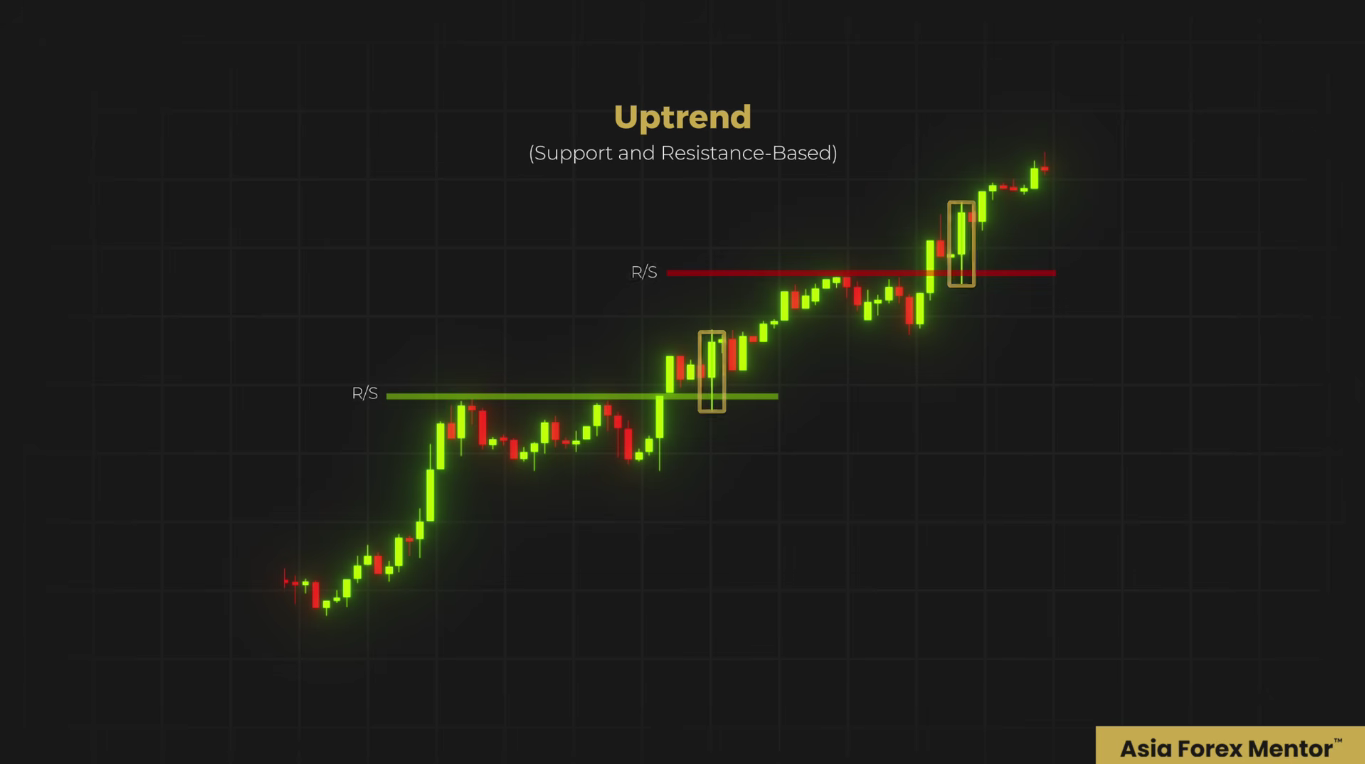
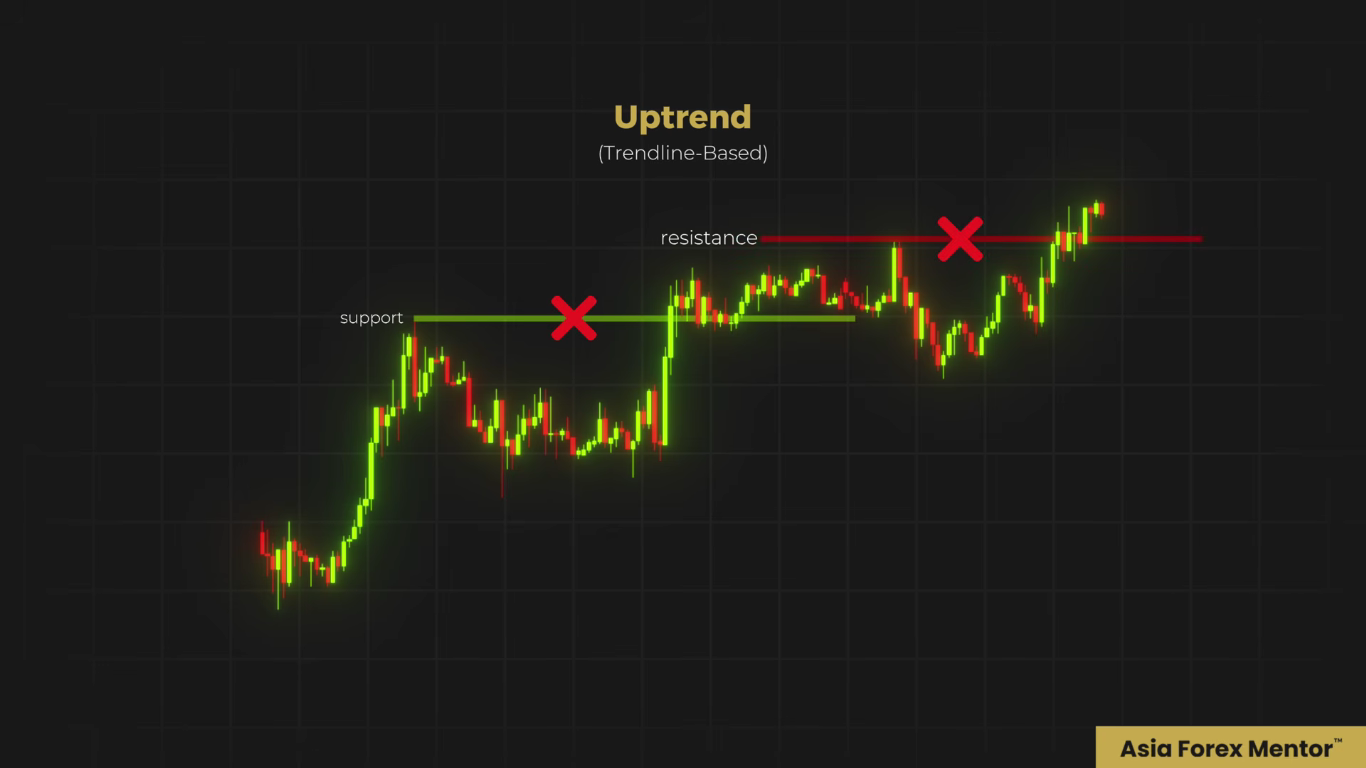
In an uptrend, price now pushes higher and then it breaks through a resistance level. And that break tells you that the buyers still have control.

The real entry is not the breakout candle itself. The real opportunity comes after price pulls back, because that is where you get to test whether that breakout is actually valid or not.
Once the resistance is now broken, that old resistance is no longer just some line on the chart anymore.
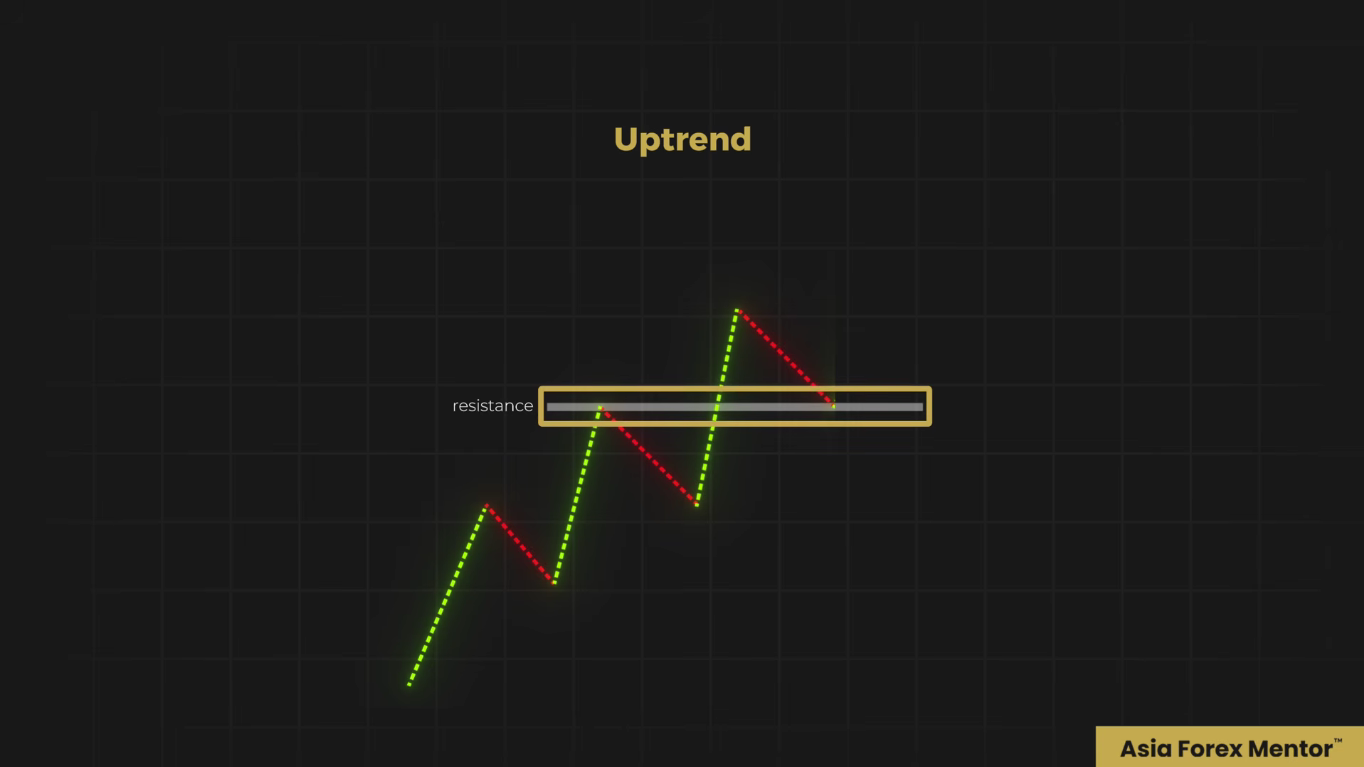
Now it becomes your reference zone. That is the area where we now watch very closely.
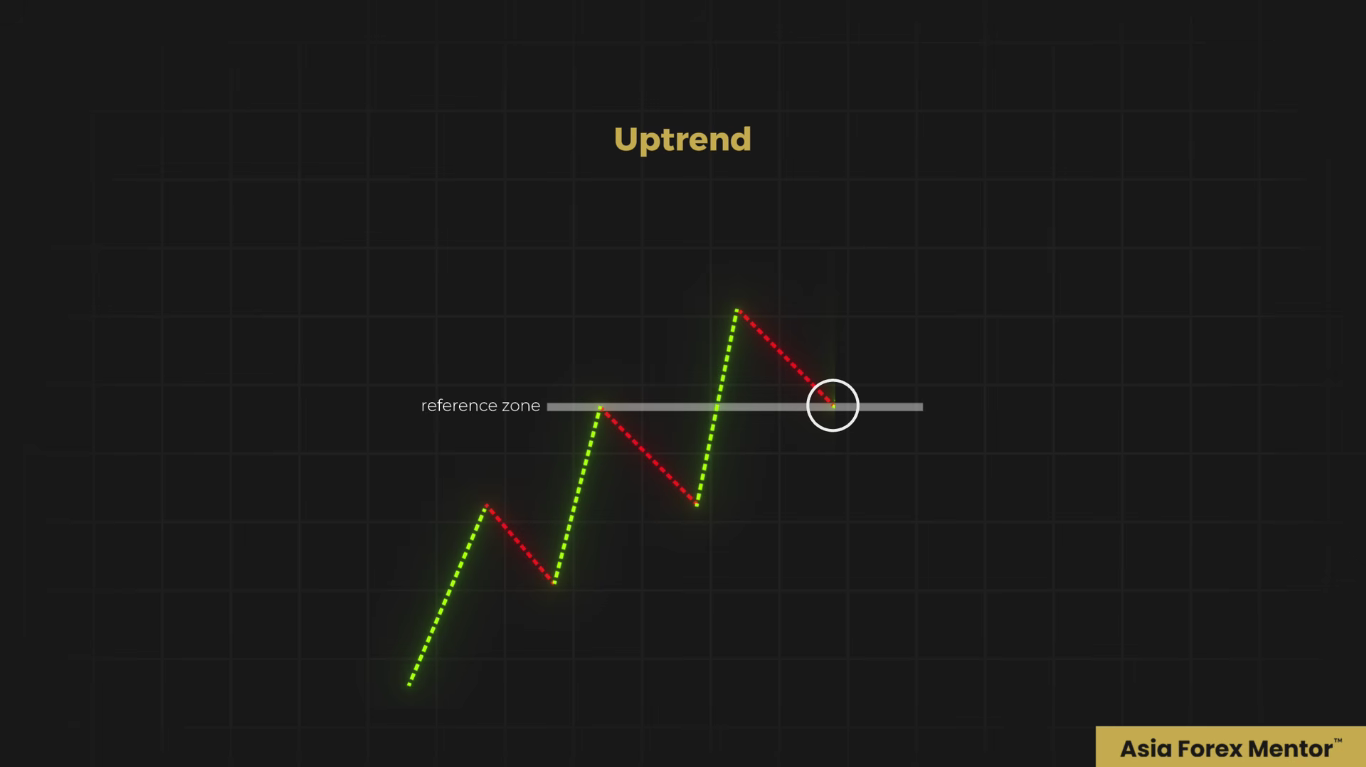
If price pulls back to that level and it holds, then the market is showing you that the old ceiling before has now turned into a floor.
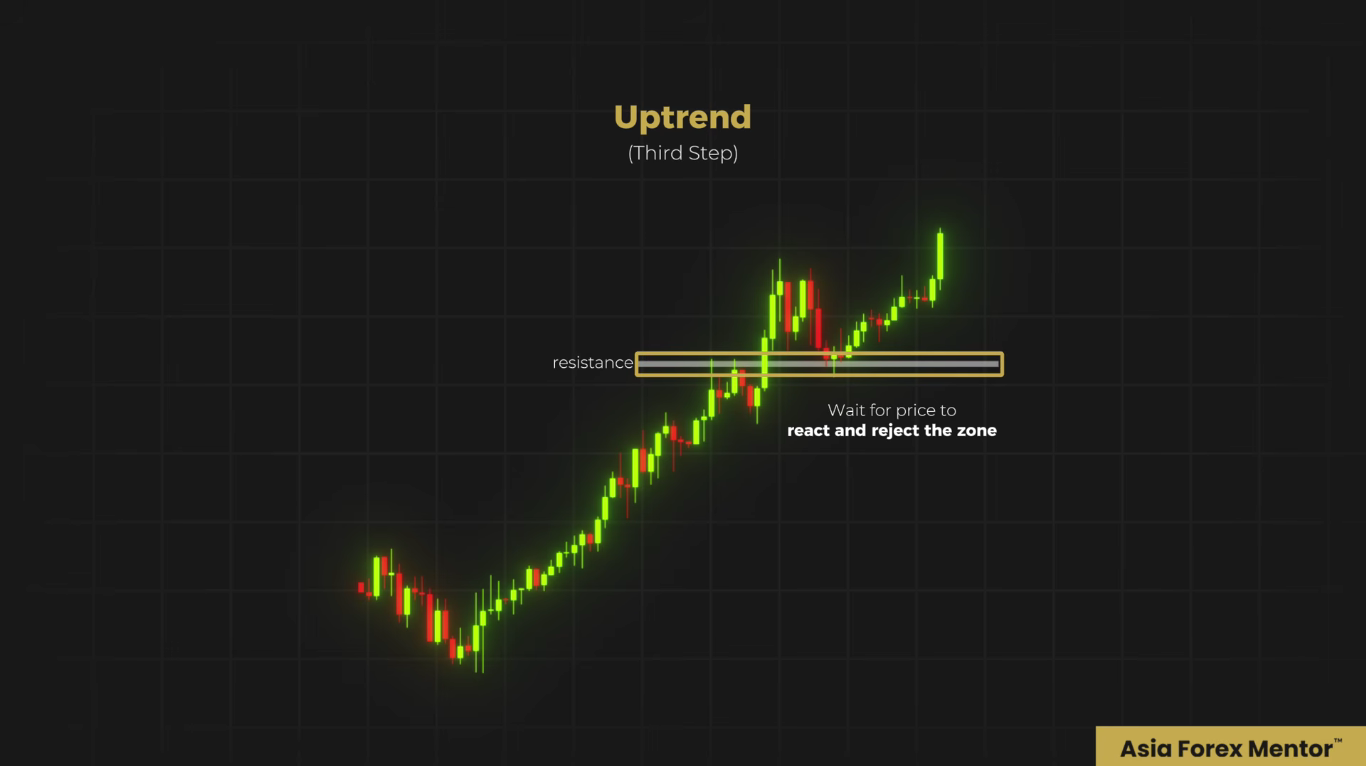
Now that matters, because continuation trades are the strongest when the market proves that the broken level is now being defended.
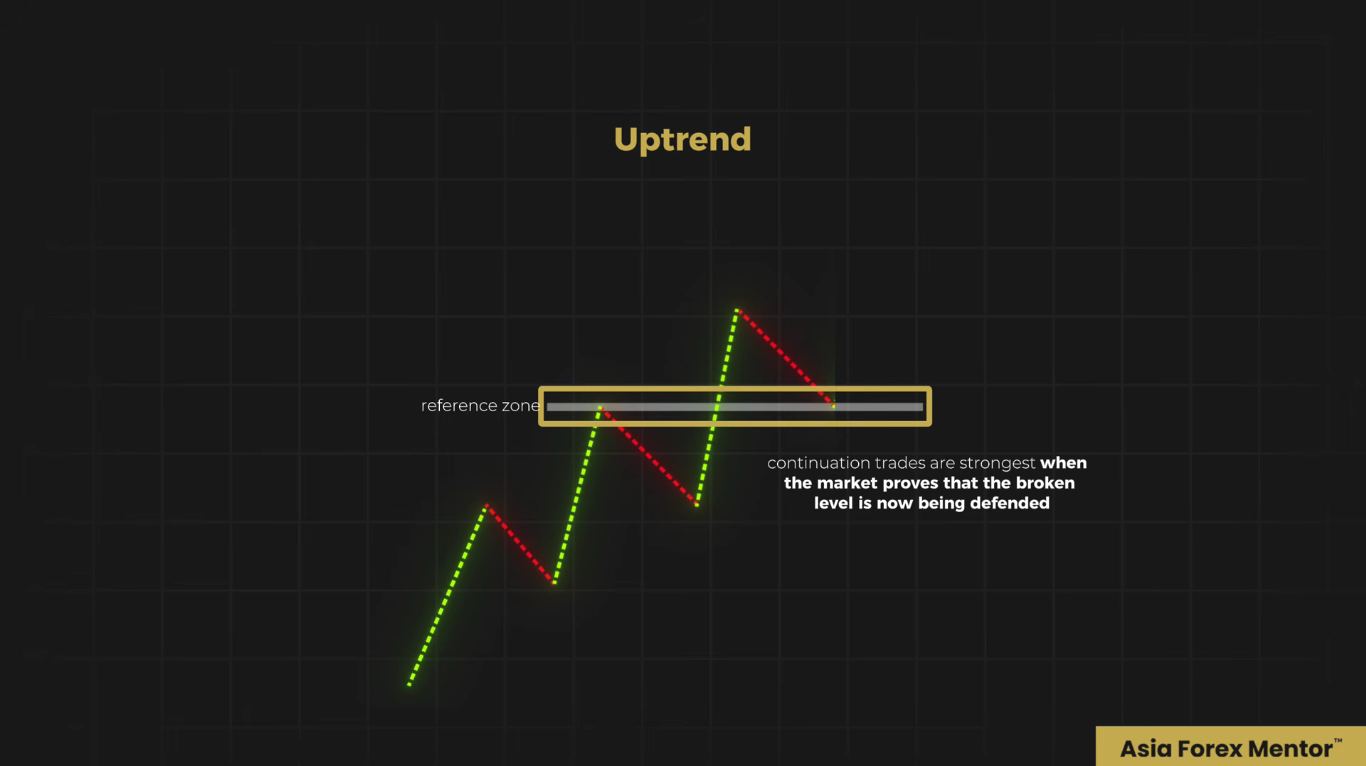
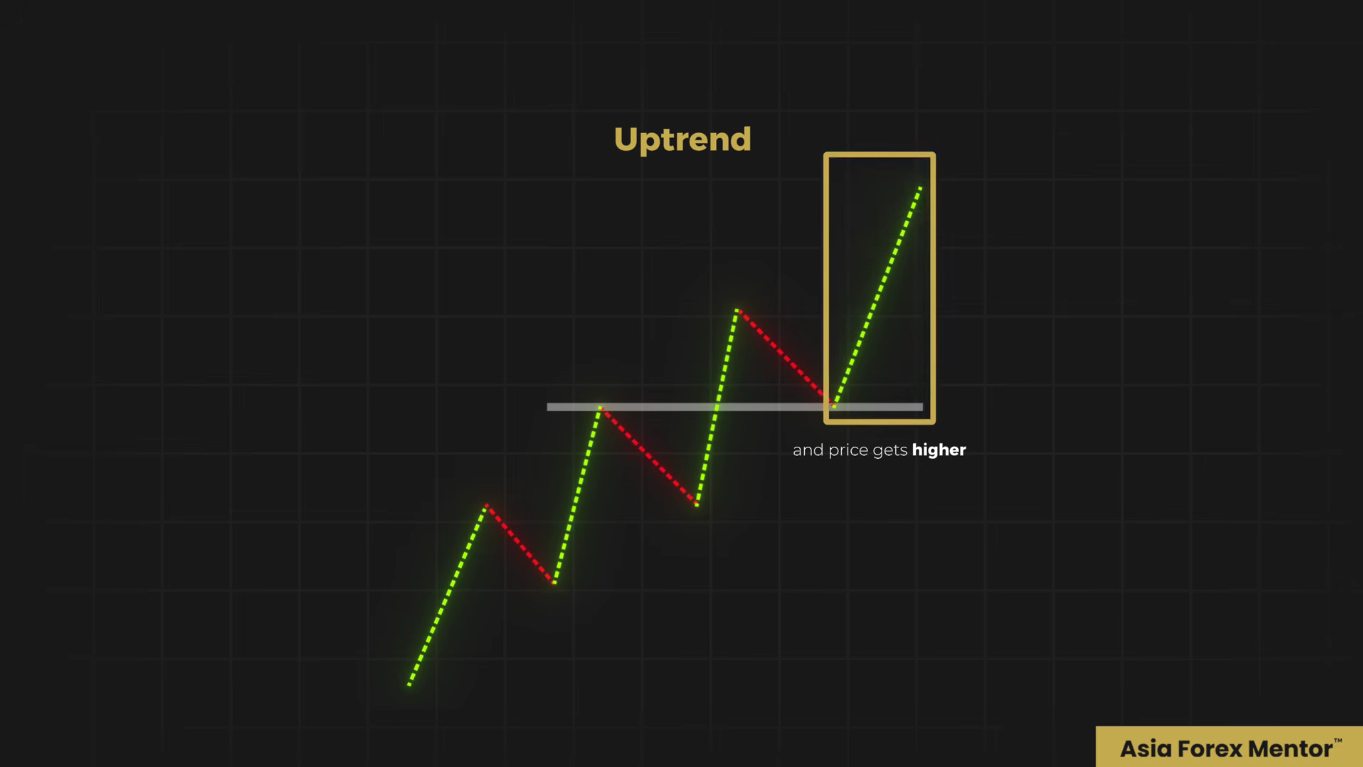
If the level holds and price reacts higher from it, then it's no longer just a pullback. This is the market now resetting for the next impulsive leg itself.
The pullback sequence
The sequence is simple, but you need to read it properly. First, price breaks the resistance with strength.
Second, price pulls back to that area that was broken.
Then the third step, you wait for price to react and then reject that zone. Once that happens, it shows that the buyers are now stepping in to support the area.
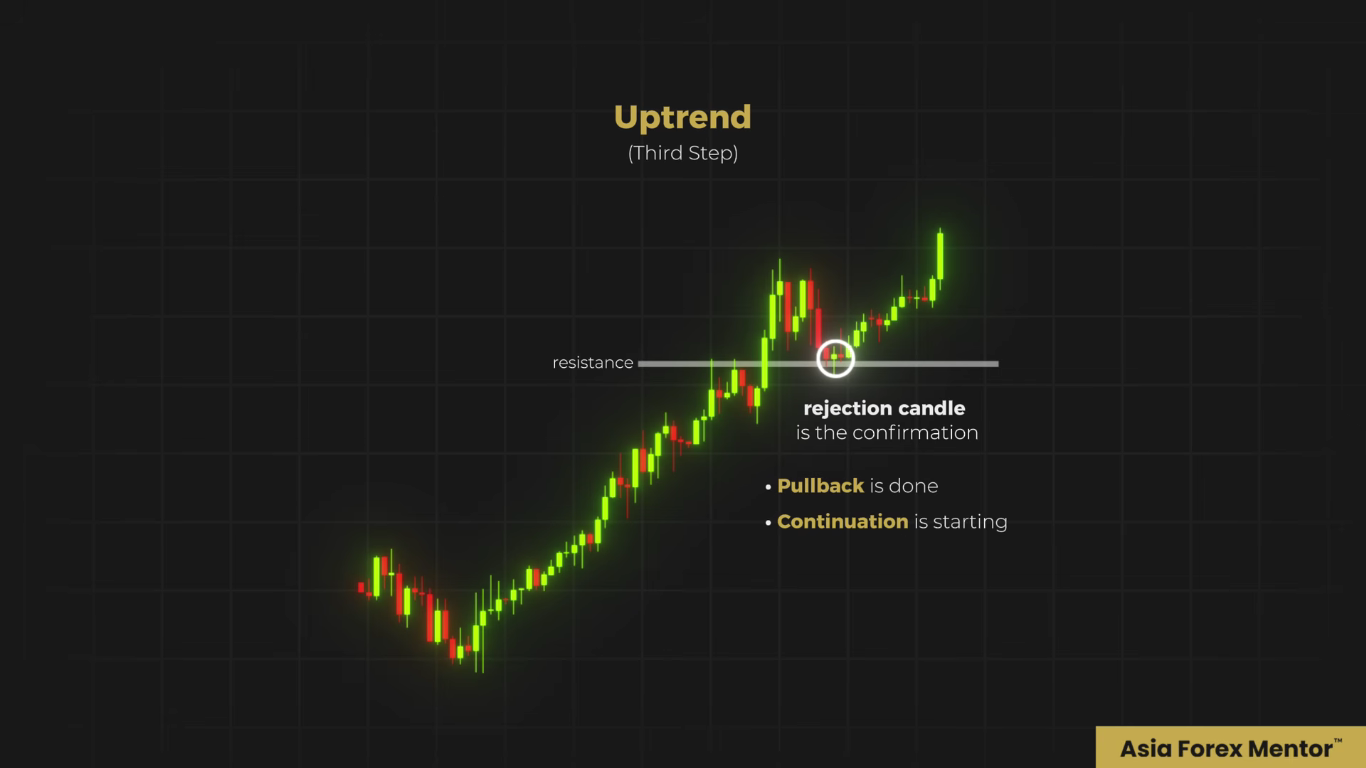
The rejection candle is your confirmation, because this tells you that the pullback is now likely done and the continuation is now starting.
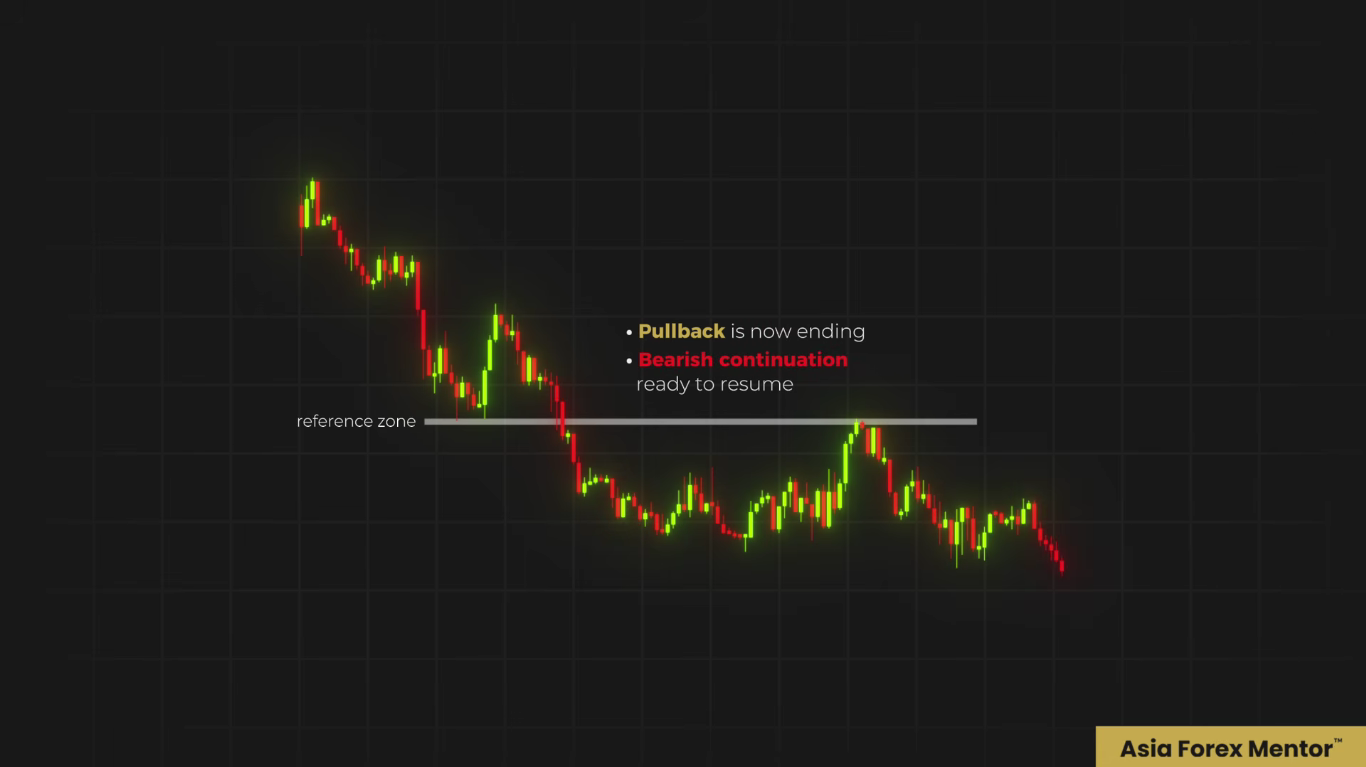
Now if you flip the whole thing over, the exact framework works in the downtrend itself. When price pulls into that level,
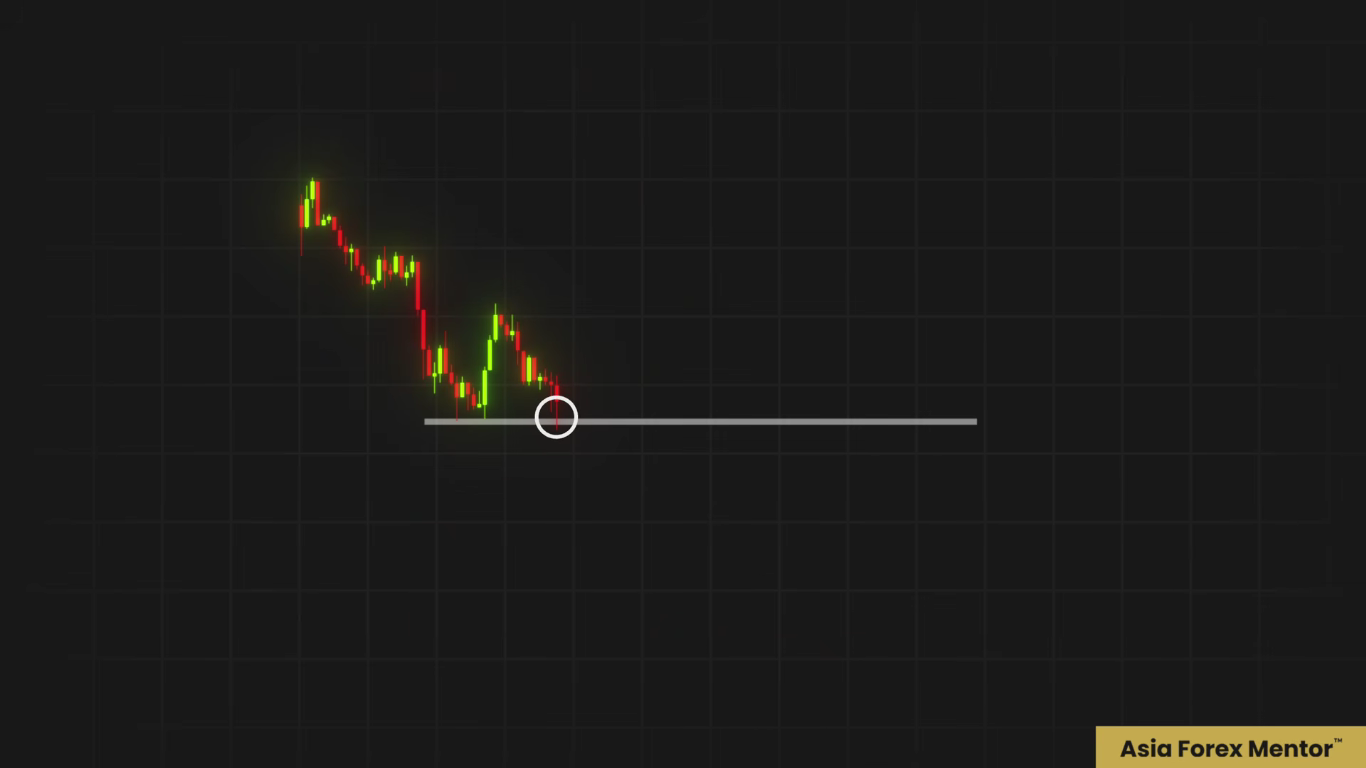
this is where a lot of traders, they make the mistake thinking that the market is now reversing. No, it's not. What you want to see is whether or not that broken support, when it's coming down, now rejects price from above. If it does,
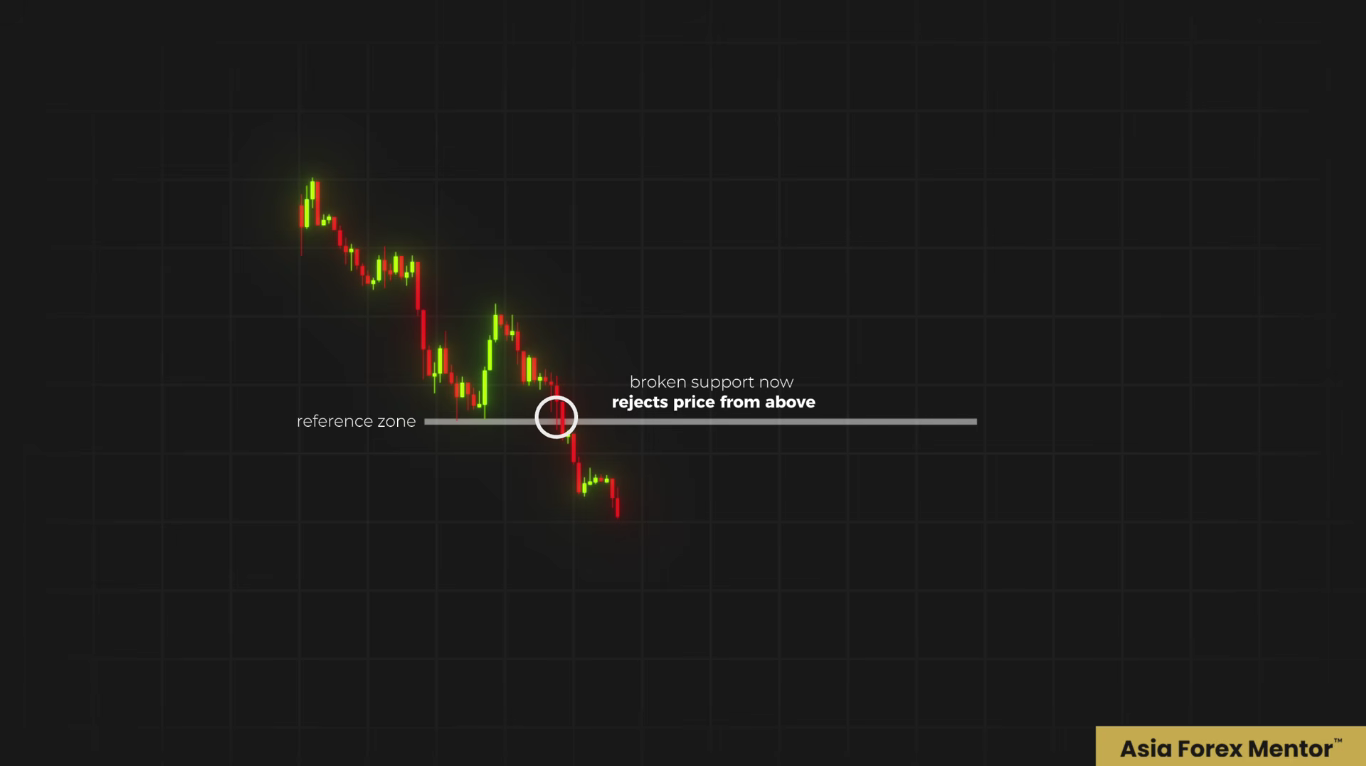
it's the market showing you that the pullback is not ending and the bearish continuation is not ready to resume itself.
Not every trend, it comes back neatly into horizontal levels like this. You need another way to track continuation, without forcing the same setup every single time. If you keep forcing horizontal levels, you're going to miss all the cleanest trends, all the cleanest pullbacks in the chart itself. So this is where the second strategy comes in.
Strategy 2: Reading the Dynamic Structure
A lot of traders, they learn the support and resistance flip. You already know that. They understand the retest, which is what we talked about. And then they try to force that same model into every trend. And then they get stuck. Because the market does not always pull back neatly into a horizontal level.
In a support and resistance based trend, price breaks a level, comes back, retests, continues. This is a horizontal read. Like I said, sometimes price does not return cleanly to this old level.
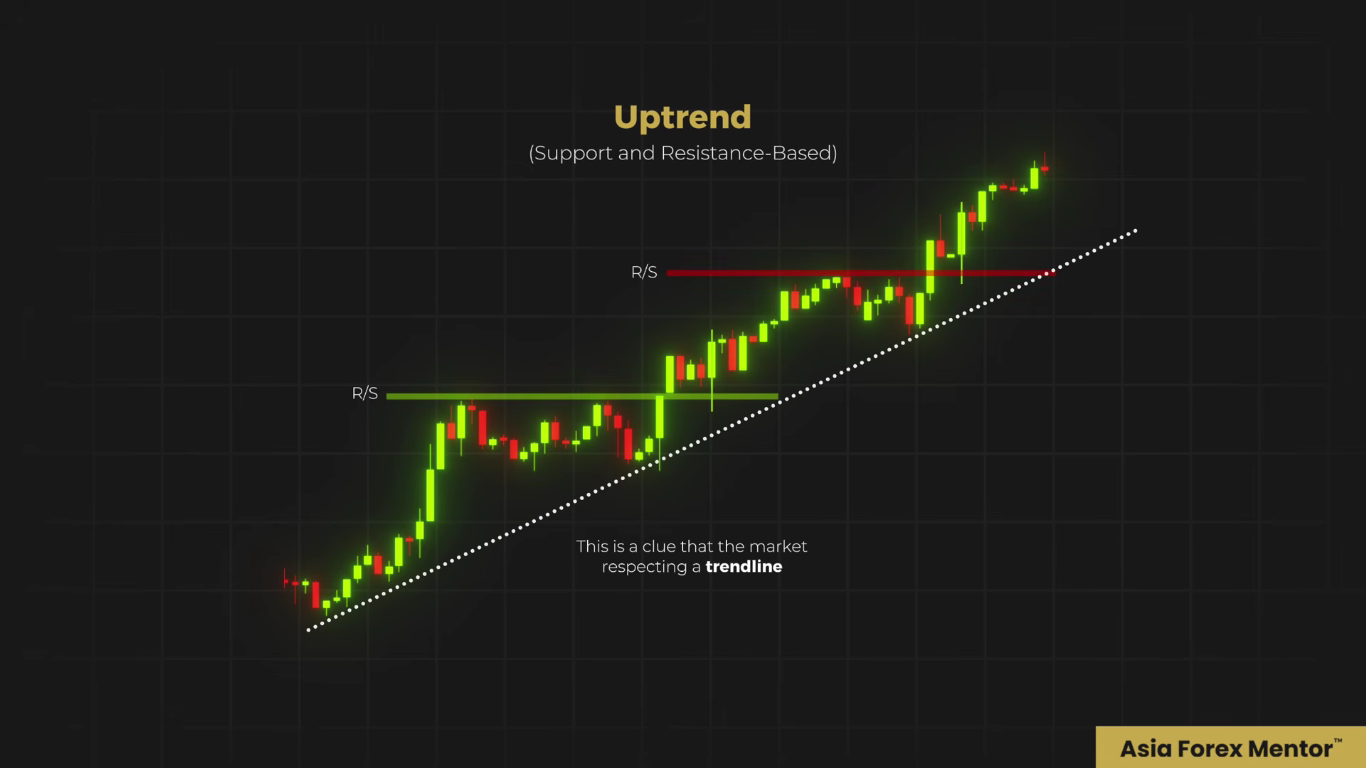
Price keeps making higher highs, higher lows, and yet at the same time, the pullbacks, they are not as deep, they are shallower, they are cleaner along a slope itself. So this is your clue that the market may be respecting a trend line.
Using the trend line
Once you understand that, you stop forcing the zones that you're no longer using. You start following the structure that is actually guiding the move itself. In a trend line based uptrend, the job is not to keep drawing horizontal lines, hoping that one of them is going to work.
The job is to connect the higher lows and see whether price is respecting this diagonal path itself.
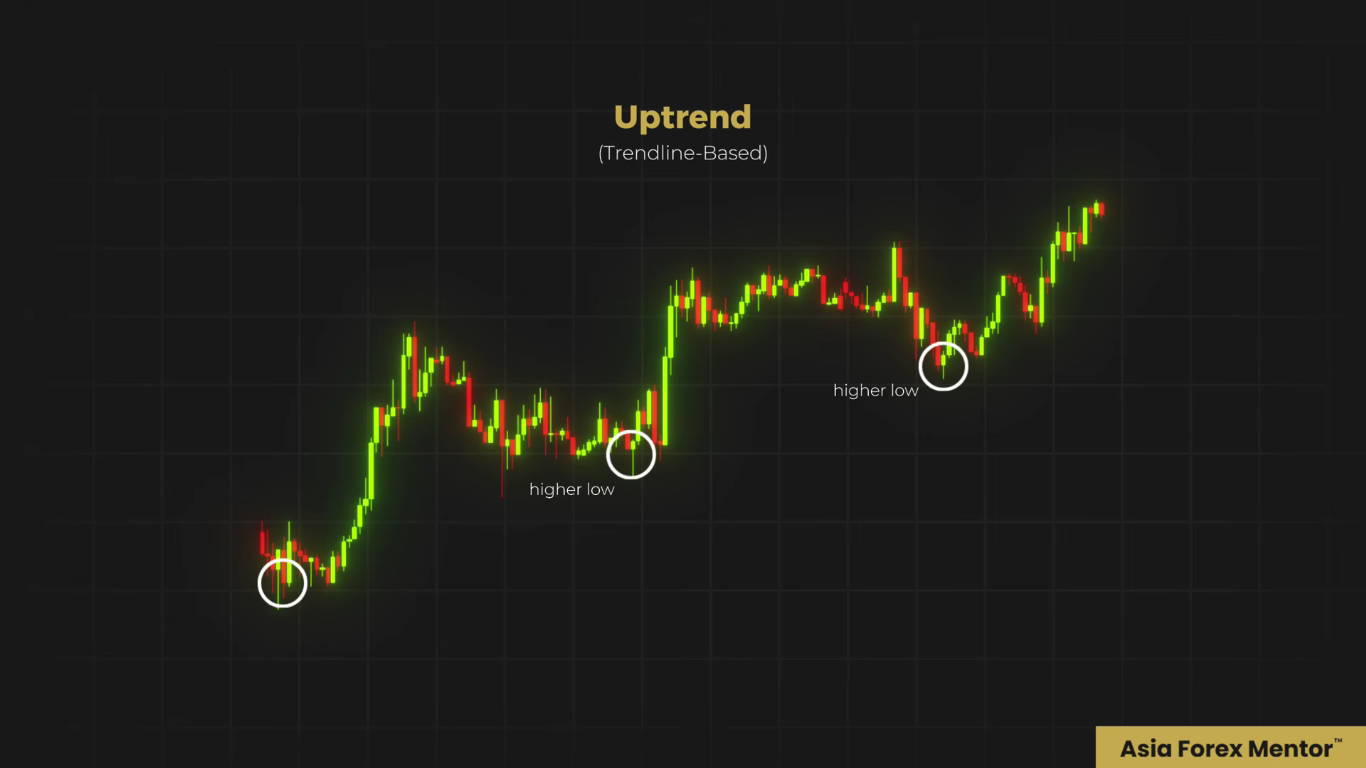
If the trend line is valid, each pullback into it becomes a continuation zone itself.

Price touches the line, rejects it and then starts to push higher. That repeated touch-and-reject behaviour is what gives the trend line value.
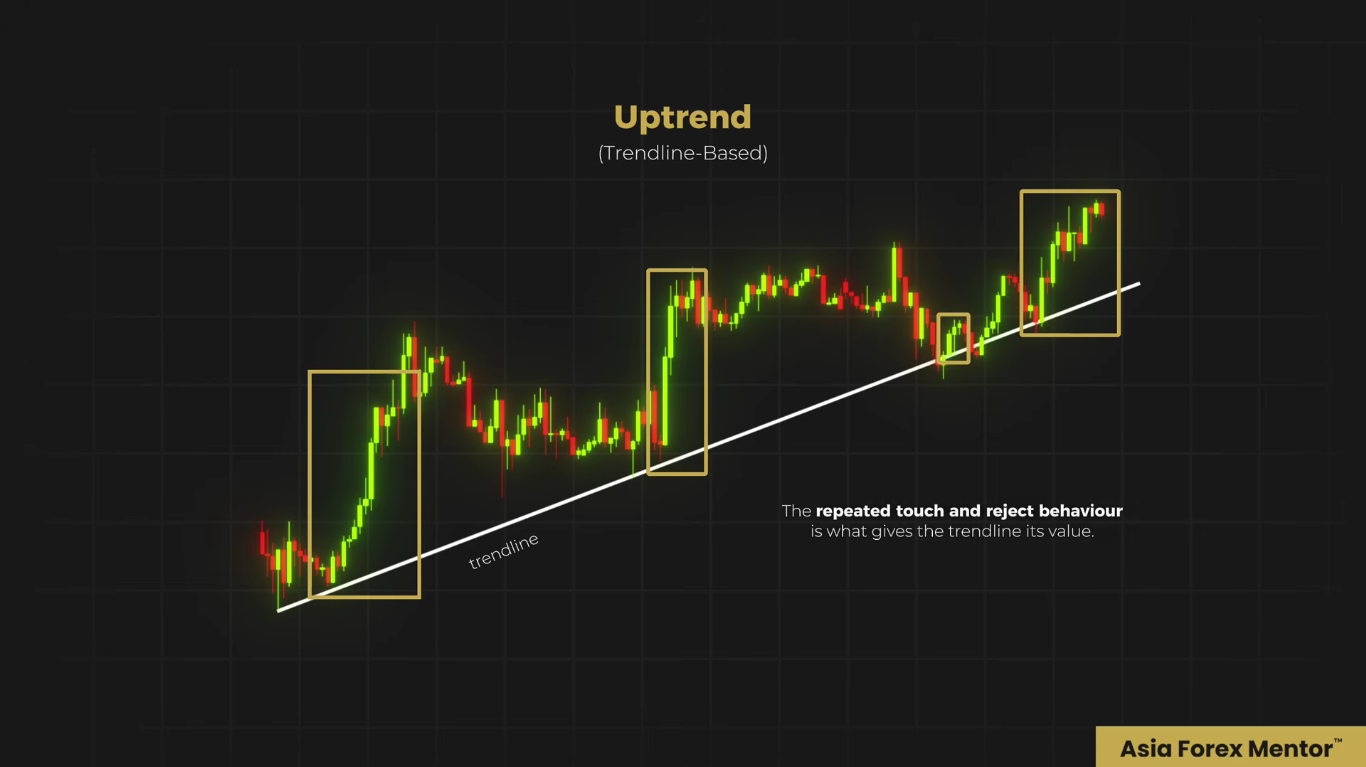
Not because a line on the chart is some magical line, but because price keeps using that path itself as support while the trend is still healthy.
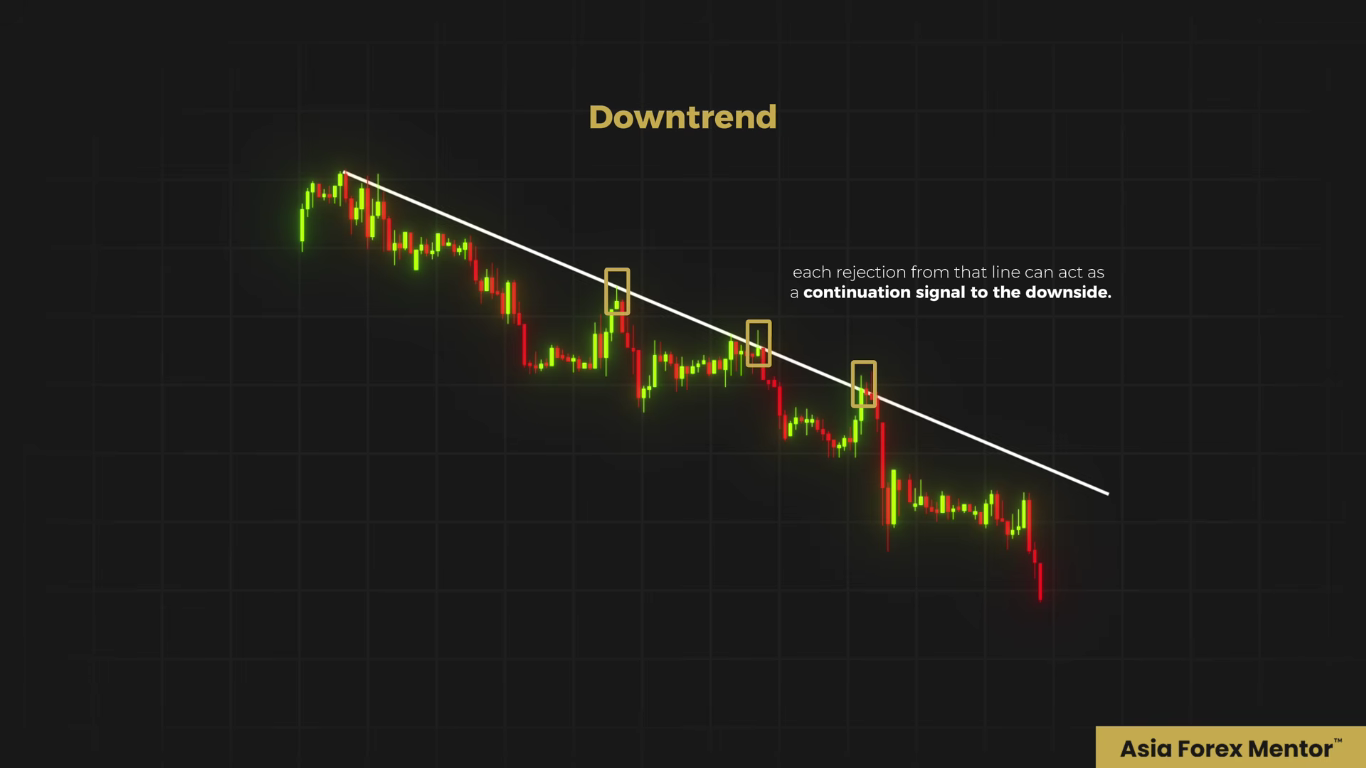
Now in the downtrend, same idea. You connect the lower highs. Each rejection from that line acts as a continuation signal to the downside.
The 8 and 21 SMA
From there, we will take one step further. Horizontal lines are fixed, trend lines are diagonal. But there's another type of structure that actually updates candle by candle with the market itself. And this is where the moving average will come in.
And this is useful when the trend is moving smoothly. You want a cleaner way to track the pullback zone without constantly redrawing all the trend lines or the horizontal lines.
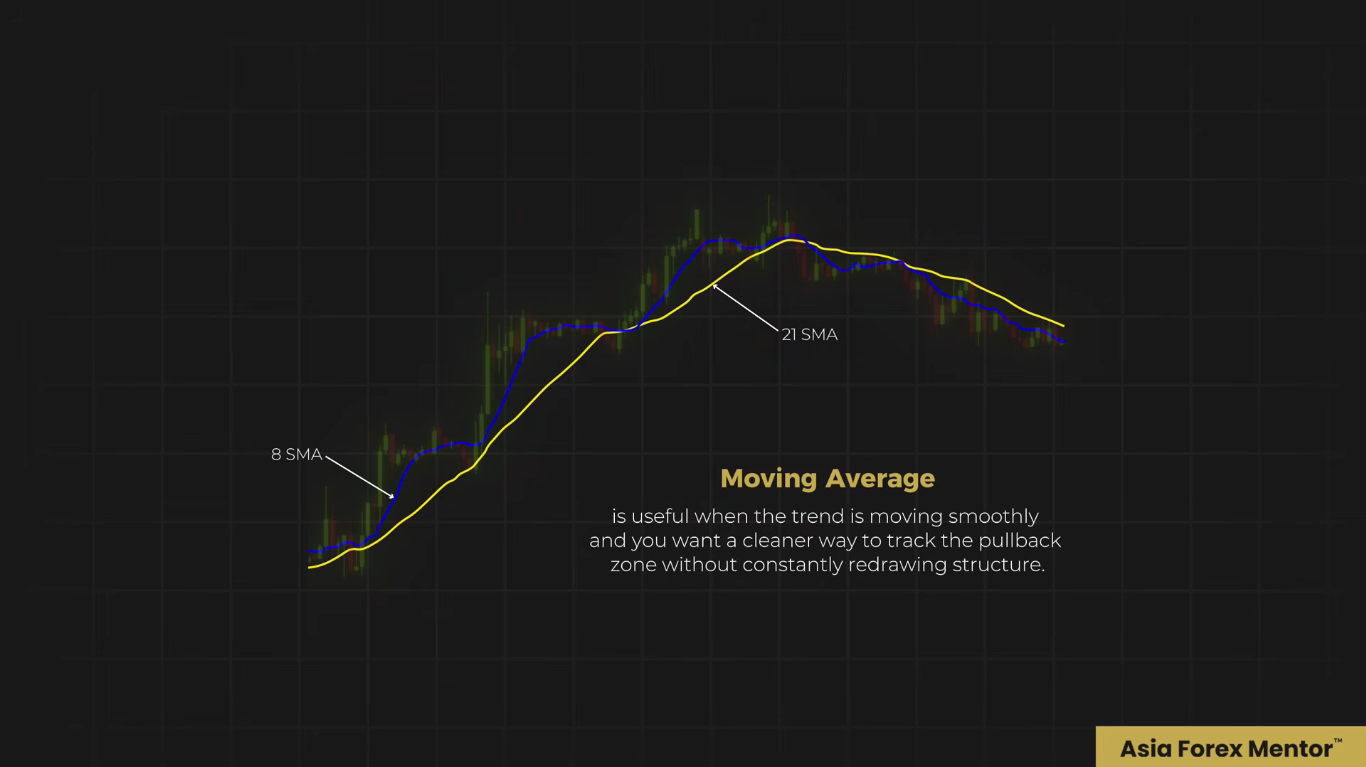
Instead of asking whether price is coming back to a fixed level, you are asking whether price is pulling back into a moving area of value that is still aligned with the trend itself.
Now in this framework, the two tools that matter are the 8 SMA and the 21 SMA.
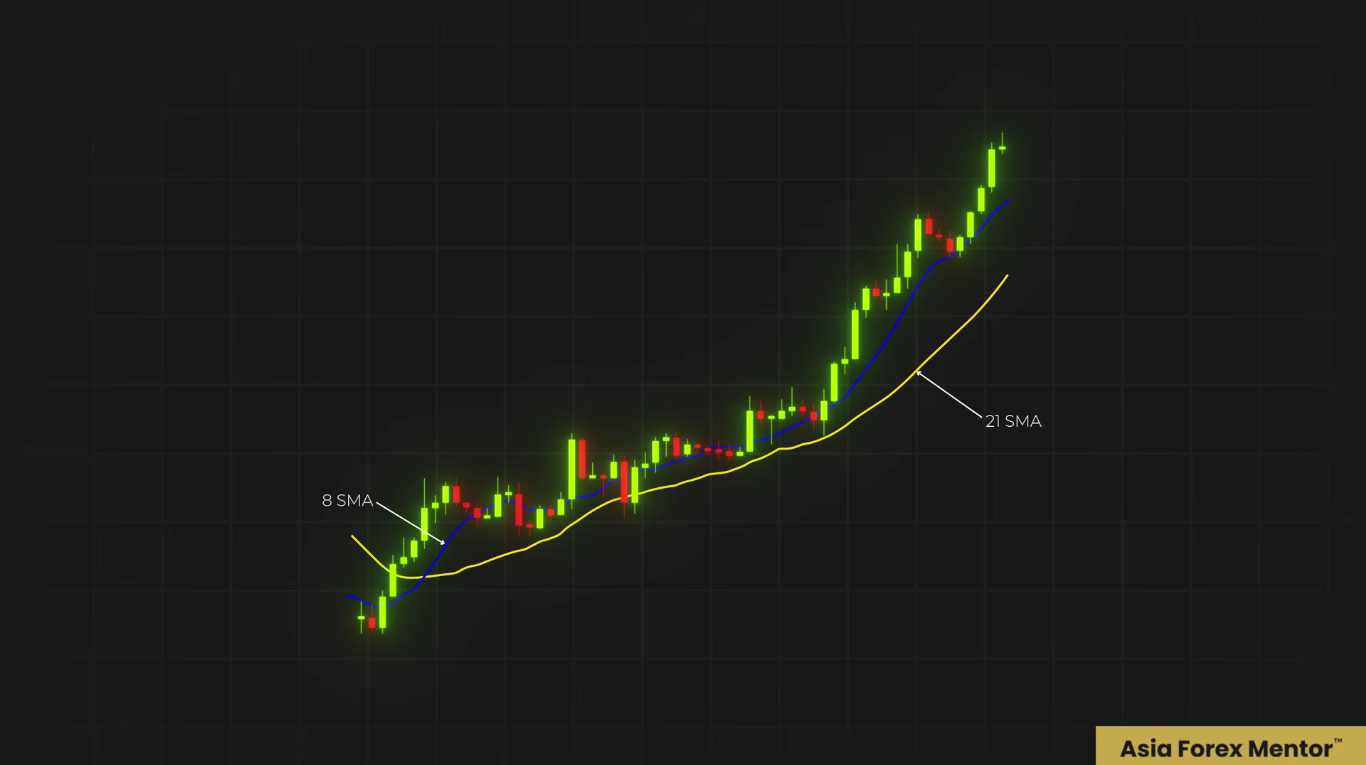
The 8 SMA, it stays closer to the price. It tracks the short-term move in the market itself.
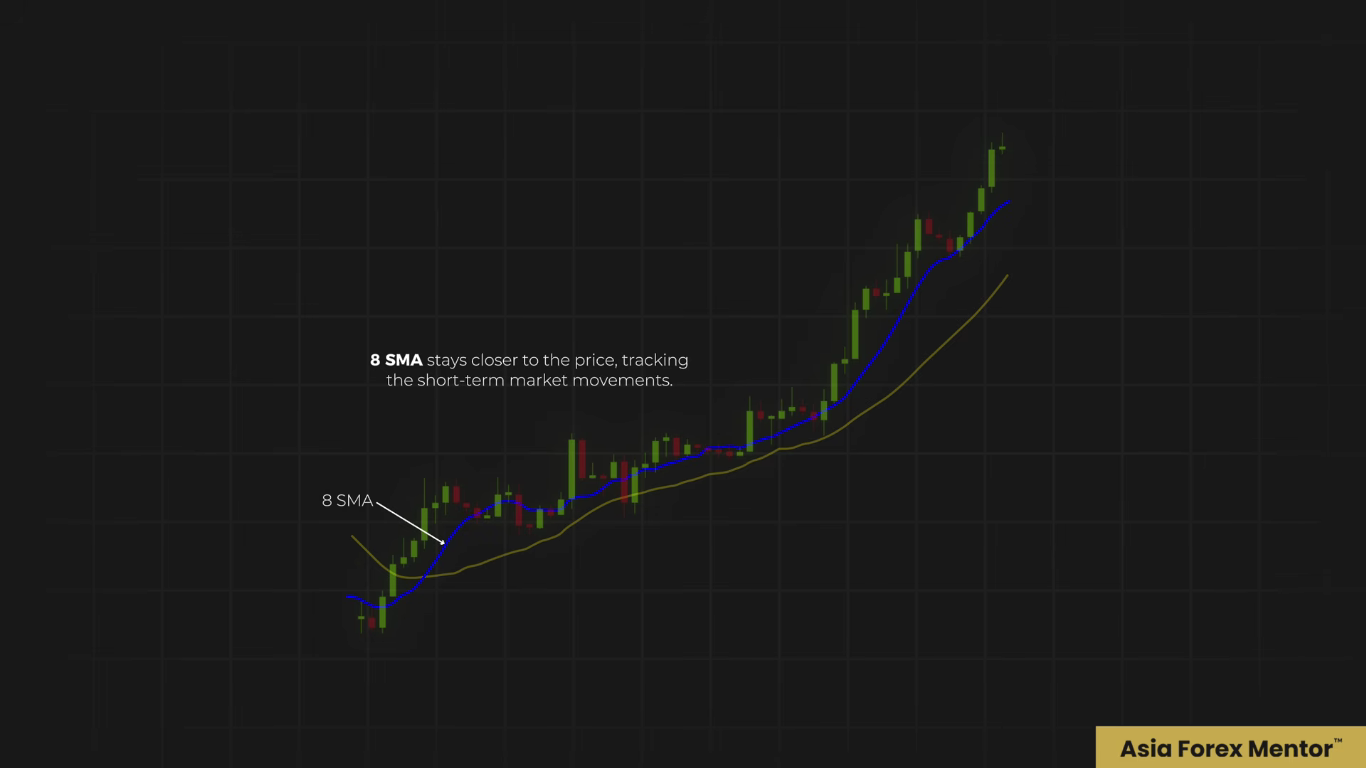
The 21, it sits a bit deeper. It gives you a broader dynamic support or resistance area.
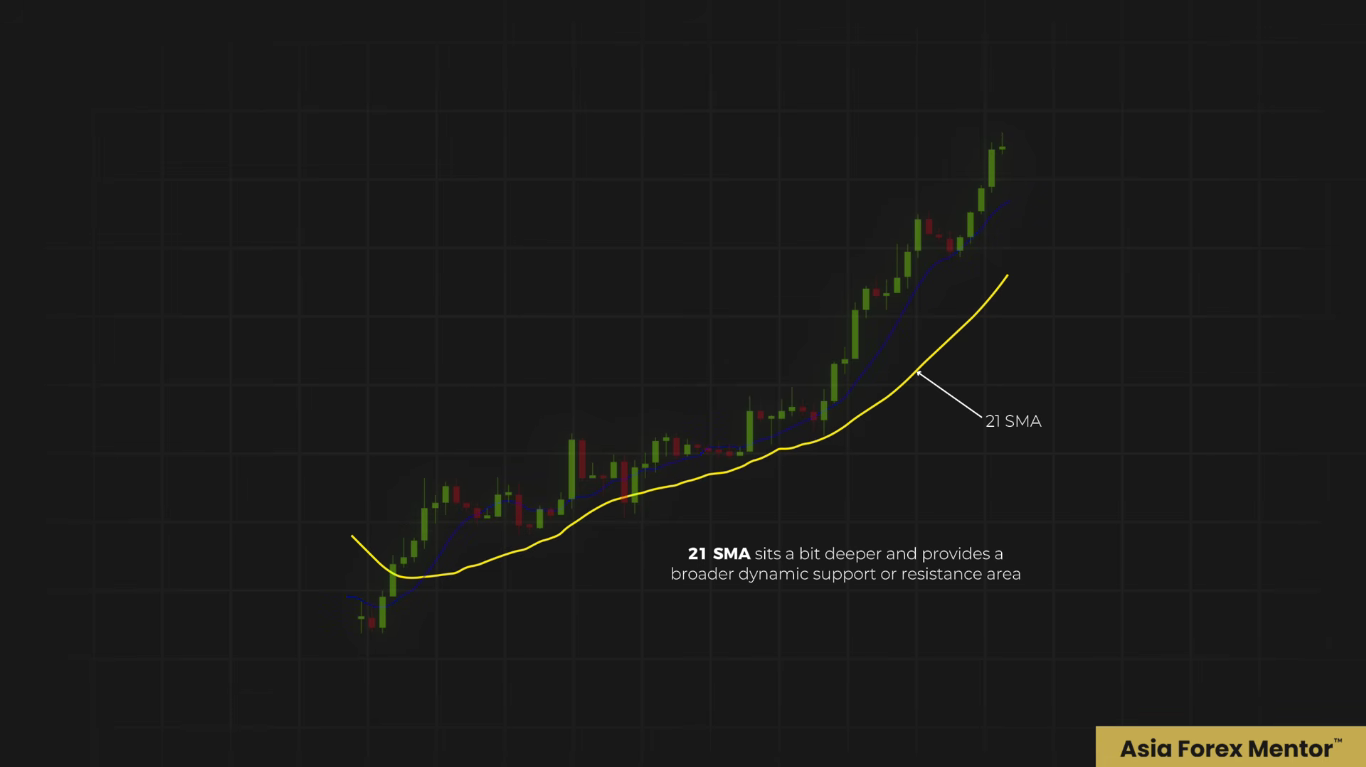
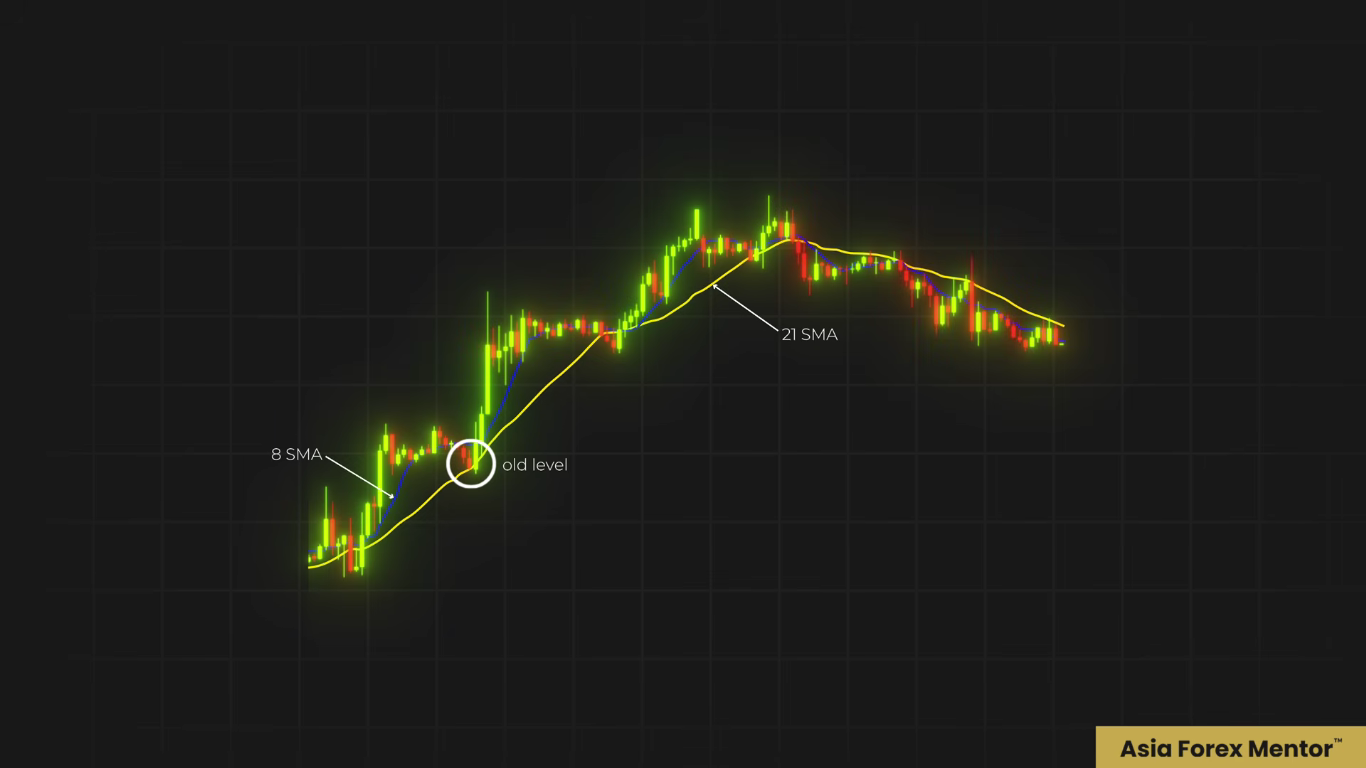
Together, they create a zone instead of a single line. A lot of times, price pulls back into an area, it reacts there, and then it starts the next impulsive move itself.
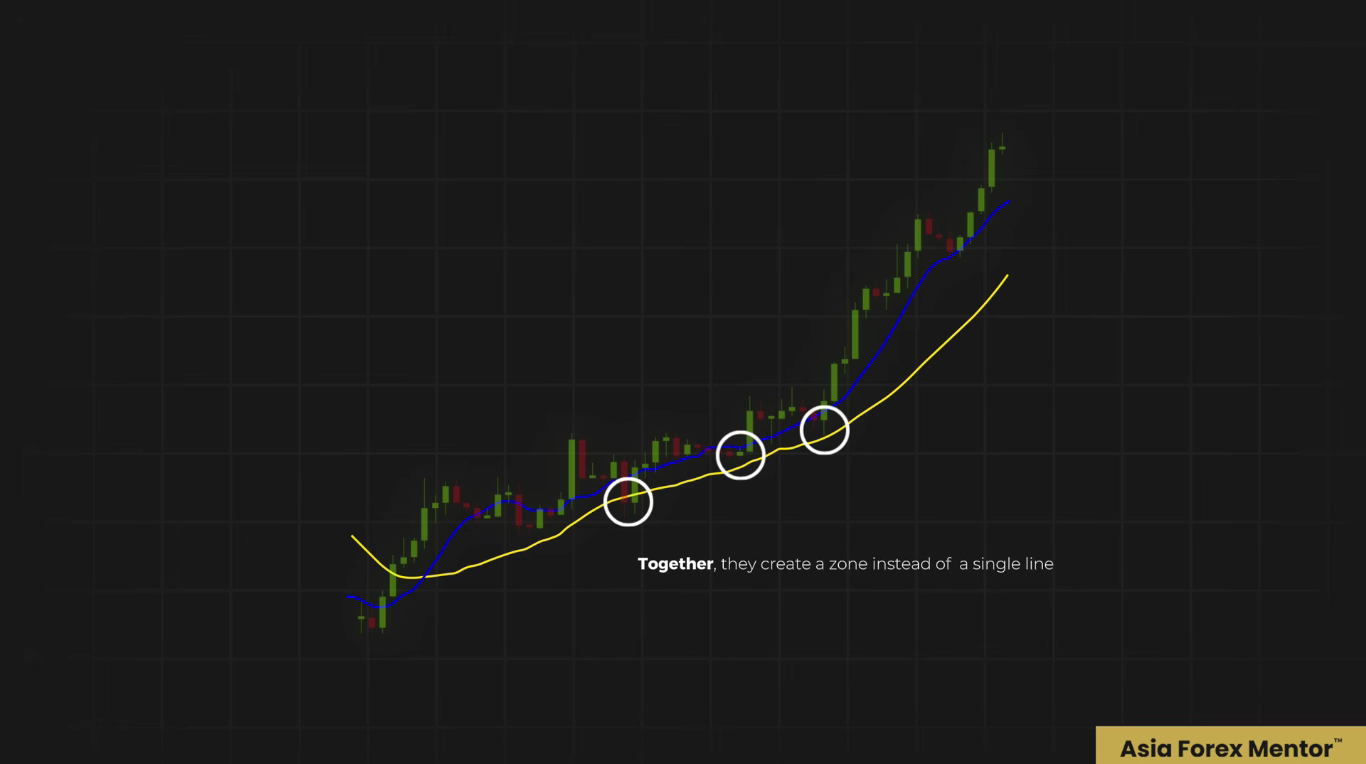
The moving averages, they help you to read that area in a cleaner way. In an uptrend, if the structure is strong, price will often pull back into the space between the 8 and the 21.
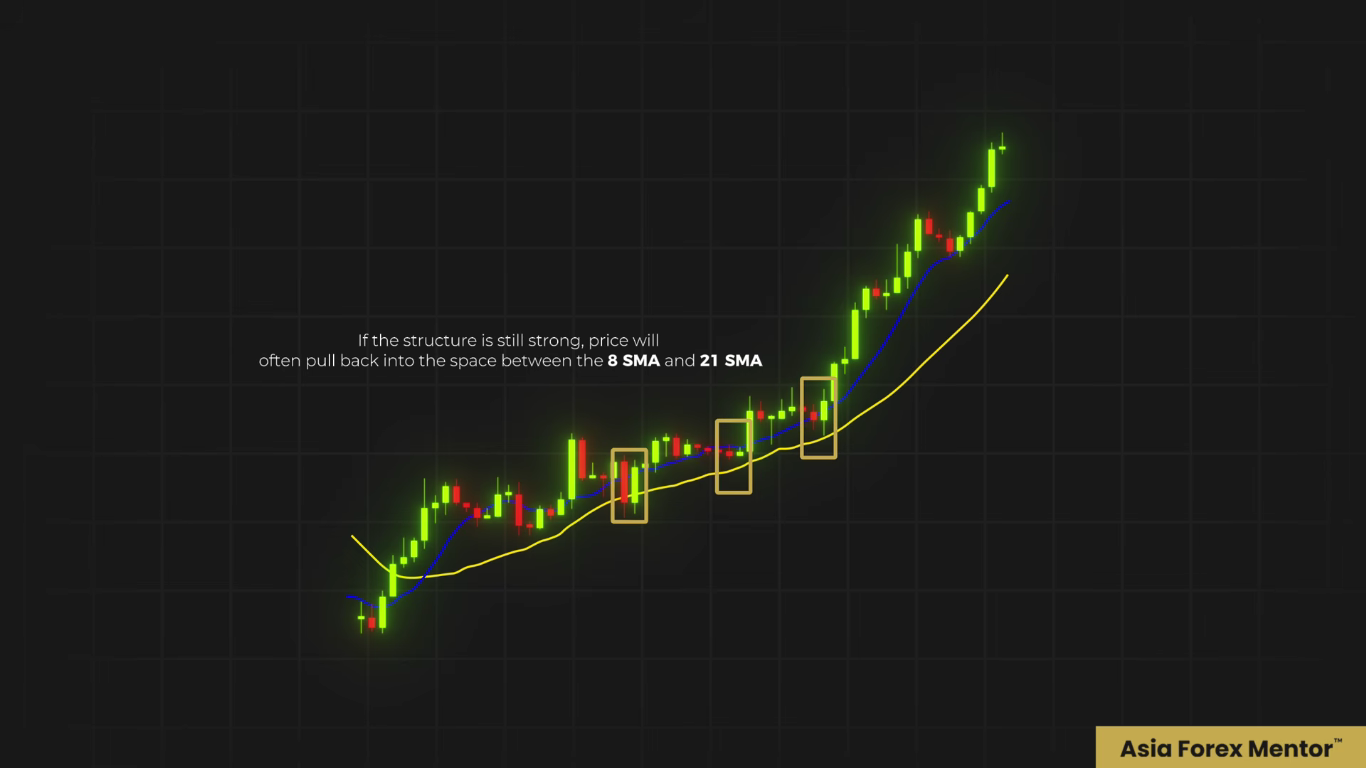
And especially towards the 21, when the retracement goes a little deeper, that area becomes your dynamic moving support zone itself. So what are you watching for? You want to see that the market is still making higher highs and higher lows first.
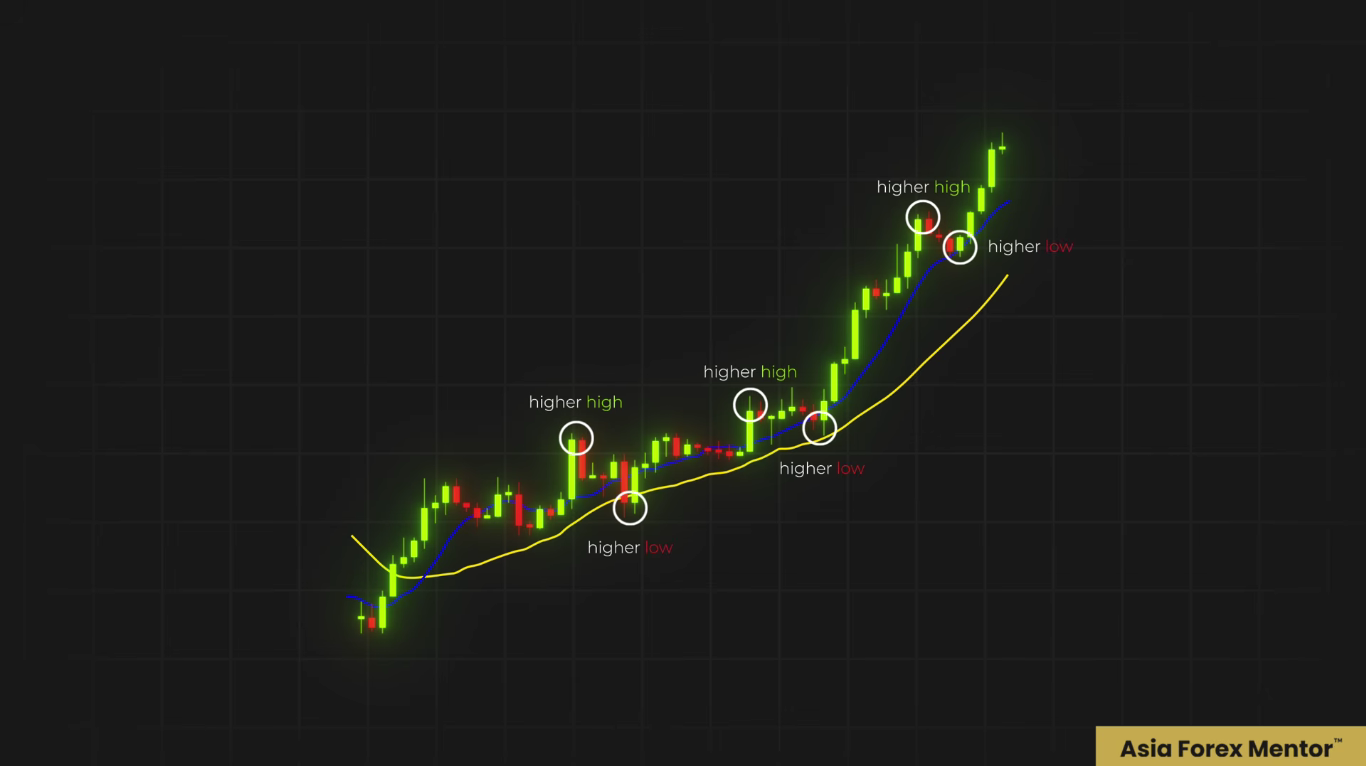
Then as price pulls into that zone, you wait for rejection. You don't just want to enter it blindly. You don't want to guess, but you want to have a rejection at the area.
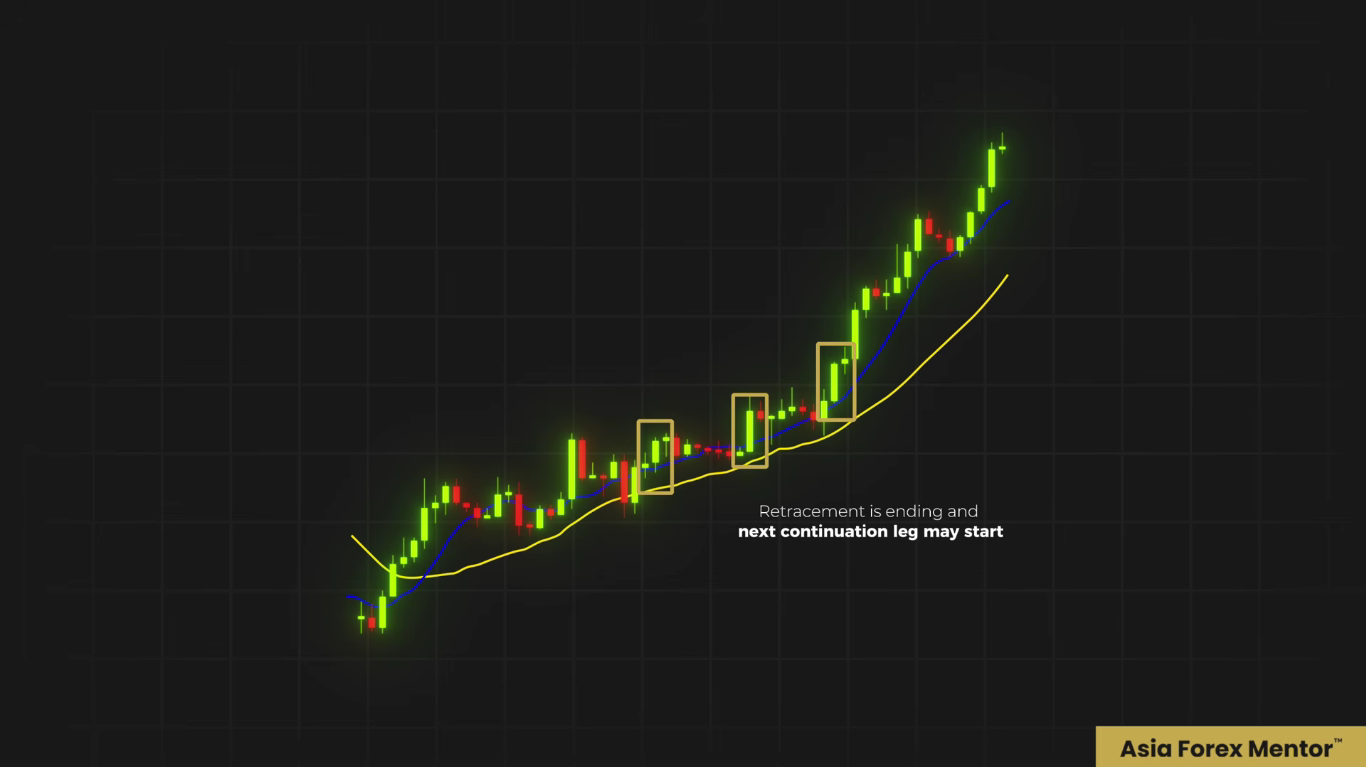
If price comes into the area and starts pushing back up, that tells you that the retracement is likely ending and the next continuation leg is maybe starting itself.
Strategy 3: The Wyckoff Cycle
The biggest mistake is not your entry, it's trading the wrong phase of the market. So in our third strategy, we're going to step back and we're going to read the full market cycle.
This is where the market structure becomes bigger than just one entry or one pullback. Because Wyckoff is not really teaching you how to read one candle. It is teaching you how to read the phase that the market is currently in right now.
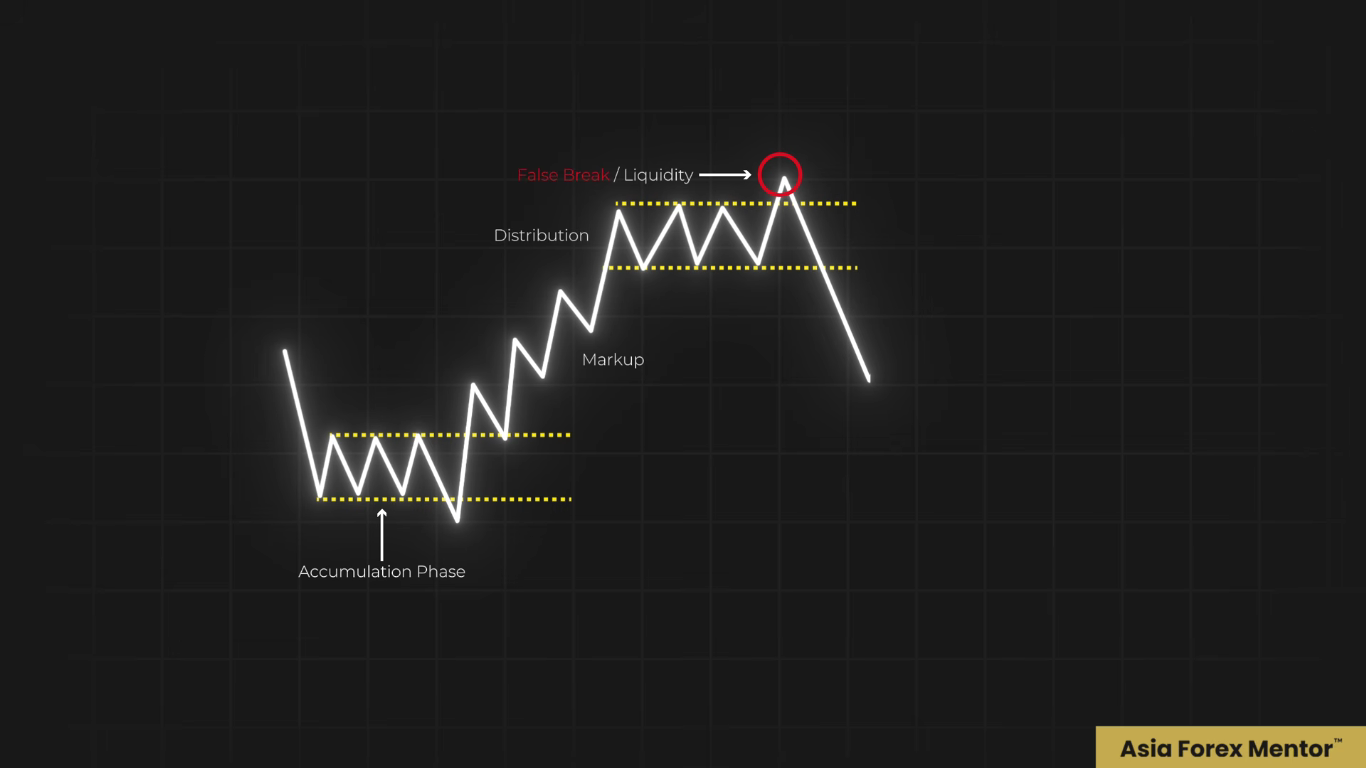
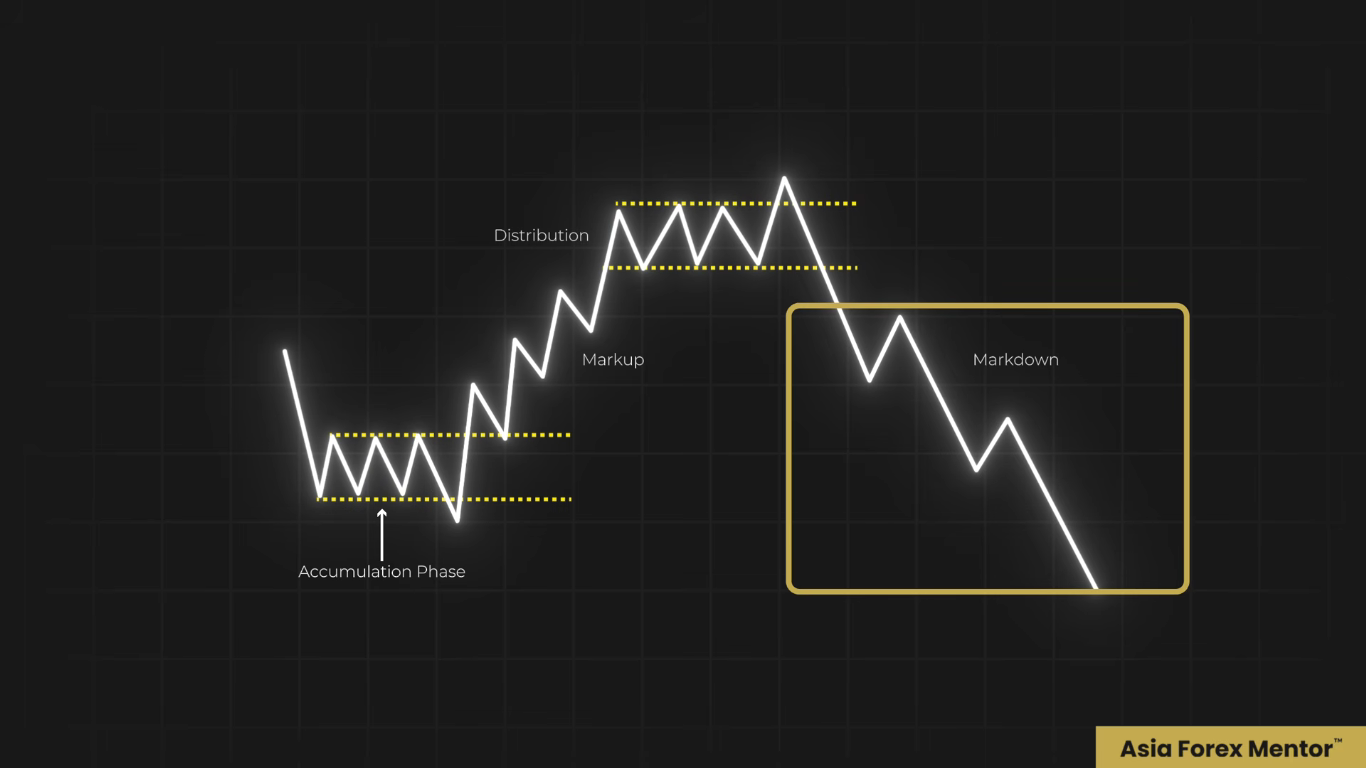
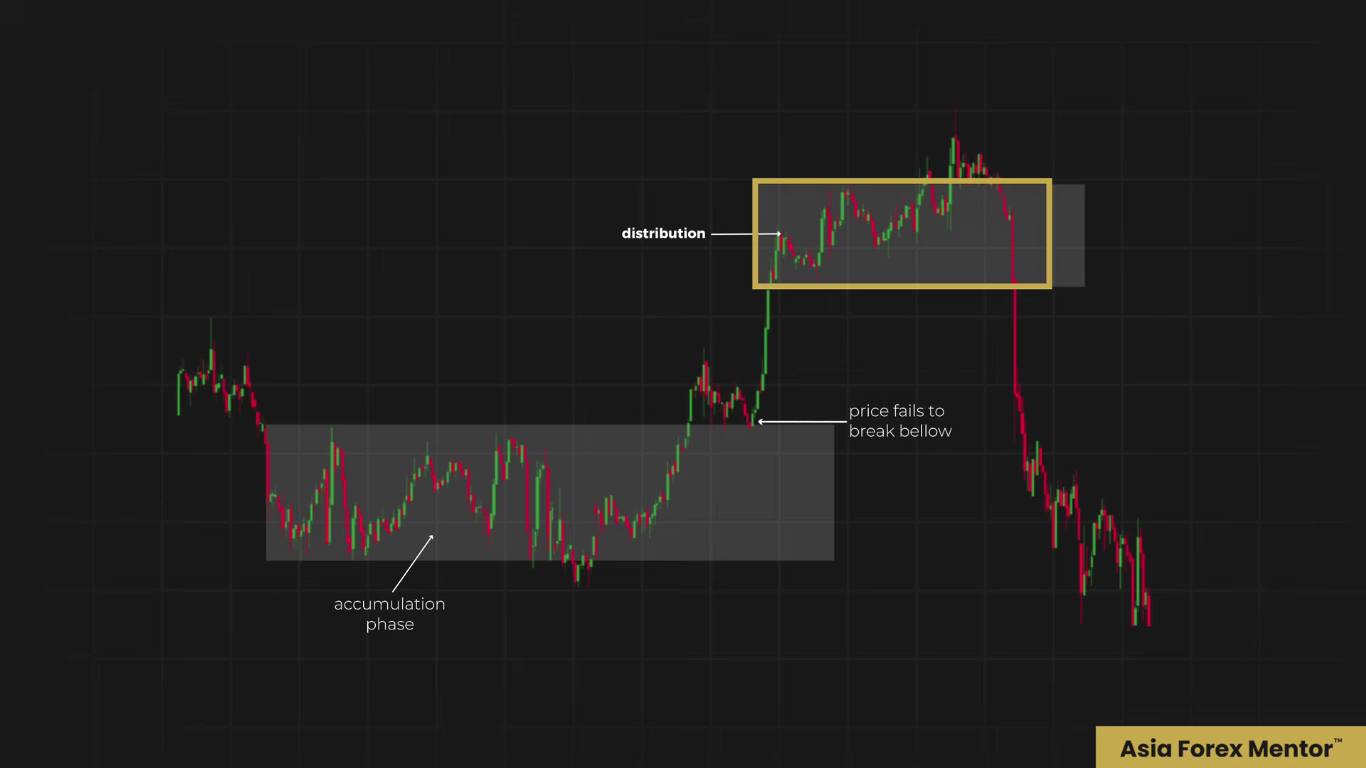
Accumulation and the spring
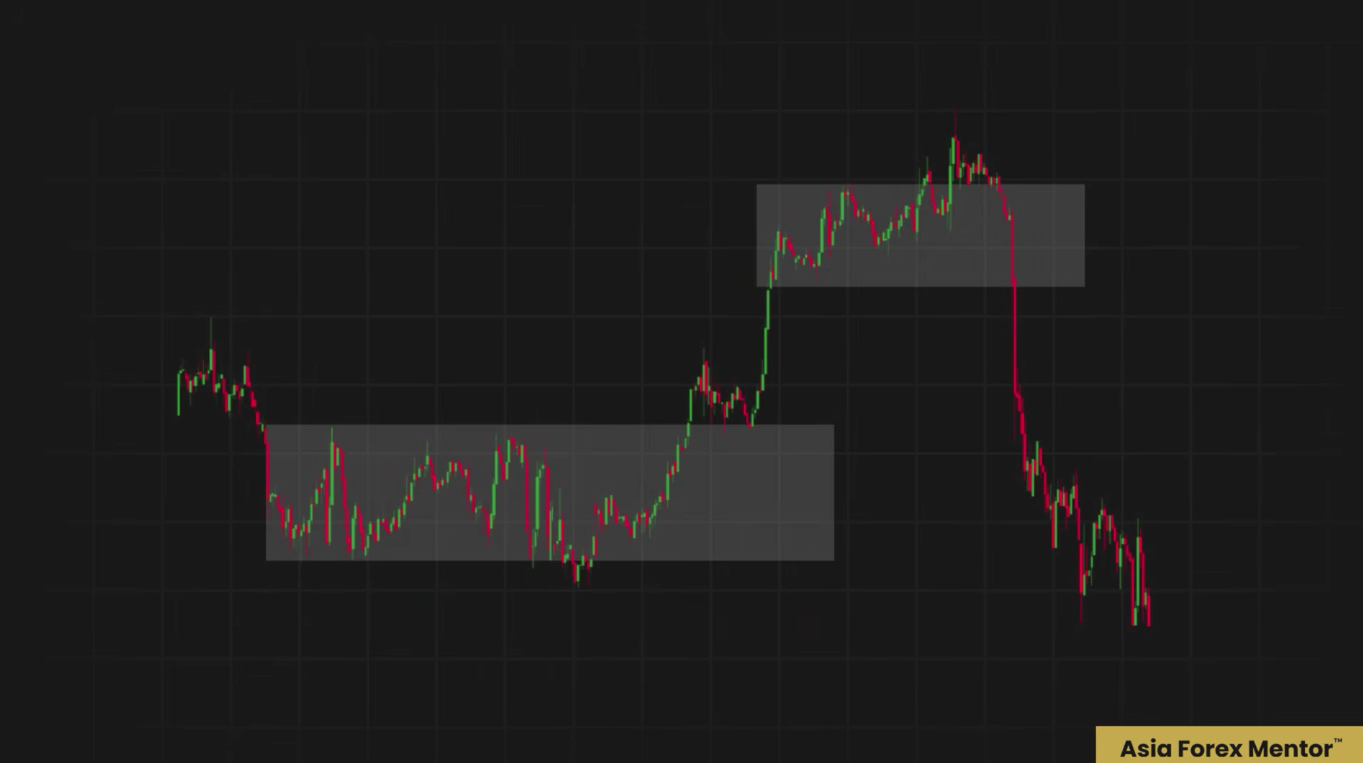
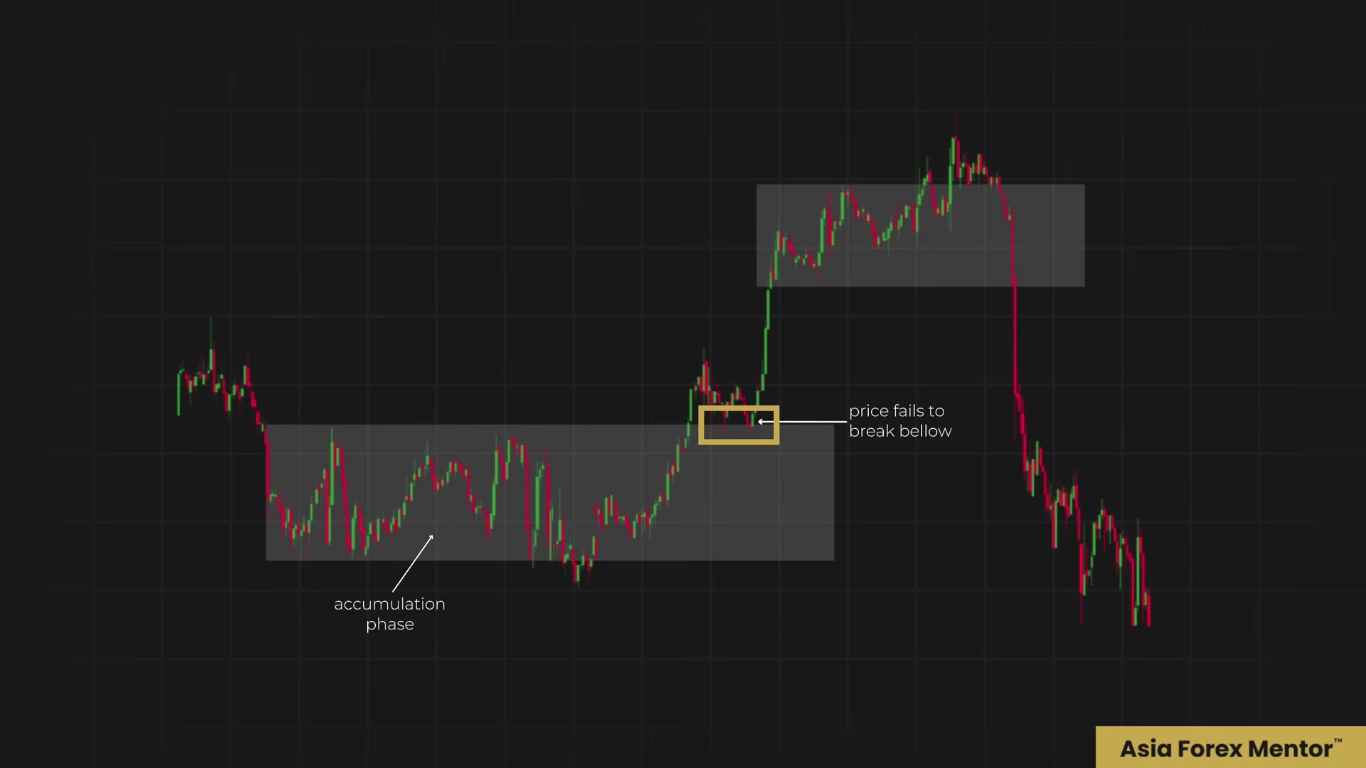
The first phase is accumulation. After the downtrend slows, price is going to stop falling and then it moves sideways into a range itself.
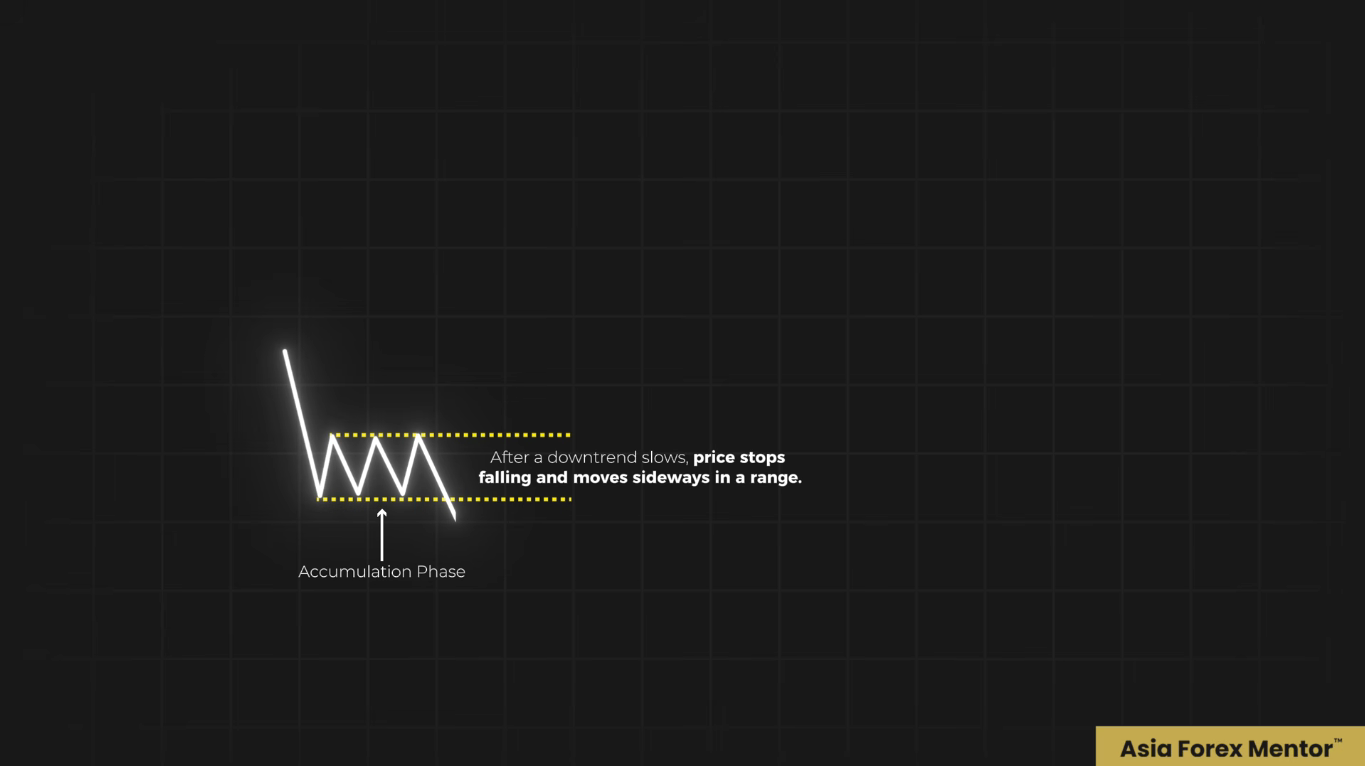
It may look quiet, but this is where the smart money, it builds positions. The selling pressure is absorbed over there at that area itself. It's setting the base for a larger move itself.
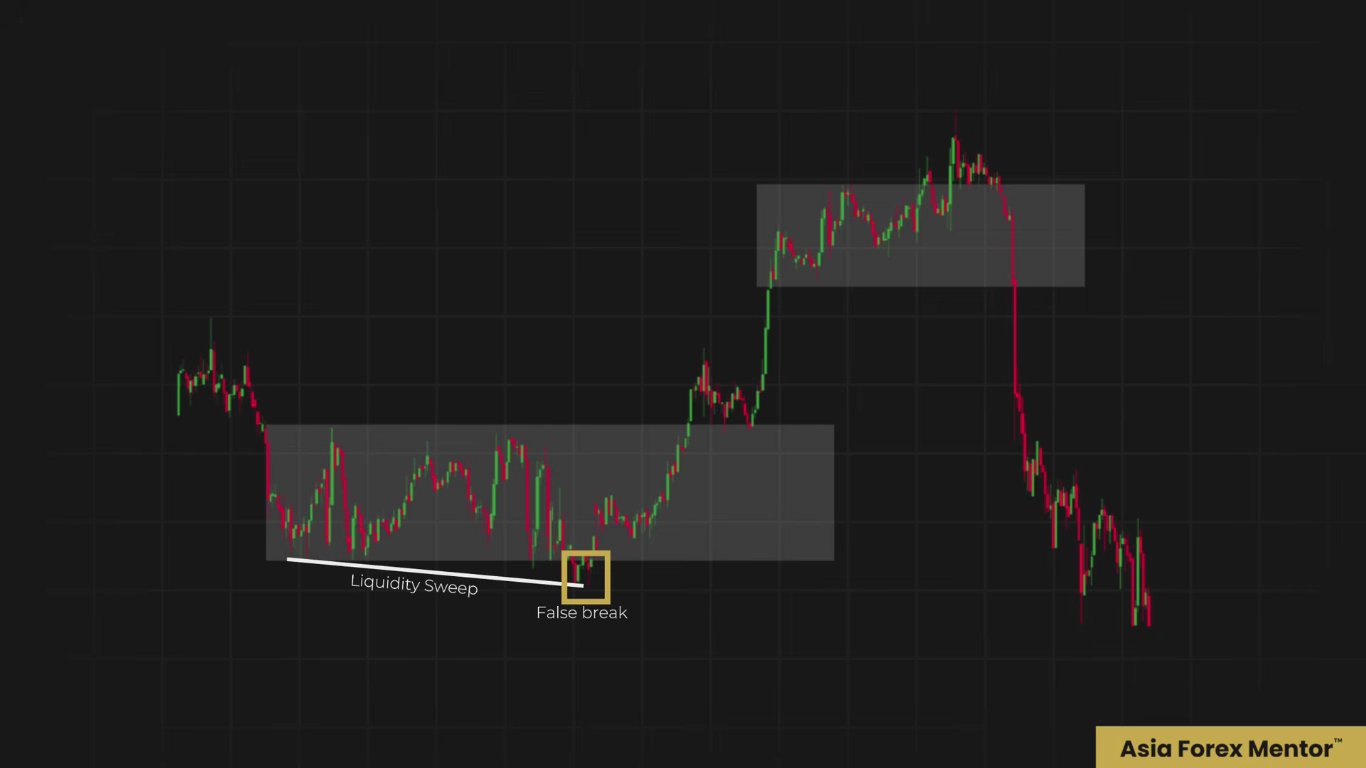
Now here's where Wyckoff becomes more powerful. Within the accumulation, price can make a false break below the support.
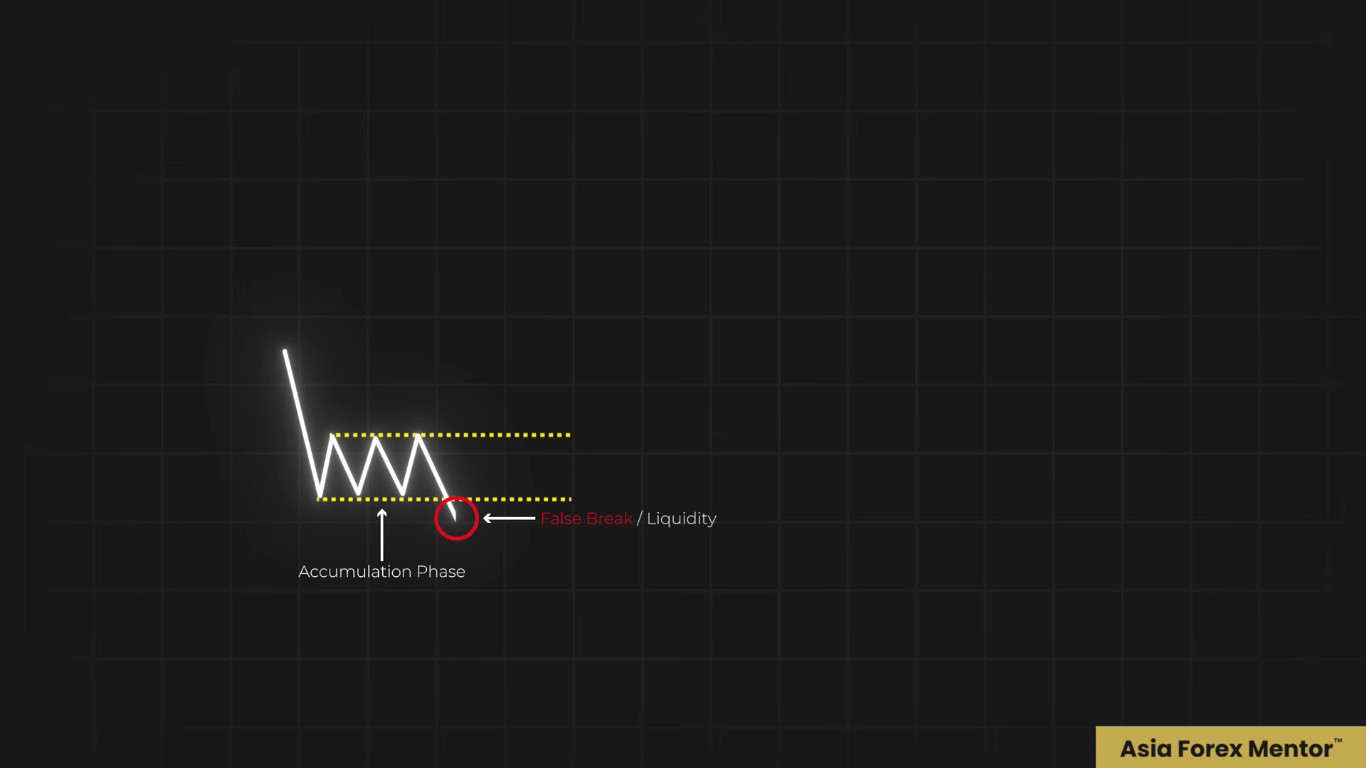
At first glance, it looks like the downtrend is continuing. But if price quickly reclaims and goes back into the range itself, it signals a rejection of the lower pricing.
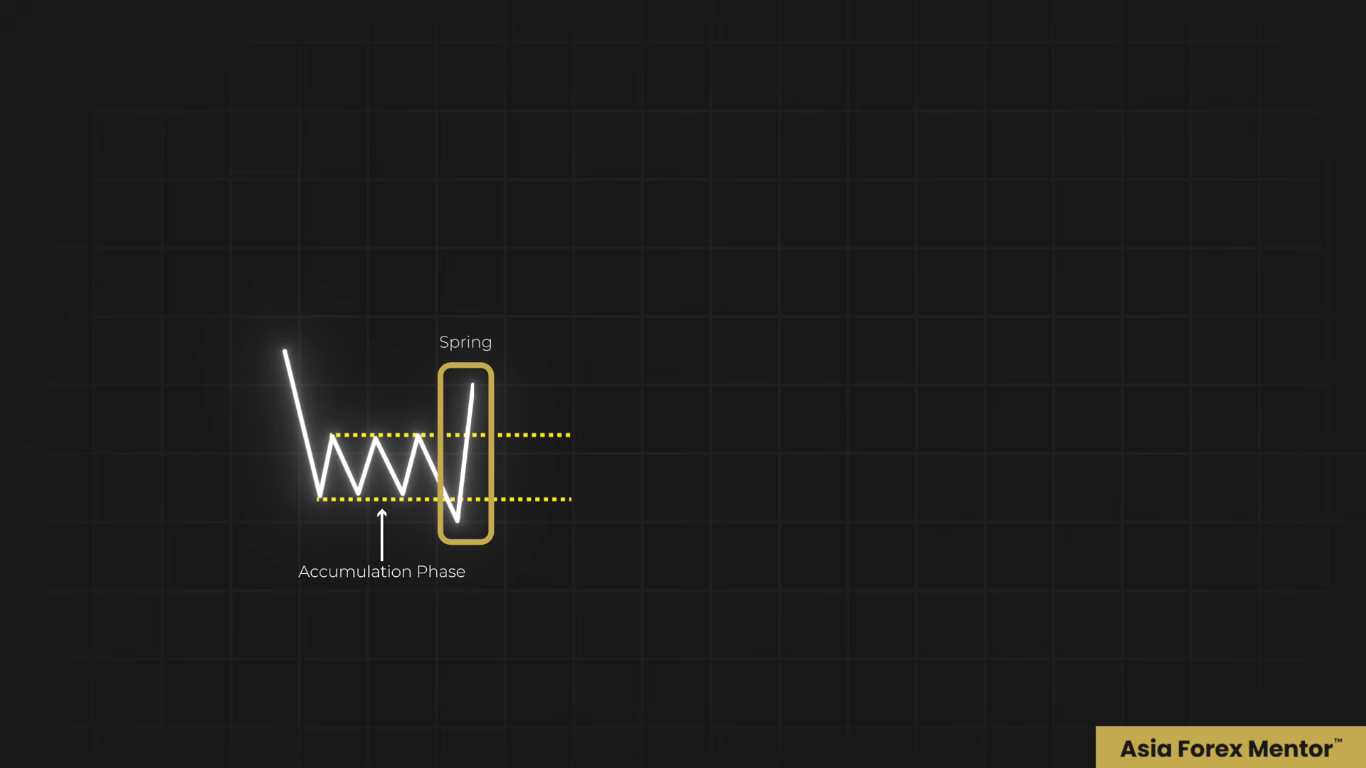
So this move, it traps all the sellers and then it gathers the liquidity before reversing higher itself. And this is what Wyckoff calls a spring.
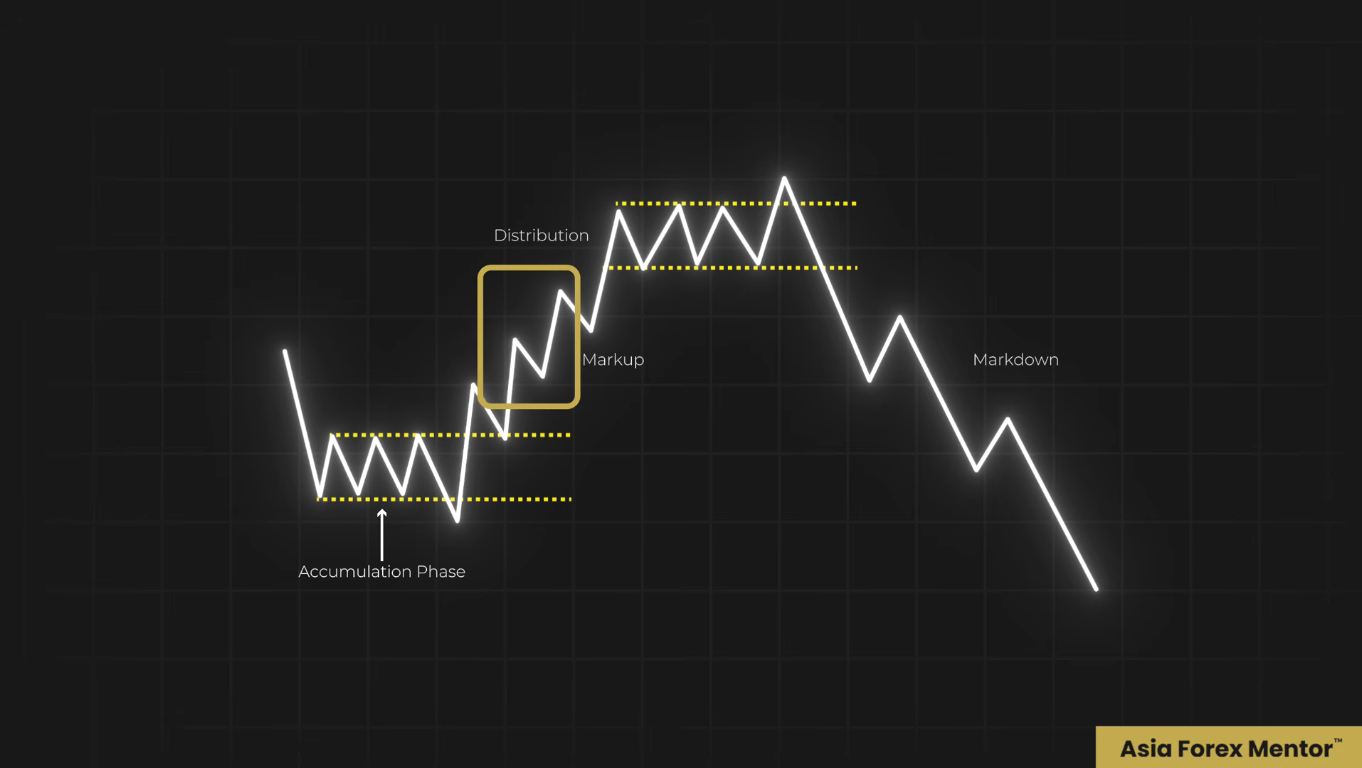
Once the accumulation ends, the market enters markup. This is where price trends higher now with clear momentum itself.

Higher highs, higher lows, it starts to form, making the move now more visible itself.
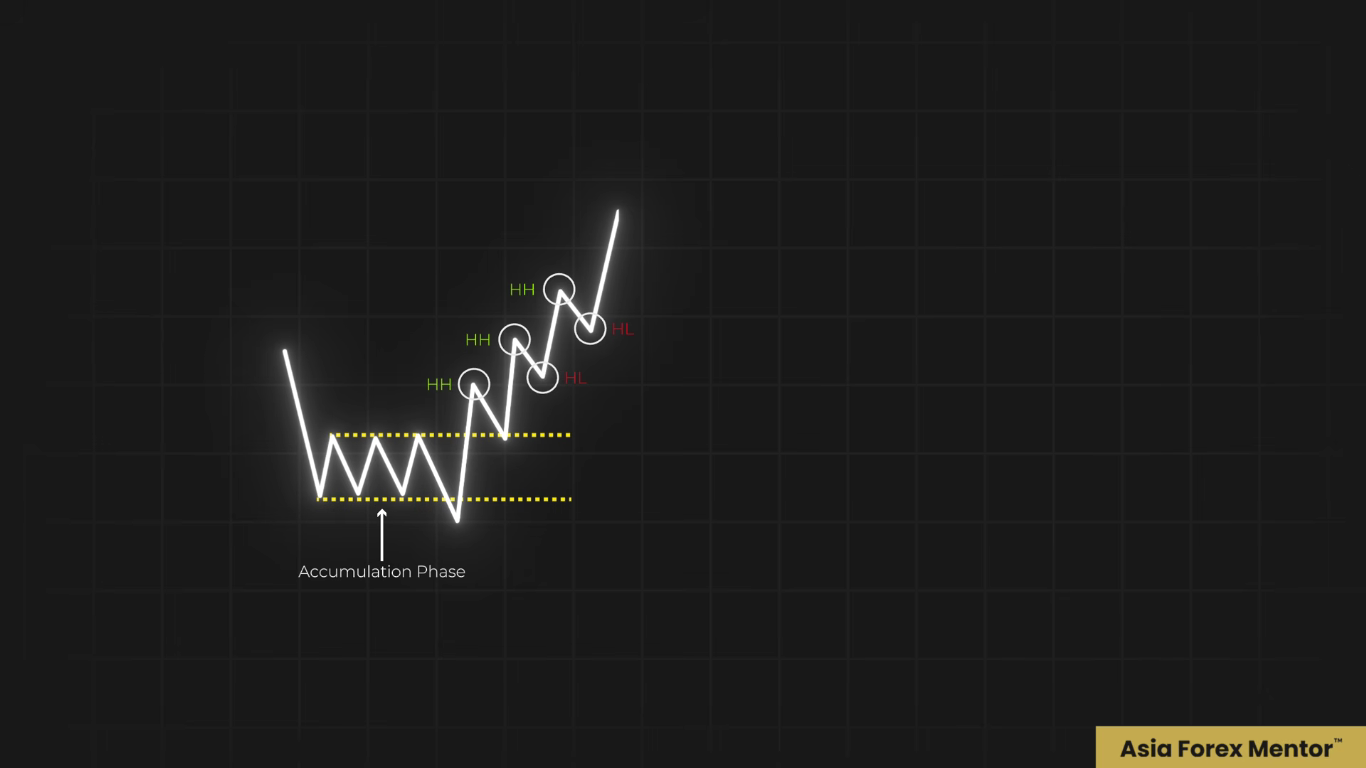
Most traders, they jump in here, but the real edge comes from recognizing that the markup begins after the accumulation
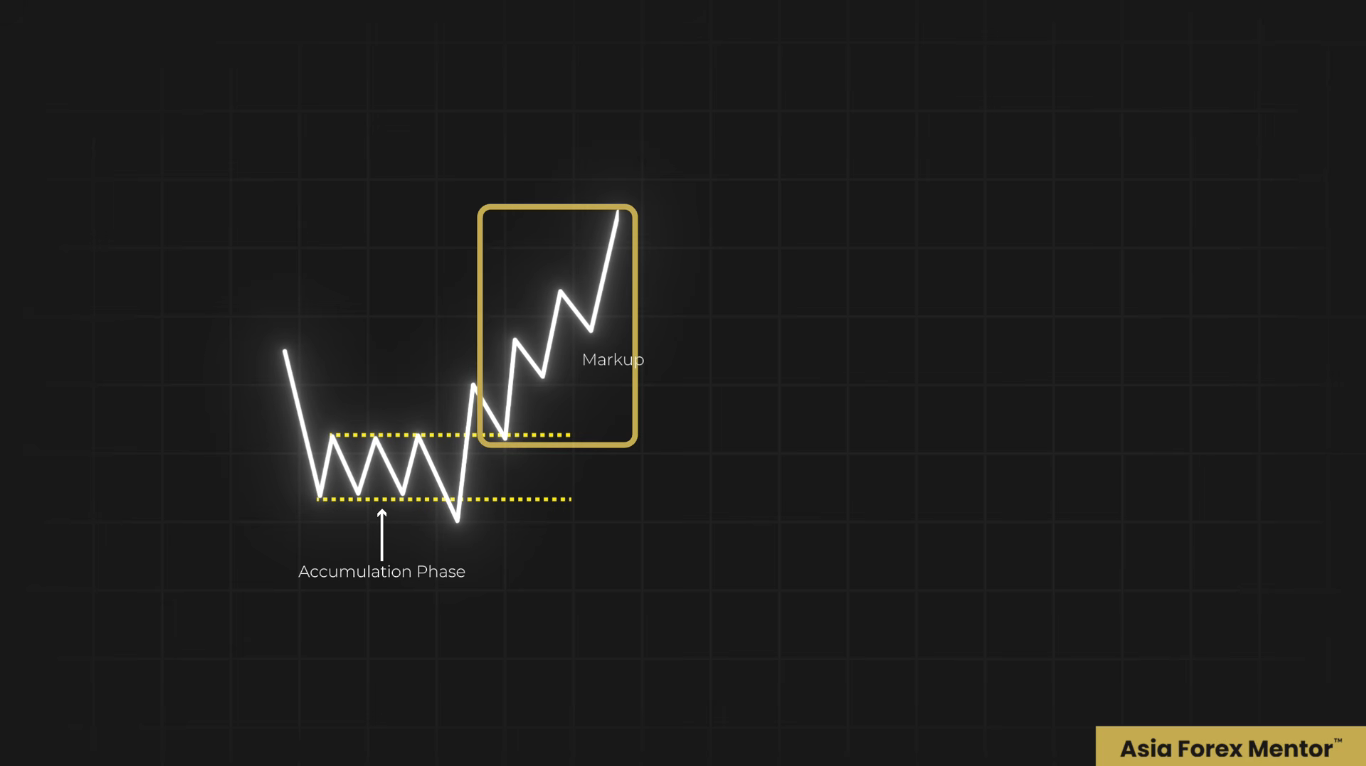
So you can catch the shift early and not chase the trend late.
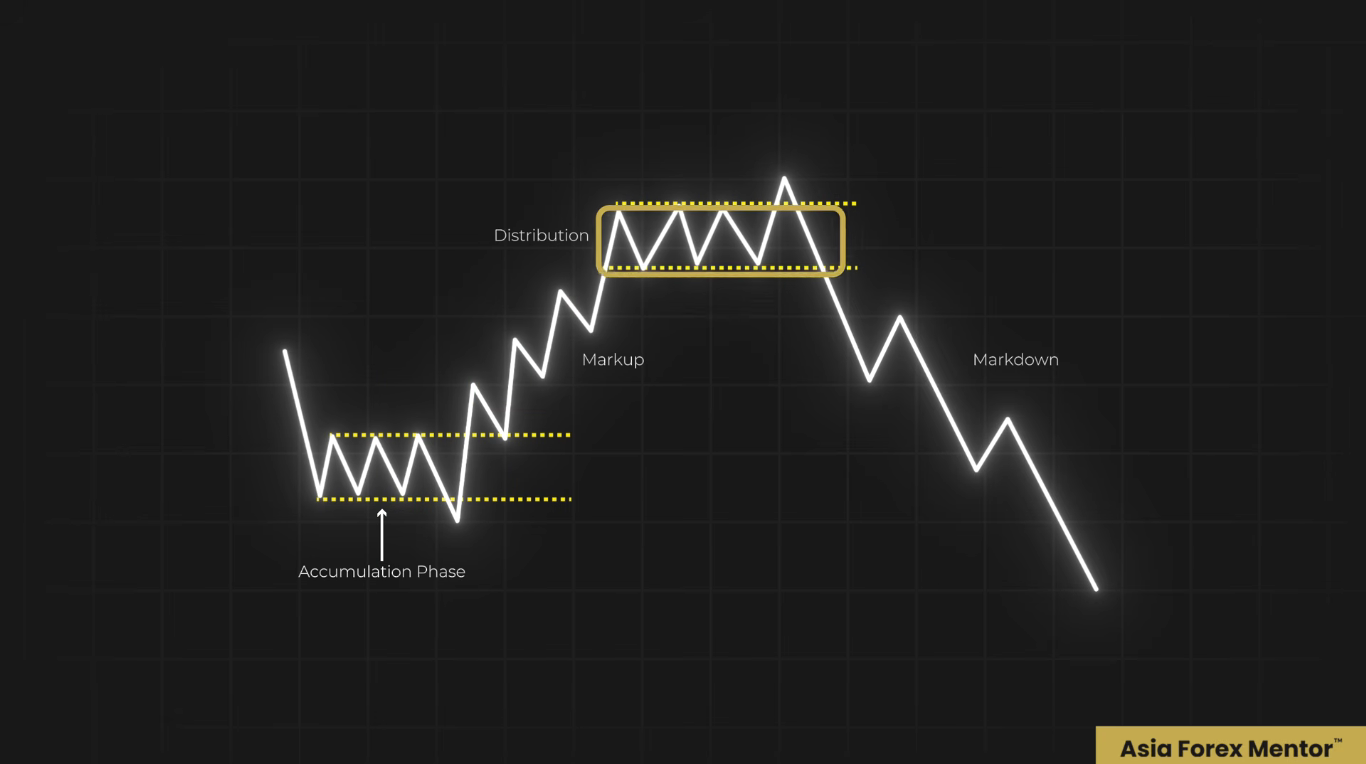
After the markup, price may enter distribution. This is where the positions, they are unloaded near the top itself.
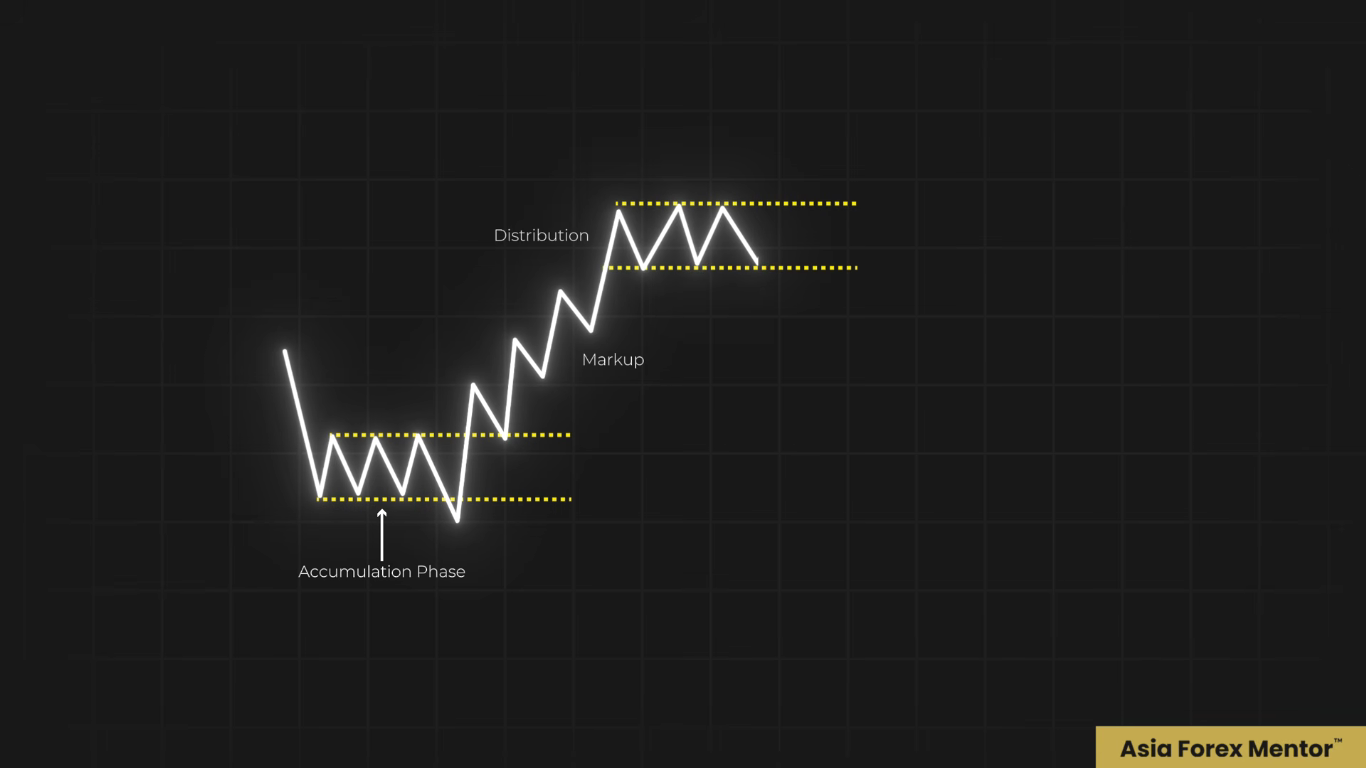
Price often moves sideways. It tricks traders into expecting a continuation. But in Wyckoff, this range can signal weakness. It's showing that the market may be selling into the late buyers itself. So it's not preparing for another move up.
So just as the accumulation can form a spring below the support, the distribution can create a trap above the resistance.
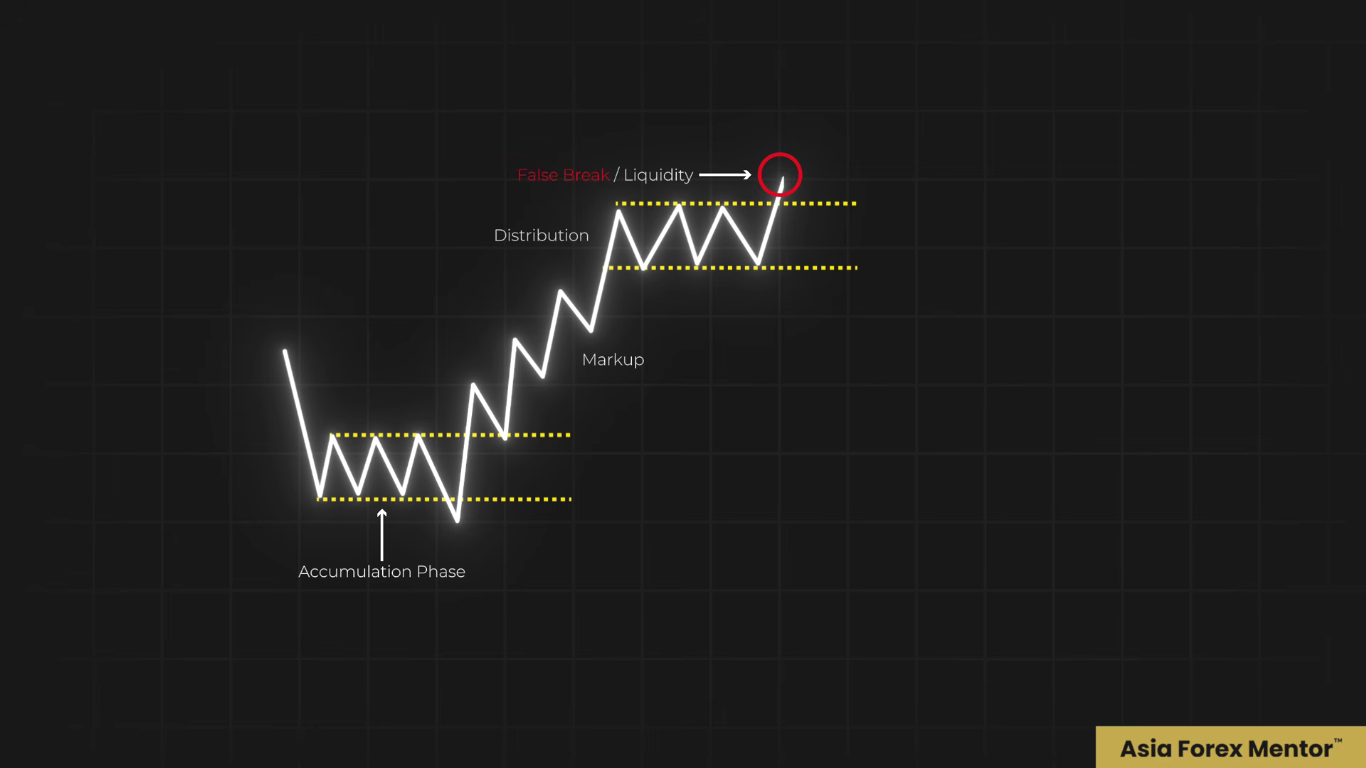
Price may break higher, it attracts all the breakout buyers and then it falls back into the range. It grabs the liquidity from the top.
Once the support breaks, the market shifts into the markdown itself.

This is not just a drop, but the release after the distribution at the top. When the demand fades, the selling pressure now takes control itself.
When you piece the cycle together, it becomes clear. The accumulation is the base.
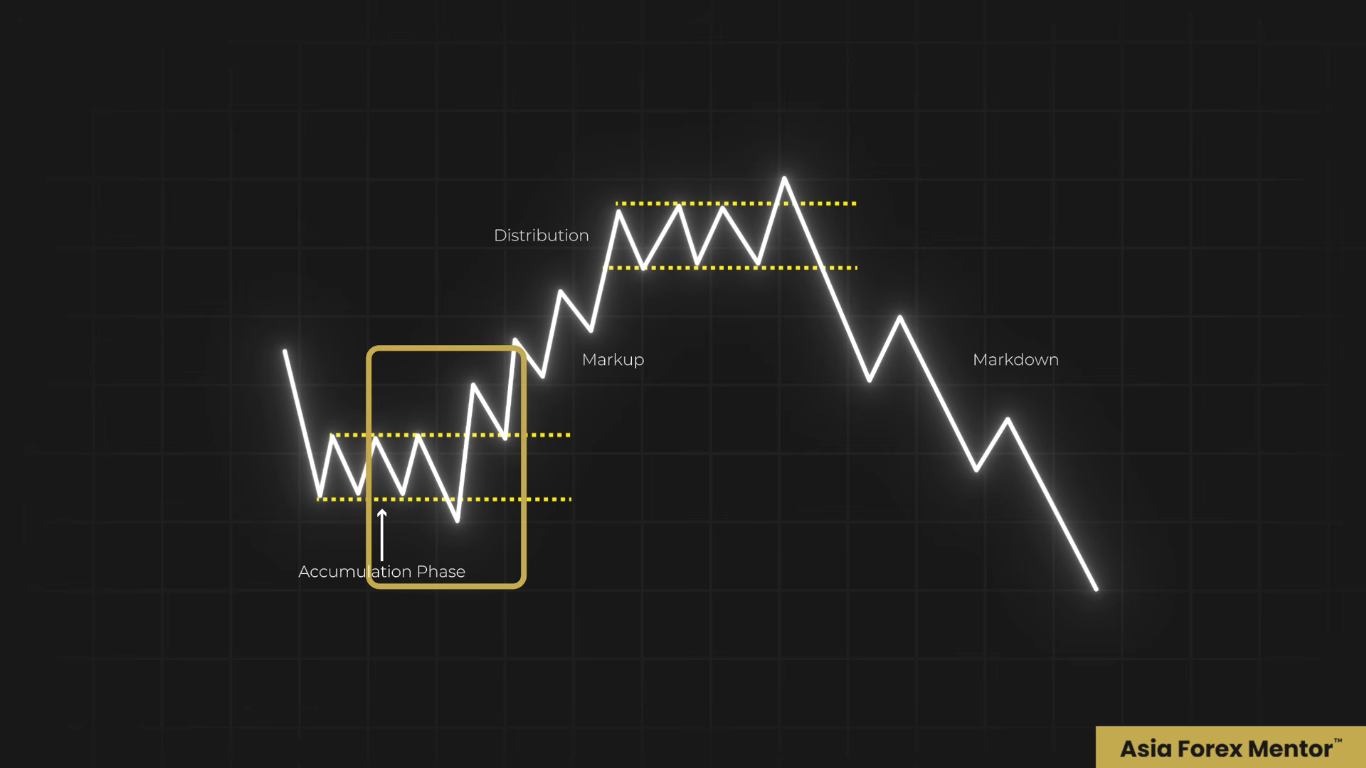
The markup is the move up.
The distribution is the topside that is unloading,
and the markdown is the bearish release of it.
With this lens, price stops looking random. A range after a drop is not the same as a range after a rally. A false break means different things depending on the context, because the context defines the move itself.
This is why Wyckoff is so powerful for advanced traders. It focuses on the intent, not just the structure. A sweep below the support that reclaims the range can signal accumulation,
while a failed break above the resistance can point to distribution.
Once confirmed, markup or markdown, it follows a clearer direction.
So instead of asking, is this support or is this resistance, you ask: what phase is this level in? And that shift, that shift changes how you read the entire market itself.
Putting Market Structure Together
Here's what it all comes down to.
The market is not random. It never was. Every move has a pullback, every trend has structure and every cycle has a phase itself. And once you know how to read all these three, the chart stops feeling like noise. It starts feeling like a road.
The pullback entries, it gives you the location. The dynamic structure, it gives you the continuation. Wyckoff, it gives you the phase. So when you put all this together, you're no longer guessing. You are now reading. Most traders, they just randomly enter moves out there. You now know how to enter at the origin.
What To Do Next
If you want to go deeper, I've put together a free training that shows you exactly how I trade using my full method. This is the same method that I've used for over 20 years. This is also the same method that I've taught to thousands of traders all over the world.
👉 FREE 3-Step Training: https://bit.ly/Free-3-StepTraining
FAQs
What is market structure in trading?
Market structure is how price moves through trends, pullbacks, and cycles higher highs and higher lows in an uptrend, lower highs and lower lows in a downtrend, and the accumulation, markup, distribution, and markdown phases of the full cycle. Reading it tells you the location, the timing, and the phase of the market, so you stop entering too late.
Why do I keep getting stopped out even with good analysis?
Usually the analysis is not the problem the location is. Most traders enter after the move has already started. The fix is to enter on the pullback: wait for price to break a level with strength, pull back into it, and reject that zone before you enter.
What is a support and resistance flip?
When price breaks through a resistance level with strength, that old resistance is no longer just a line on the chart it becomes your reference zone. If price pulls back to it and holds, the old ceiling has turned into a floor, and that flip is one of the cleanest continuation entries in an uptrend (and the mirror image in a downtrend).
What is the Wyckoff cycle?
The Wyckoff cycle has four phases: accumulation (the base, where smart money builds positions), markup (the move up), distribution (the topside unloading), and markdown (the bearish release). Reading the phase, not just the level, tells you the intent behind a move a spring below support signals accumulation, a trap above resistance signals distribution.
Which moving averages are best for tracking pullbacks?
The 8 SMA and the 21 SMA. The 8 stays closer to price and tracks the short-term move; the 21 sits deeper and gives a broader dynamic support or resistance area. Together they create a pullback zone in a strong uptrend, price often pulls back into the space between them before the next leg.