Singapore
 Malaysia
 Indonesia
 Philippines
 Thailand
 Vietnam
 Cambodia
 Myanmar
 Brunei
 China
China Japan
Japan South Korea
 Taiwan
 India
India Australia
  New Zealand
 United Kingdom
 Switzerland
 Italy
Italy Spain
Spain UAE
UAE United States
 Mexico
 Argentina
 South Africa
 IC Markets
 Pepperstone
 AvaTrade
 XM
XM Plus500
 RoboForex
 TMGM
TMGM Exness
 JustMarkets
 Orbex
Orbex Interactive Brokers
 Saxo
Saxo Tiger Brokers
 Binance
 Coinbase
 Gemini Exchange
 Kraken
 iFunds
 IC Funded
 The 5%ers
 TopStep
 IQ Option
 Pocket Option
 RaceOption
 IQCent
Support and resistance levels are the most widely referenced concept in technical analysis , yet retail trading data consistently shows that the majority of traders apply them without structural discipline. They draw too many lines, place them at the wrong prices, and then blame the market when price blows straight through what looked like a solid level.
|
ABOUT THIS GUIDE |
This guide covers what support and resistance really are, why price reacts at key levels, a step-by-step method for drawing them correctly, and how to trade bounces and breakouts with a structured, institutional-grade approach. It also covers the most common mistakes and how to combine these levels with other tools for higher-probability setups. |
|
QUICK ANSWER |
Support is a price zone where buying pressure is strong enough to pause or reverse a downward move. Resistance is where selling pressure is strong enough to pause or reverse an upward move. These zones form where institutions and large traders previously entered the market in size and are likely to do so again when price returns. |
What Support and Resistance Actually Are
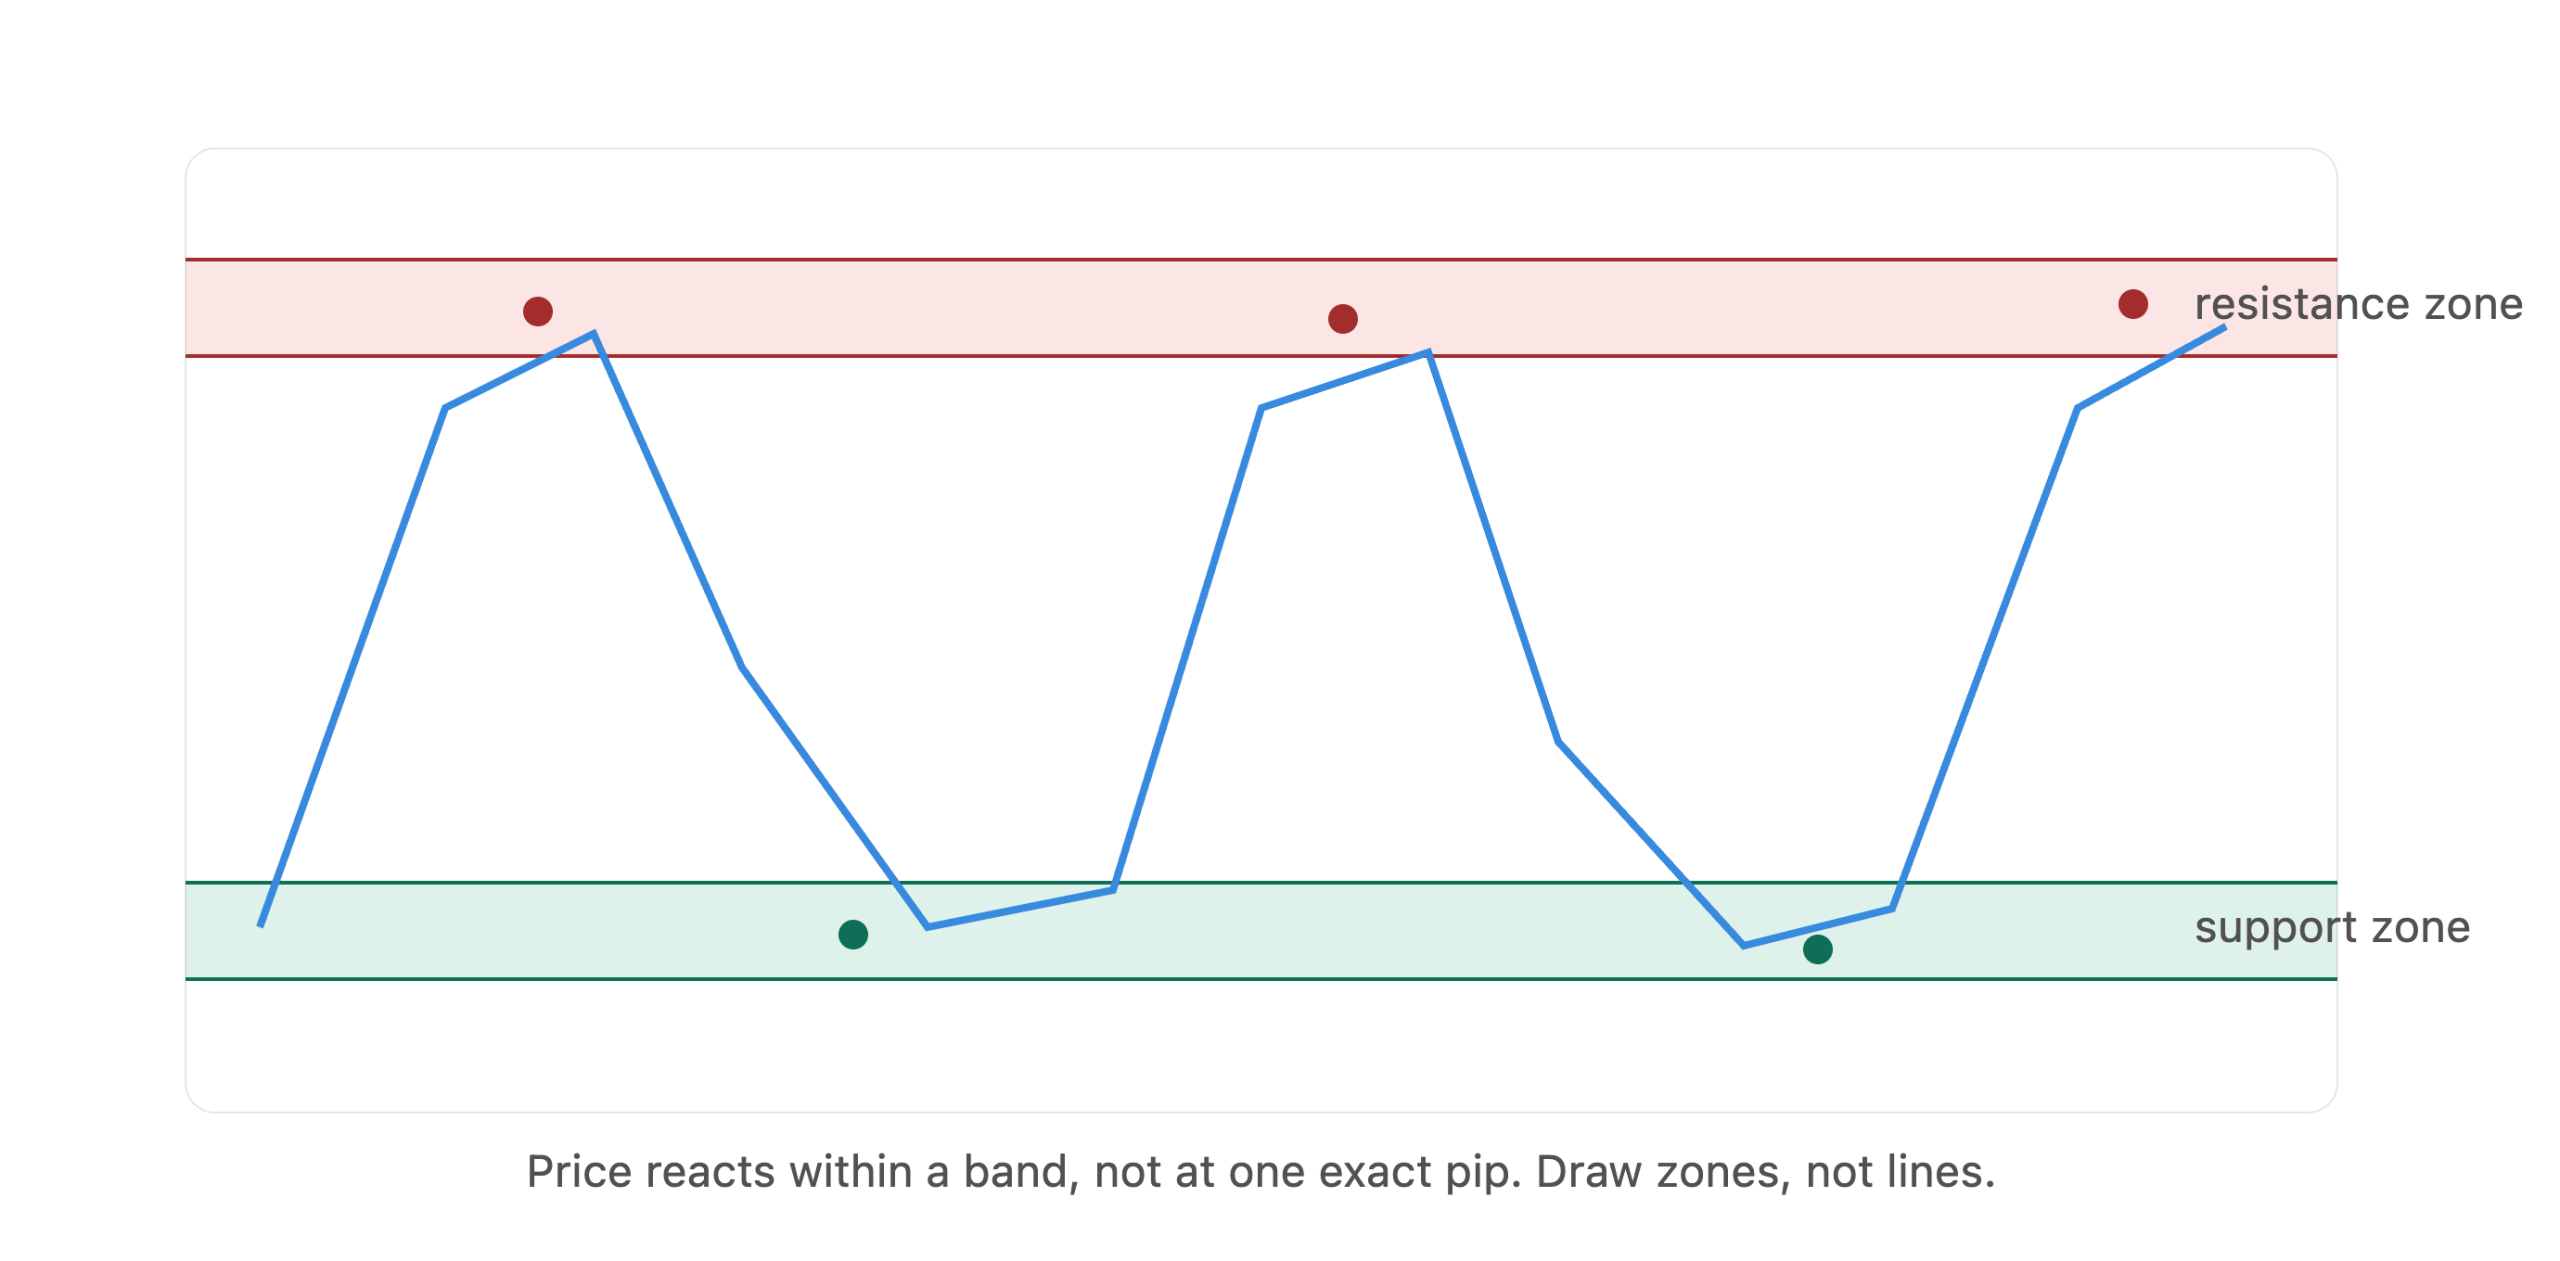
Support and resistance are horizontal price areas where the market has previously paused, reversed, or consolidated. They are not magic lines. They are records of where significant buying or selling activity occurred in the past, and where it is likely to reoccur when price returns to the same area.
Support is a price zone where demand exceeds supply. Price falls into the zone, buyers step in, and the downward move stalls or reverses. Resistance is the opposite: a price zone where supply exceeds demand. Price rises into the zone, sellers step in, and the upward move stalls or reverses.
The key word is “zone.” Treating support and resistance as exact price lines is one of the most common and costly mistakes in trading. Price does not turn on a single pip. It reacts within a range that reflects the activity of large market participants entering or exiting positions over a period of time.
Support and resistance are the foundation of price action trading. Every major candlestick pattern, trendline setup, and breakout strategy depends on identifying these levels first. Without them, technical analysis has no structural context to work from.
Why Price Reacts at Key Levels
Price reacts at support and resistance levels because of memory. The market is a record of all past decisions, and significant price levels carry that memory forward. When price returns to a level where buyers or sellers previously acted in size, those same participants often respond again.
Institutions and large traders place orders at the same levels repeatedly. A bank that bought EUR/USD at 1.0800 and saw price move 200 pips in their favor is likely to buy again if price returns to that level. Their order size is large enough to absorb selling pressure and cause visible reactions on the chart. This is the institutional explanation for why certain levels hold.
Retail traders see this price memory play out and label it support or resistance. What they are actually observing is the footprint of institutional order flow. Asia Forex Mentor trains traders to read that footprint and understand why levels work, rather than simply observing that they do. That distinction changes how you plan and execute trades.
There is also a psychological element. Round numbers like 1.1000, 1.2500, and 145.00 attract orders because traders and algorithms naturally anchor decisions to clean figures. These levels often act as strong support or resistance even without a clear structural reason, simply because millions of market participants are watching the same price.
How to Identify Support and Resistance on Any Chart
Identifying key levels requires discipline and a clear process. Most traders draw too many lines. The goal is to mark only the levels that actually matter: the ones where price has reacted strongly, multiple times, and ideally across multiple timeframes.
Follow these steps to identify support and resistance correctly:
- Start on the weekly chart. Zoom out first. Weekly levels carry the most weight because they represent the largest institutional decision points. Mark any area where price reversed sharply or consolidated across multiple candles.
- Move to the daily chart. Daily levels are the working reference for most swing traders. Mark areas where price made a clear high or low and then moved away with momentum. Ignore small, choppy reactions.
- Look for level confluences. A level that appears on both the weekly and daily chart is far more significant than one visible only on the 4-hour chart. The more timeframes that confirm a level, the more institutional interest exists there.
- Identify swing highs and swing lows. A swing high is a candle with a higher high than the candles on either side. A swing low is the opposite. These structural reference points form the backbone of all support and resistance analysis.
- Drop to your entry timeframe. Once you have the key levels from higher timeframes, move to the 4-hour or 1-hour chart to observe how price is reacting at those levels. This is where you look for entry signals.
- Confirm that price actually responded. A level is only meaningful if price visibly responded to it in the past. Look for wicks, consolidation clusters, or sharp reversals as confirmation that the level has been respected before.
The goal is no more than three to five key levels marked on your chart at any time. If you have more than that, you are charting noise rather than structure.
How to Draw the Levels Correctly
Drawing support and resistance well separates structured analysis from guesswork. The mechanics matter as much as the identification.
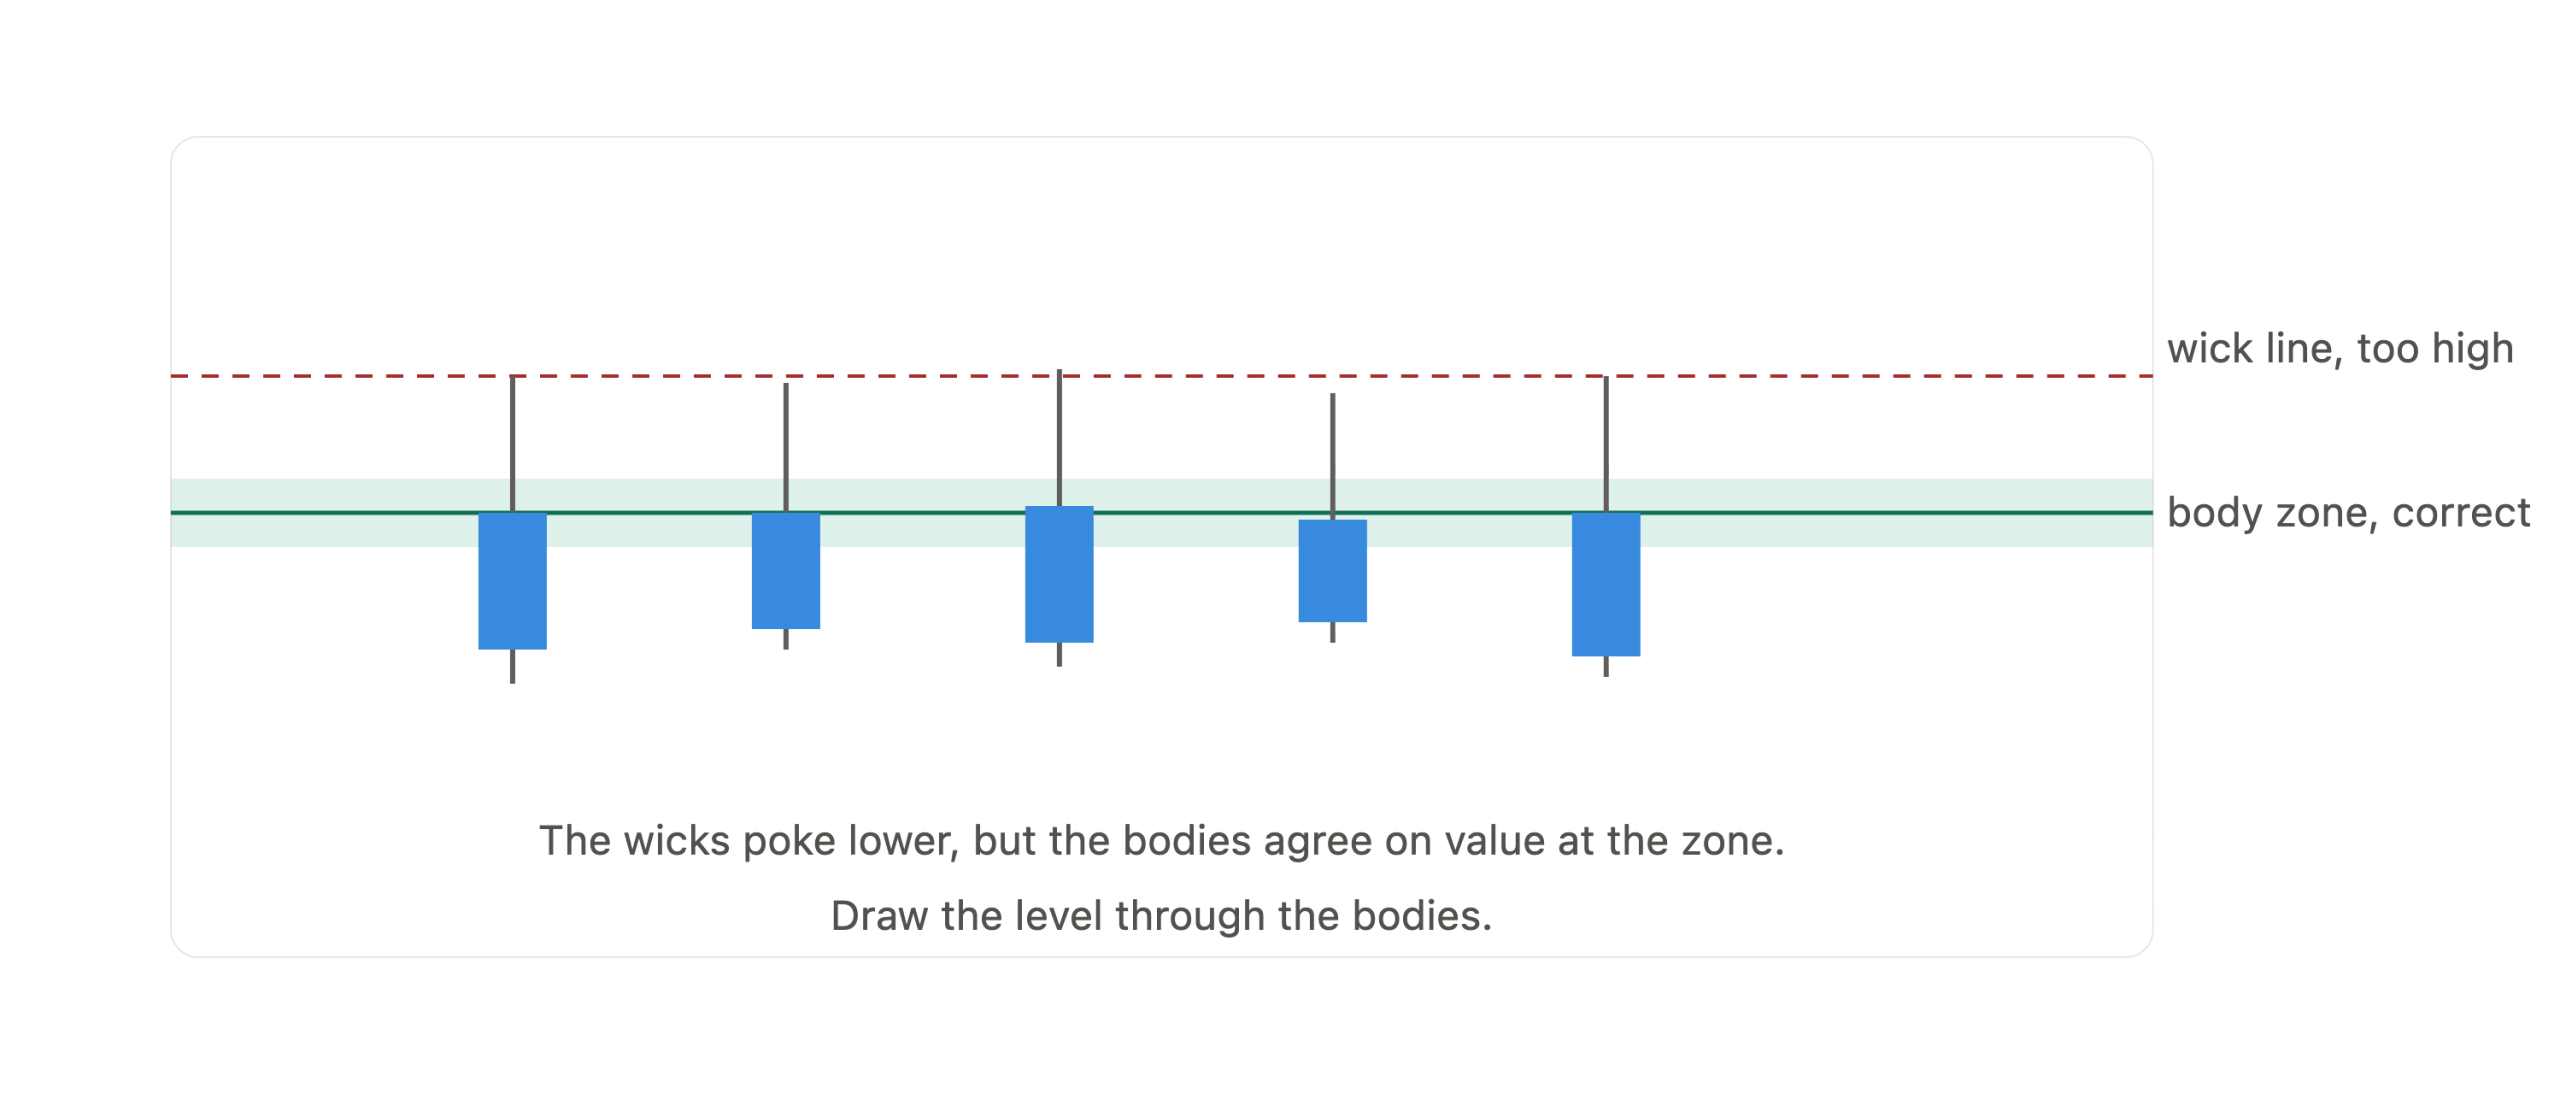
Use candle bodies as your primary reference. Wicks represent the extremes of buying and selling pressure and are often the result of stop hunts or liquidity grabs rather than genuine price decisions. The body of the candle is where price closed and where the market agreed on value. Draw your levels through the dense cluster of candle bodies at each reaction point.
Treat levels as zones, not exact lines. Draw a small rectangle or shaded area to represent the zone rather than a single horizontal line. This prevents premature entries and exits caused by treating a 1-pip touch as a confirmed reaction. Depending on the pair and timeframe, a zone is typically 10 to 30 pips wide.
Mark levels with at least two distinct reactions. A single touch does not confirm a level. It takes at least two clear reactions at the same approximate price to establish that a level is meaningful. Three or more touches raise the probability further.
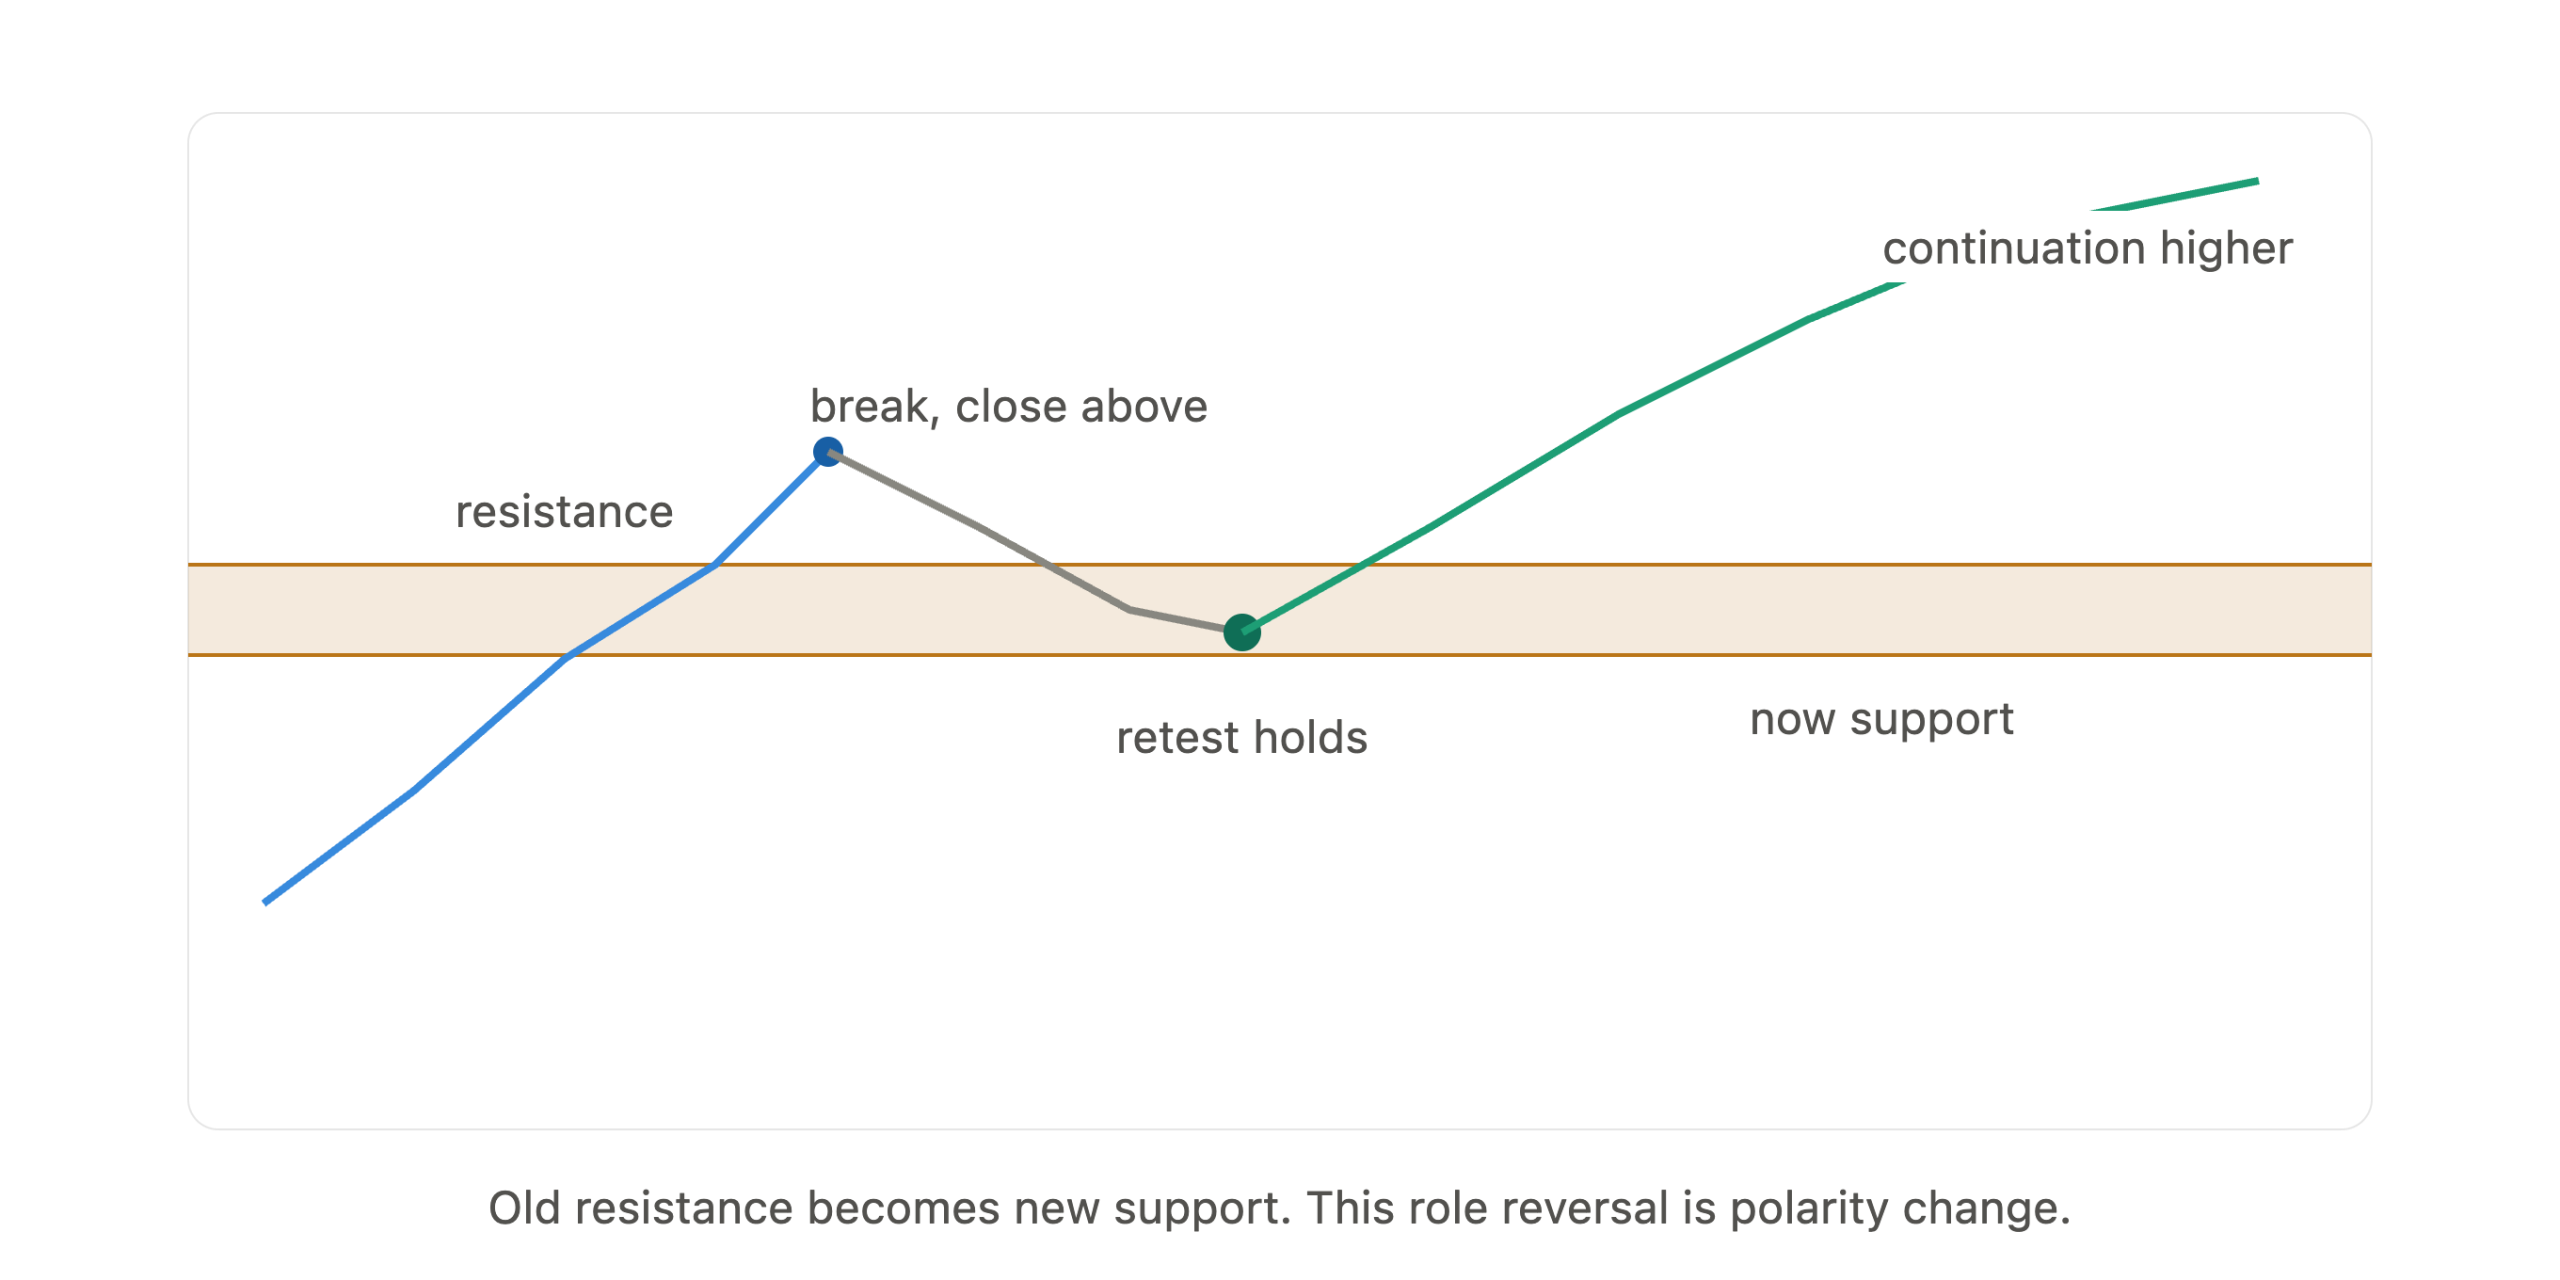
Support and resistance levels are not static. A level that acts as resistance can become support once price breaks through it cleanly. This role reversal, known as polarity change, is one of the most reliable setups in technical analysis and is the foundation of the breakout and retest strategy covered below. For a related concept that maps the full range of supply and demand activity, the guide on how to draw supply and demand zones covers the mechanics in detail.
Trading the Bounce at Key Levels
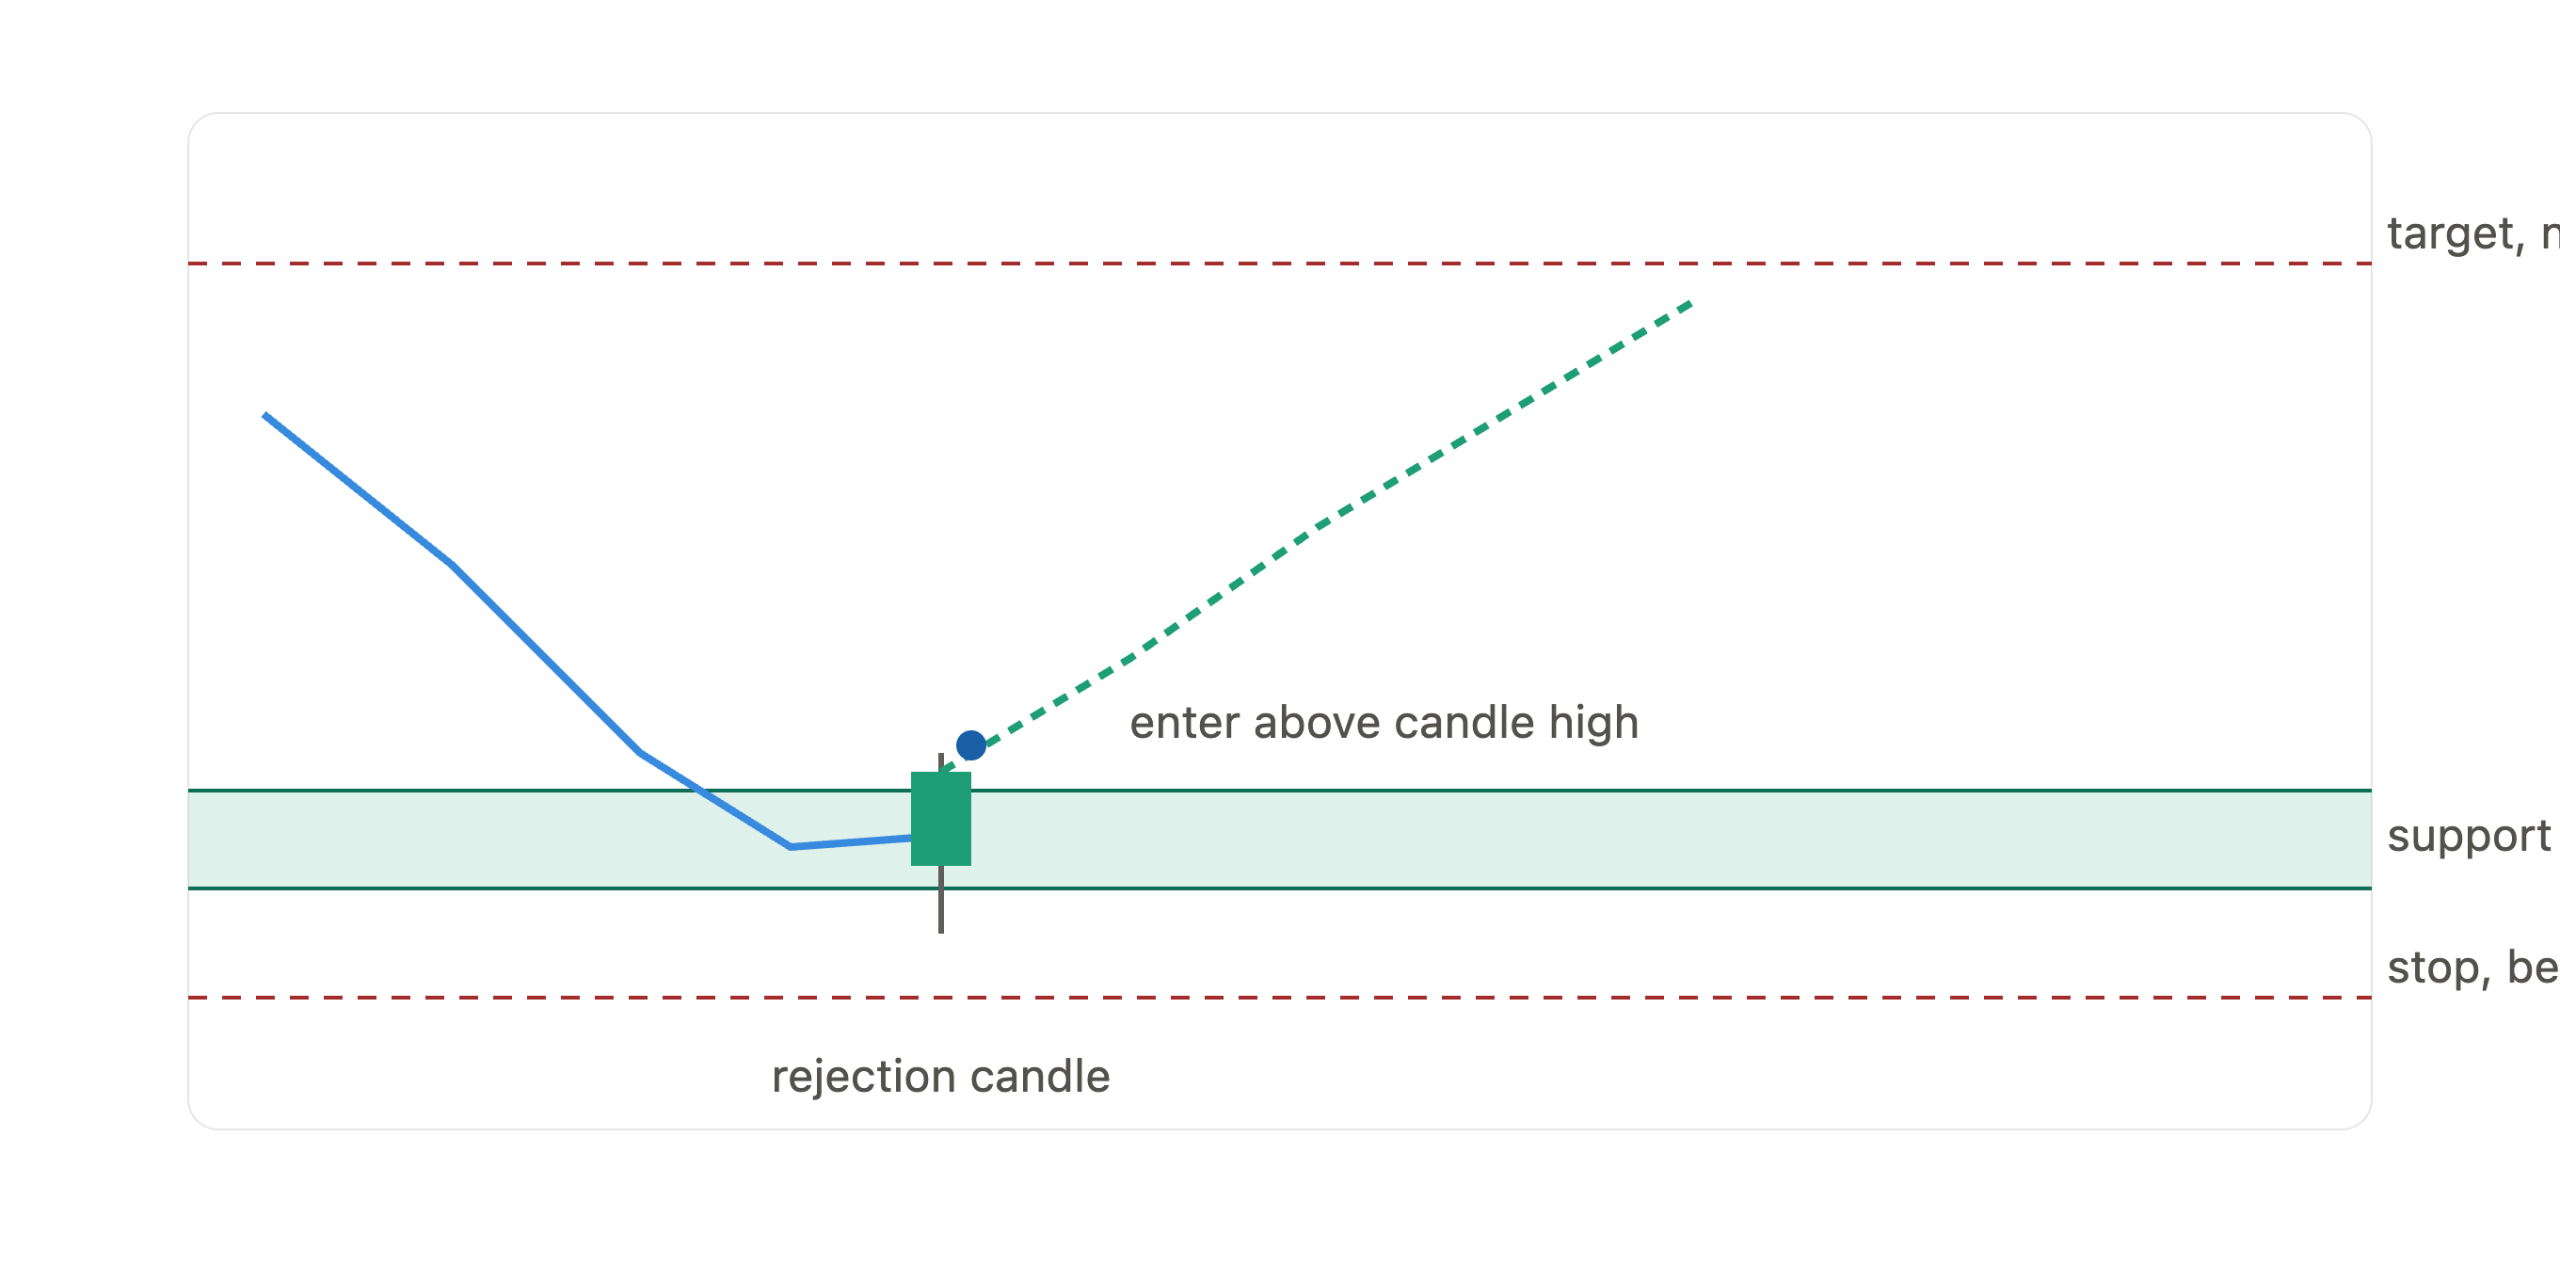
A bounce trade is the most straightforward way to use support and resistance. Price approaches a key level, slows, and reverses. The trader enters in the direction of the reversal and targets the next key level.
Three elements must be present for a valid bounce setup:
- A clearly defined key level confirmed by at least two prior reactions on the current or higher timeframe.
- A rejection signal at the level. This is typically a candlestick pattern: a pin bar, bullish or bearish engulfing candle, or inside bar that forms at the zone and signals that buyers or sellers are stepping in. The guide on forex candle patterns every serious trader must know covers the key patterns to watch at key levels.
- A clear target at the next level. Know where price is going before you enter. The reward must be at least twice the risk for the setup to make sense from a probability standpoint.
For a support bounce: price falls to the support zone, a bullish reversal candle closes within or above the zone, you enter long above that candle’s high, place the stop below the support zone, and target the next resistance level above.
For a resistance bounce: price rises to the resistance zone, a bearish reversal candle closes within or below the zone, you enter short below that candle’s low, place the stop above the resistance zone, and target the next support level below.
Do not enter a bounce trade the moment price touches the level. Entering on touch alone means entering without confirmation, which increases exposure to false setups driven by institutional stop hunts. Wait for the rejection candle to close before committing.
Trading the Breakout and Retest
Not every approach to a support or resistance level results in a reversal. Sometimes price breaks through with enough momentum to continue in the breakout direction. The breakout and retest setup captures this move while managing risk through the polarity change principle.
A genuine breakout has several observable characteristics:
- Price closes decisively beyond the level rather than leaving a wick through it.
- The breakout candle is larger than average and closes near its extreme, showing strong momentum.
- Volume increases on the breakout where that data is available.
- Price does not immediately reverse back through the broken level after closing.
After a genuine breakout, price will often return to the broken level to retest it. Old resistance becomes new support for a bullish breakout. Old support becomes new resistance for a bearish breakout. This retest is the controlled entry opportunity: you get confirmation that the break was real and you enter with a tight stop at the new structural level.
For a bullish breakout and retest: price breaks above resistance, pulls back to that level, holds as new support, and a bullish signal candle forms. Enter long above that candle, stop below the new support zone, and target the next resistance level above.
The biggest risk in breakout trading is chasing. If you missed the initial break and price has already moved 100 pips, do not enter. Wait for the retest, or let the setup go entirely. For a deeper look at how market structure drives breakout setups, see the market structure trading guide.
Combining Support and Resistance with Other Tools
Support and resistance levels become significantly more reliable when two or more technical factors point to the same price zone. This is called confluence, and it is the core of high-probability trade selection.
Here is how support and resistance aligns with other common technical tools:
| Tool | How It Combines with Support and Resistance |
|---|---|
| Trendlines | A rising trendline that intersects a horizontal support level creates dual confirmation. Price has both dynamic and static reasons to hold at that zone. |
| Fibonacci Retracements | The 38.2%, 50%, and 61.8% levels that coincide with a horizontal level mark strong reversal zones. The Fibonacci retracement forex trading guide covers how to combine these with price structure. |
| Moving Averages | A 50 or 200 EMA acting as dynamic support near a horizontal support zone strengthens the bounce case considerably. |
| Candlestick Patterns | A pin bar or engulfing candle forming at a key level is the entry trigger. The level identifies where price may react. The candle pattern confirms when to act. |
| Volume | A spike in volume at a level shows institutional participation. Low volume on a test suggests the reaction may not hold. |
Levels that align with multiple technical factors consistently show stronger price reactions than isolated levels. That finding matches what Asia Forex Mentor observes across decades of live market analysis.
Common Mistakes Traders Make with Support and Resistance
Most traders make the same errors repeatedly. Recognizing these mistakes is as important as knowing the correct method.
- Drawing too many levels. A chart with ten or more horizontal lines has not identified key levels. It has mapped every minor swing. Trim down to three to five levels with clear, multiple reactions before placing any trades.
- Using exact prices instead of zones. Price does not stop at 1.2000 to the pip. Draw a zone of 10 to 30 pips around the level and treat any reaction within that zone as valid. Exact-line thinking causes premature exits and missed entries.
- Ignoring higher timeframe levels. A support level visible only on the 15-minute chart is far less significant than one confirmed on the daily chart. Always check the higher timeframe context before placing a trade based on a lower timeframe level.
- Chasing breakouts. Entering immediately as price breaks a level is the retail trap. Large traders often sell into that momentum, creating the reversal that stops out breakout chasers. Wait for the retest. The smart money concepts trading guide covers the mechanics in depth.
- Failing to update levels. Markets evolve and create new structure. A level that mattered six months ago may no longer be relevant today. Review and update your key levels regularly as new swing highs and lows form.
- Expecting every level to hold. Support and resistance identifies probable reaction zones, not guaranteed reversal points. Every level will break eventually. Always use a stop loss and risk no more than 1 to 2 percent of capital per trade.
Also Read: 7 Best Trading Strategies That Actually Work in 2026
Conclusion
Support and resistance are not complicated. The power comes from consistency in how you identify and draw them. Most retail traders fail at key levels because they draw too many, treat them as exact prices, and enter without waiting for a confirmation signal.
The institutional approach is simpler: find the zones where large participants have previously acted, draw them as zones rather than lines, wait for a rejection or breakout confirmation signal, and manage the trade with a clear target and a disciplined stop. That is the complete framework.
Frequently Asked Questions
What Is the Difference Between Support and Resistance?
Support is a price zone where buyers are strong enough to stop a downward move and push price higher. Resistance is a price zone where sellers are strong enough to stop an upward move and push price lower. Both represent areas of historical price activity where significant order flow has occurred before. The same level can act as both depending on which side of it price is trading.
How Do You Draw Support and Resistance Levels?
Start on the weekly or daily chart and identify swing highs and swing lows where price reacted sharply. Draw a horizontal zone through the cluster of candle bodies, not wicks, at each reaction point. A level needs at least two distinct reactions to be considered valid. Use a shaded rectangle rather than a single line to capture the full reaction area.
How Many Support and Resistance Levels Should You Mark?
No more than three to five per chart at any given time. If you have more than that, you are drawing noise rather than structure. Keep only the levels with the clearest and most frequent price reactions. Having fewer, well-chosen levels is more effective than having many imprecise ones.
What Is a Support and Resistance Zone Versus a Line?
A line implies that price will react at a single exact price. A zone reflects the reality that price reacts within a range, typically 10 to 30 pips wide depending on the pair and timeframe. Drawing zones keeps you from making premature exits or entries based on a single pip touching a level that might not hold.
What Happens When Price Breaks Through a Level?
When price breaks through a level convincingly, the roles often reverse. Old resistance becomes new support. Old support becomes new resistance. This role reversal is called polarity change and is the structural foundation of the breakout and retest trading strategy. A clean break through a well-drawn level often signals the start of a strong directional move.