With reversal patterns, the stop goes beyond the extreme of the pattern itself. On a Hammer setup, it sits just below the lowest wick. A Shooting Star flips that — the stop goes just above the highest wick.Most traders learn forex candle patterns , memorize every shape in the textbook, and still blow their accounts. Candlestick charting has been used in financial markets for over 250 years, originating with Japanese rice traders in the 18th century. The patterns have not changed. The problem is how most traders apply them.
|
ABOUT THIS GUIDE |
This guide covers the most reliable forex candle patterns used in institutional-level trading. You will learn how to read them, when they signal high-probability setups, and the one filter that separates winning trades from losing ones. |
|
QUICK ANSWER |
Forex candle patterns are visual formations on a price chart that signal potential reversals or continuations. The most reliable ones, Bullish Engulfing, Bearish Engulfing, Morning Star, and the Shooting Star, work best when they form at key support or resistance. Always confirm with structure before entering a trade. |
What Forex Candle Patterns Actually Tell You
Every candlestick records four prices from a specific time period: the open, high, low, and close. The body shows the range between open and close. The wicks (also called shadows) show where price traveled beyond that range before the candle closed.
When candles form in specific sequences, they reveal the battle between buyers and sellers. A large bullish body tells you buyers dominated that session. A long upper wick on a bearish candle tells you buyers tried to push higher but sellers rejected the move with force.
Understanding this context separates traders who use patterns profitably from traders who memorize shapes and lose money. The pattern is evidence of who is winning the battle. Your job is to read that evidence correctly and act when the odds are clearly in your favor.
Forex candle patterns work across all currency pairs and all timeframes. Daily and 4-hour timeframe patterns are the most reliable because they filter out short-term noise and reflect larger institutional moves.
How to Read a Single Candlestick
Before studying any pattern, you need to read individual candles fluently. Three components make up every candle.
The Body
The rectangular part of the candle. A large body signals strong directional conviction. A small body signals indecision or a near-equal balance of power between buyers and sellers during that period.
The Wicks (Shadows)
The thin lines above and below the body. A long upper wick means sellers rejected higher prices. A long lower wick means buyers rejected lower prices.
The Color
A green (or white) candle closes higher than it opened. A red (or black) candle closes lower than it opened.
Reading Candle Strength at a Glance
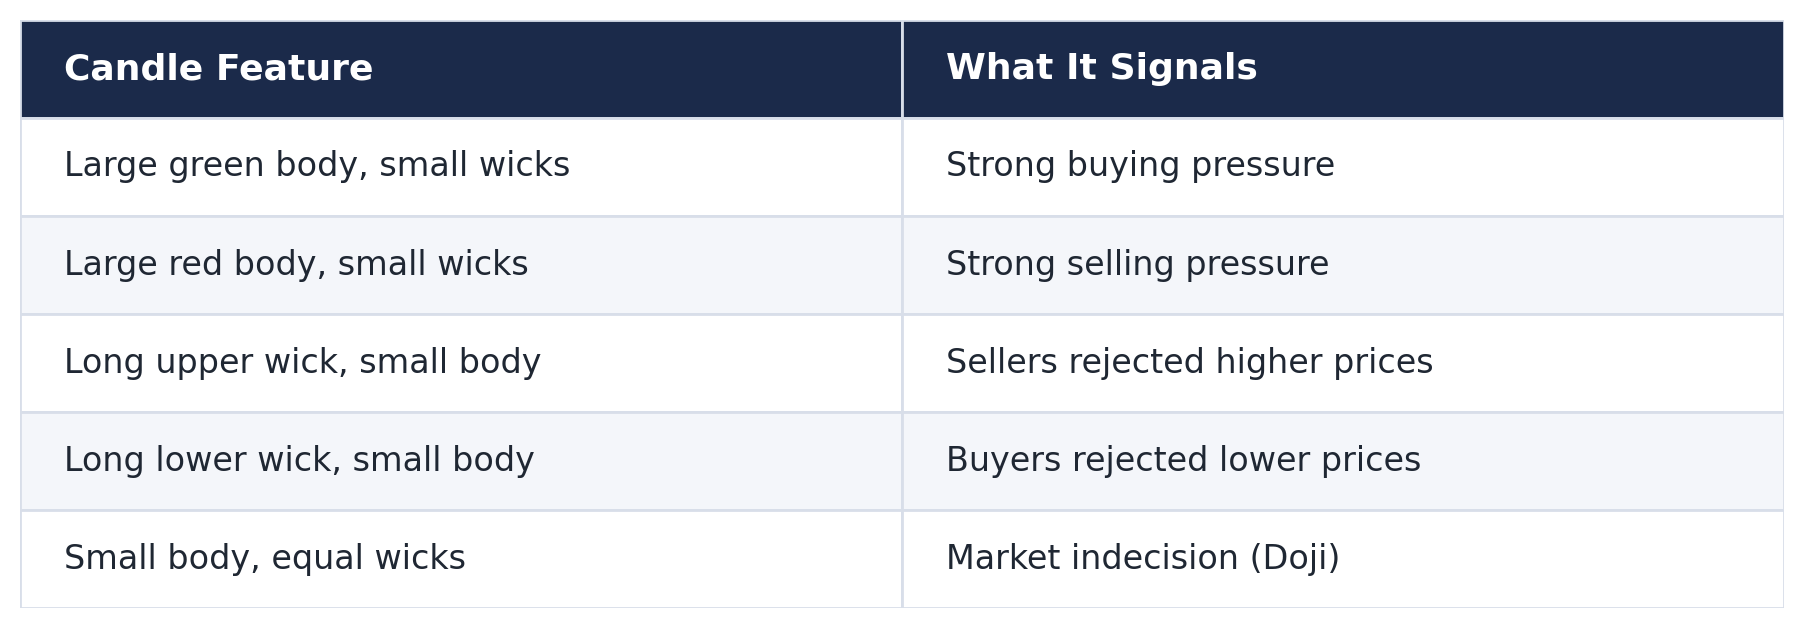
Always start the chart analysis by reading the last 5 to 10 candles individually. Before identifying any pattern, you need to know who controlled the most recent sessions and whether momentum is beginning to shift.
The Most Reliable Bullish Candle Patterns
Bullish candle patterns appear at the end of downtrends or at strong support zones. They signal that sellers are losing control and buyers are beginning to step in.
The key patterns to master are:
- Hammer
- Bullish Engulfing
- Piercing Line
- Morning Star
- Inverted Hammer
The Hammer
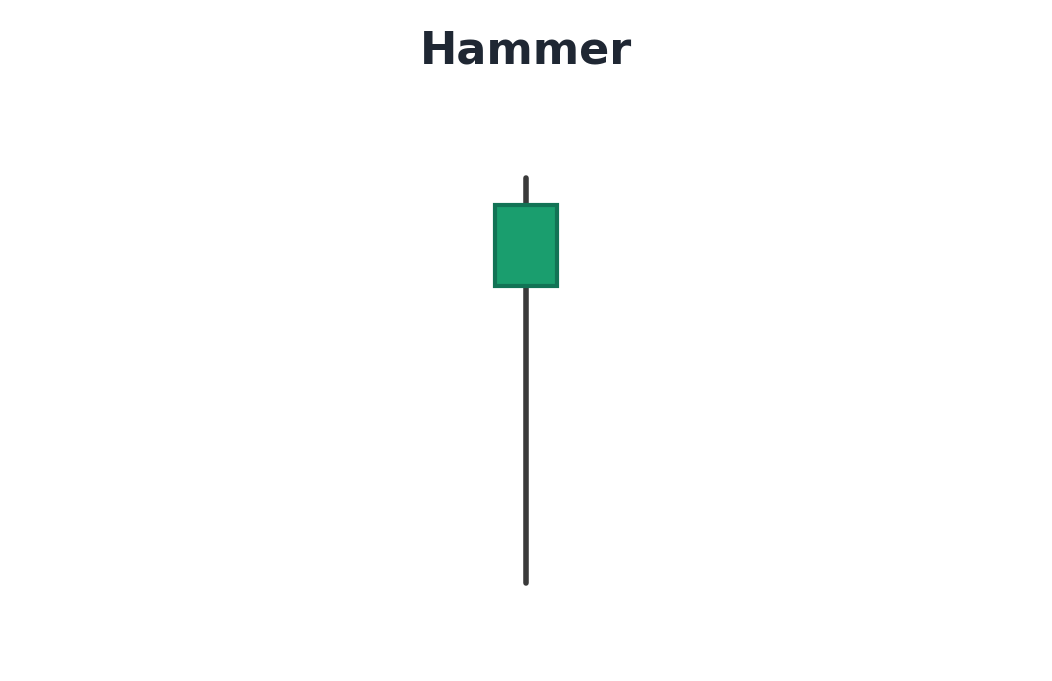
The Hammer is a single-candle reversal pattern with a small body near the top of its range and a long lower wick at least twice the body length. It forms after a downtrend.
Sellers pushed price down hard during the session, but buyers rejected the lower prices and drove price back up near the open. The long lower wick is direct evidence of strong buying pressure at that level.
Location matters more than the shape itself. A Hammer at a major weekly support level or a 61.8% Fibonacci retracement is a high-probability setup. A Hammer floating in the middle of a consolidation range tells you nothing useful.
The Bullish Engulfing Pattern
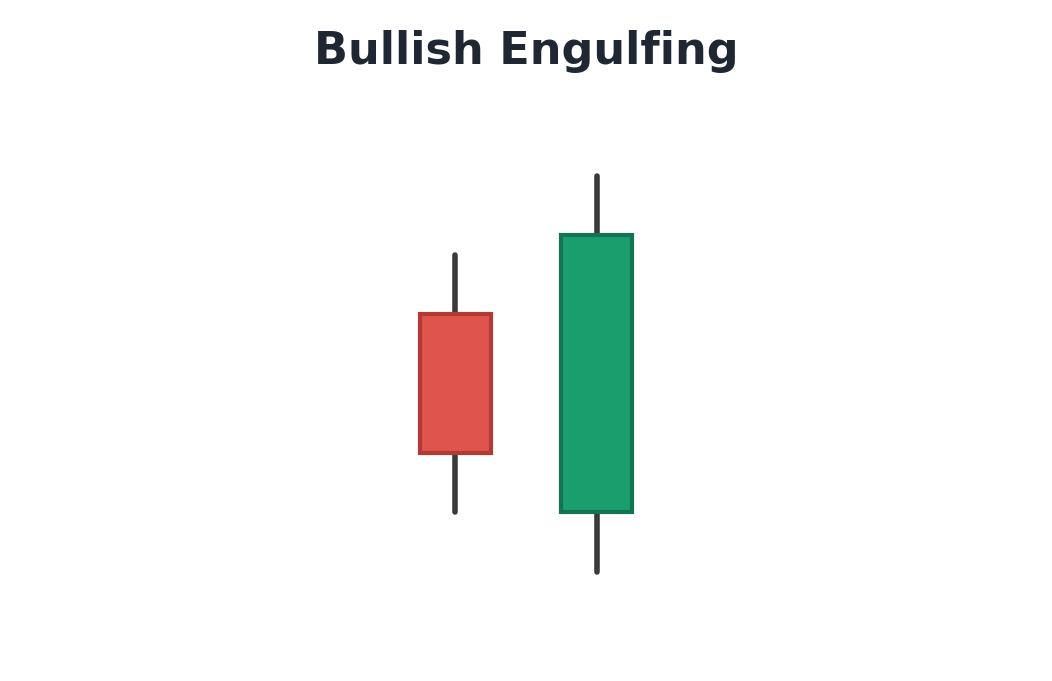
The Bullish Engulfing is a two-candle pattern. The first candle is bearish. The second candle opens below the first candle’s close and closes above the first candle’s open, completely engulfing the prior candle’s body.
This pattern signals aggressive buying pressure entering the market after a period of seller control. The engulfing candle needs to be noticeably larger than the candle it covers. A marginally larger close does not count as a genuine engulfing.
Bullish Engulfing patterns at daily support levels after extended downtrends tend to be among the higher-probability entries available to retail traders. The pattern proves buyers stepped in with conviction, not just a temporary bounce.
The Piercing Line
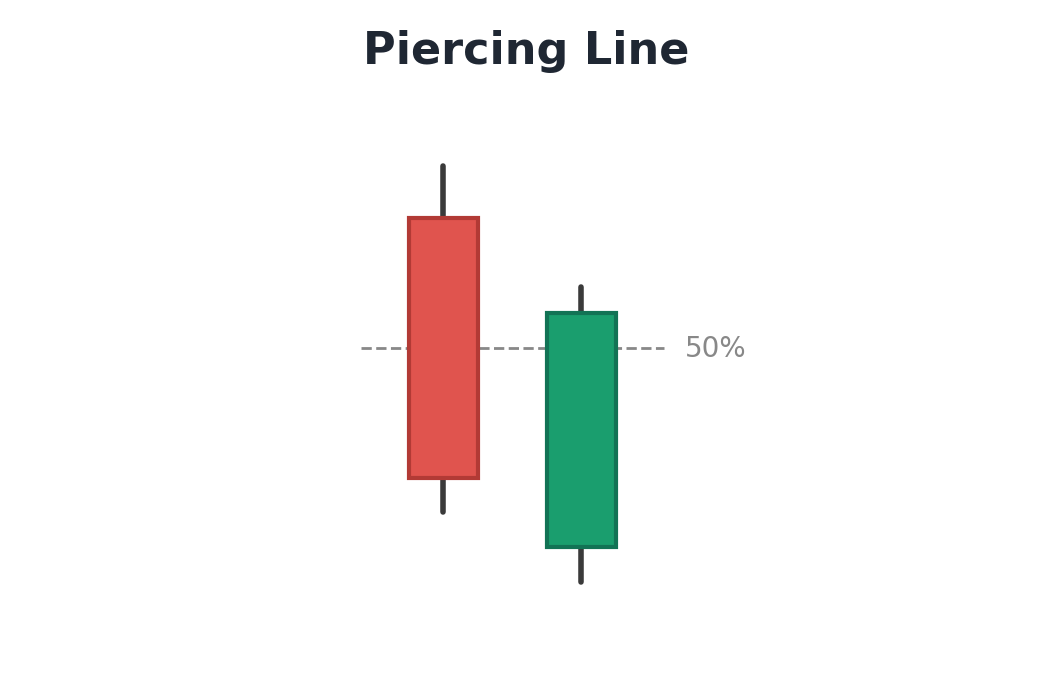
The Piercing Line is a two-candle pattern. A strong bearish candle forms first. The next candle opens below the prior candle’s low but closes above the 50% midpoint of the first candle’s body.
The critical rule: the second candle must close above the halfway point of the first candle. Anything less is not a Piercing Line and should be ignored as a signal.
When the rule is met, it signals meaningful buying pressure entering after a strong downward push. It is less powerful than a full Bullish Engulfing but still carries structural weight at the right location.
The Morning Star
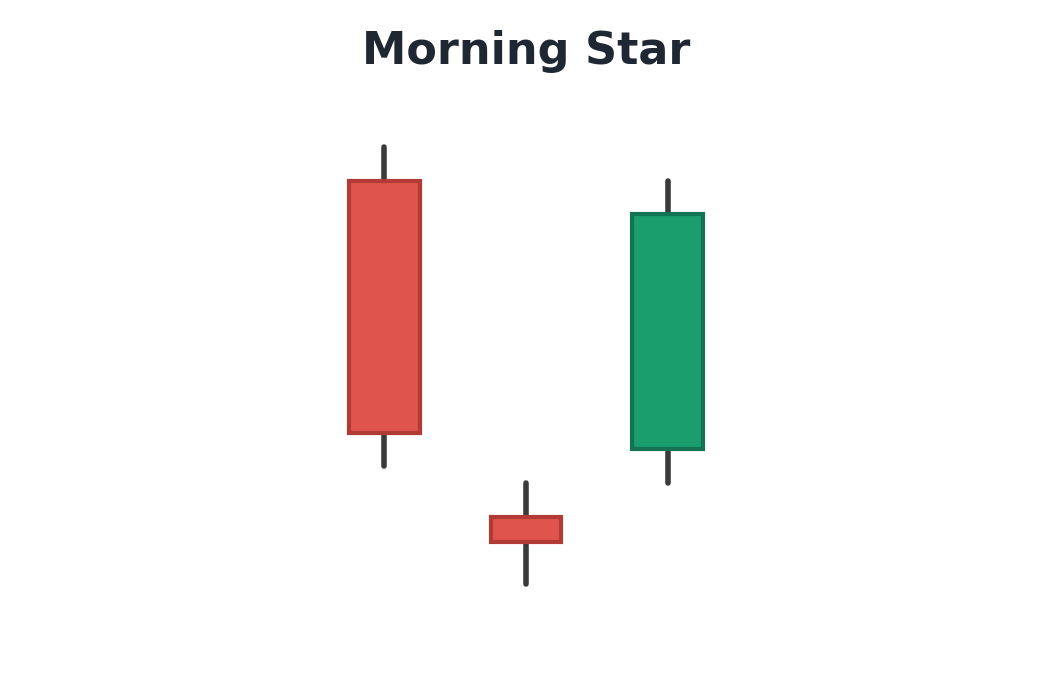
The Morning Star is a three-candle pattern and one of the most powerful reversal signals in forex trading.
1. A large bearish candle forms, showing strong selling pressure
2. A small-bodied candle (the “star”) forms near the low, showing indecision
3. A large bullish candle closes well into the body of the first candle, confirming buyer control
The middle candle shows indecision at a key level. The third candle confirms buyers have decisively taken over. This pattern is most reliable on the daily chart at major support areas, where the setups are cleanest.
The Inverted Hammer
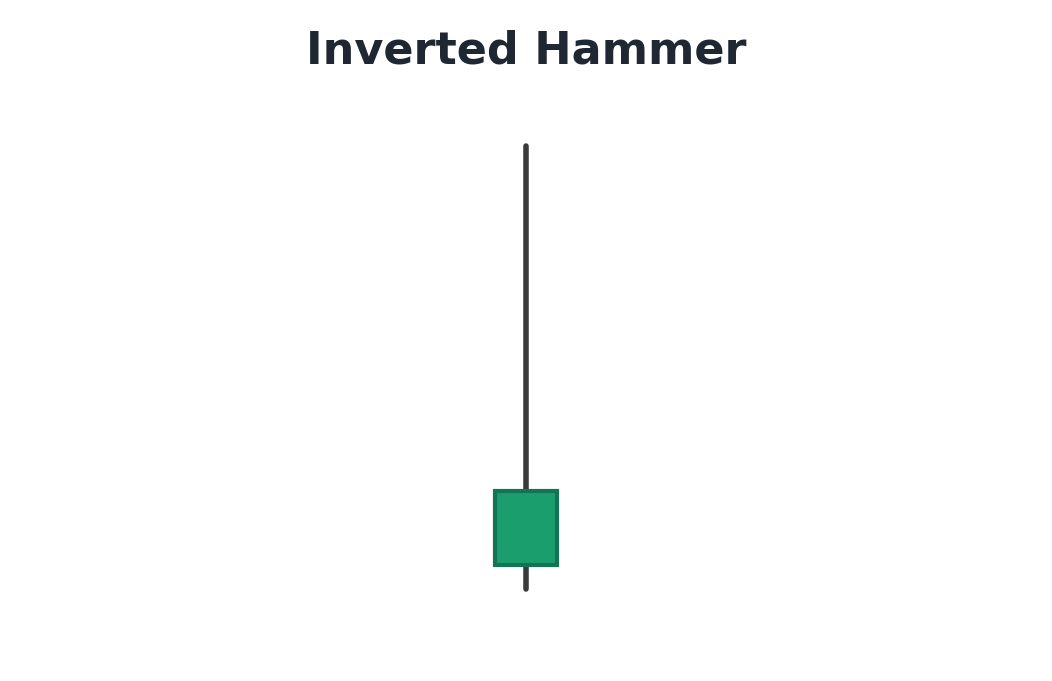
The Inverted Hammer has a small body near the bottom of its range and a long upper wick. It appears after a downtrend and signals that buyers tested higher prices. Sellers pushed back but could not drive price below the open.
Unlike the Shooting Star (which is bearish), the Inverted Hammer requires confirmation. The following candle must close bullishly to validate the signal. Without that confirmation, this pattern should not be traded in isolation.
The Most Reliable Bearish Candle Patterns
Bearish candle patterns appear at the end of uptrends or at strong resistance zones. They signal that buying momentum is exhausting and sellers are starting to take control.
The key patterns to master are:
- Shooting Star
- Bearish Engulfing
- Dark Cloud Cover
- Evening Star
- Hanging Man
- Doji
The Shooting Star
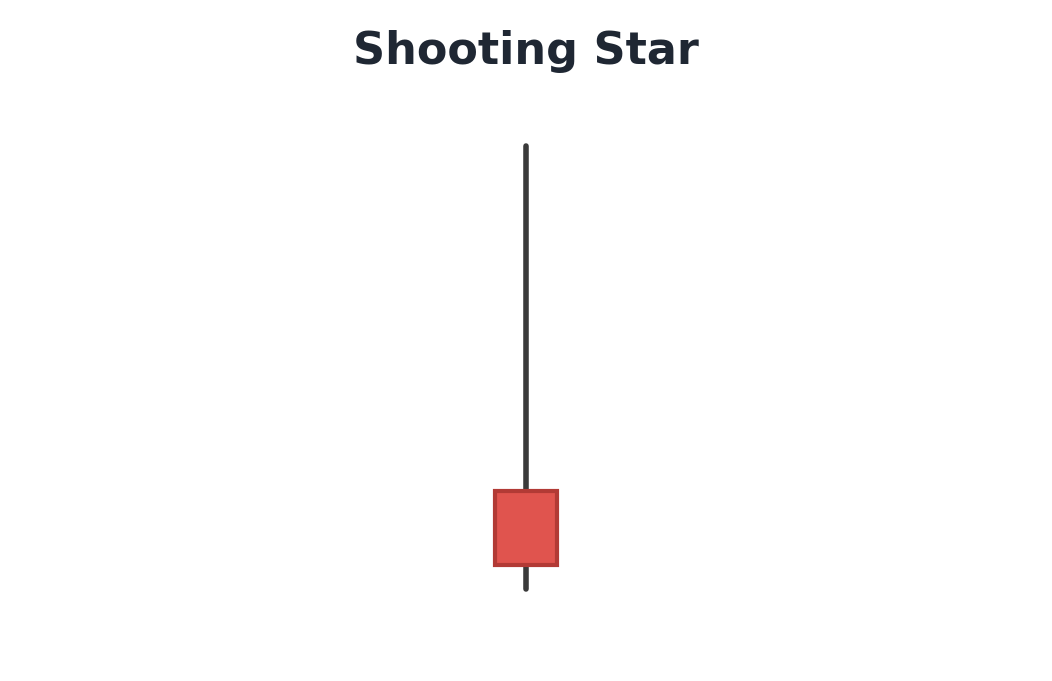
The Shooting Star is a single-candle reversal pattern with a small body near the bottom of its range and a long upper wick at least twice the body length. It forms after an uptrend.
Buyers pushed price to new highs during that session, but sellers rejected the move completely and drove price back down near the open. A red Shooting Star at a key resistance level after a series of bullish sessions is a clear warning signal.
A clean Shooting Star at weekly resistance or a major Fibonacci level carries significant weight. In isolation, at a random price level, it is just noise.
The Bearish Engulfing Pattern
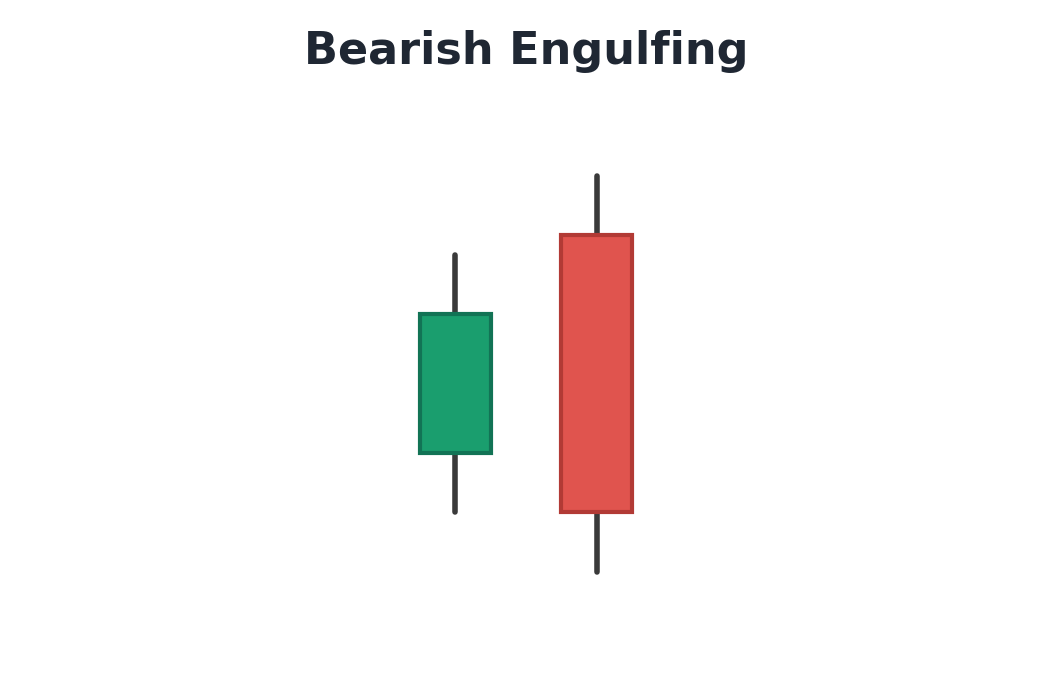
The Bearish Engulfing is the mirror image of the Bullish Engulfing. A small bullish candle forms first. The second candle opens above the prior close and closes below the prior open, completely engulfing the prior candle’s body.
This pattern at resistance confirms sellers are overpowering buyers. A Bearish Engulfing on the EUR/USD daily chart at a multi-week resistance zone is a textbook example. The location is what makes the setup valid, not the shape alone.
The Dark Cloud Cover
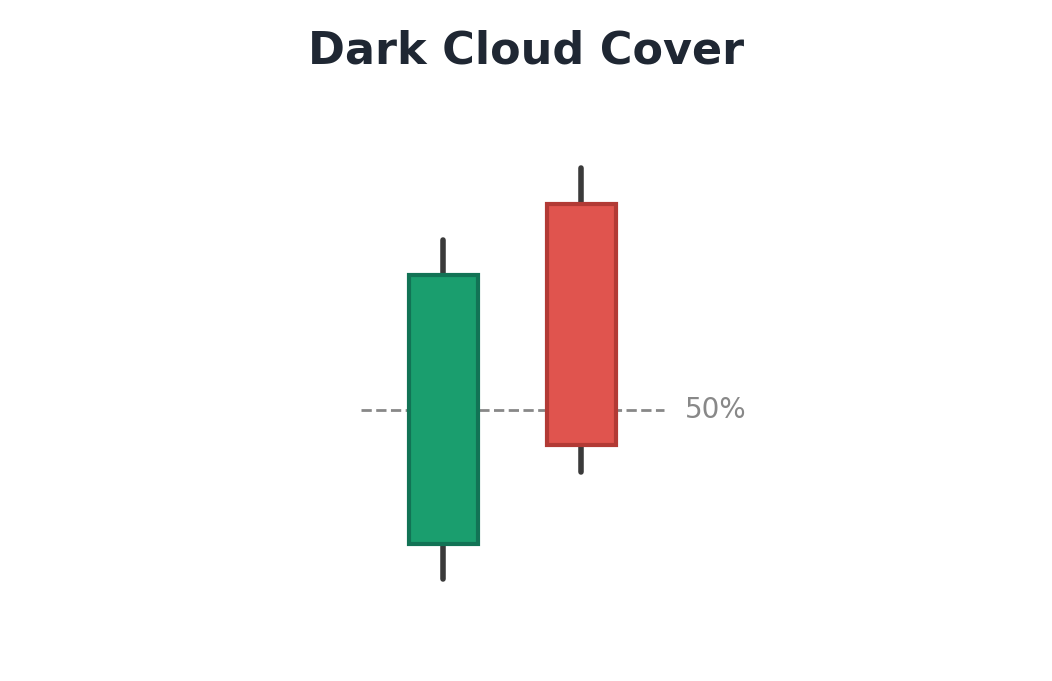
Dark Cloud Cover is the bearish counterpart to the Piercing Line. A strong bullish candle forms first. The next candle opens above the prior high but closes below the 50% midpoint of the first candle’s body.
The 50% penetration rule is mandatory. The second candle must close below the midpoint of the first candle. Without that level of penetration, the signal is too weak to act on with confidence.
The Evening Star
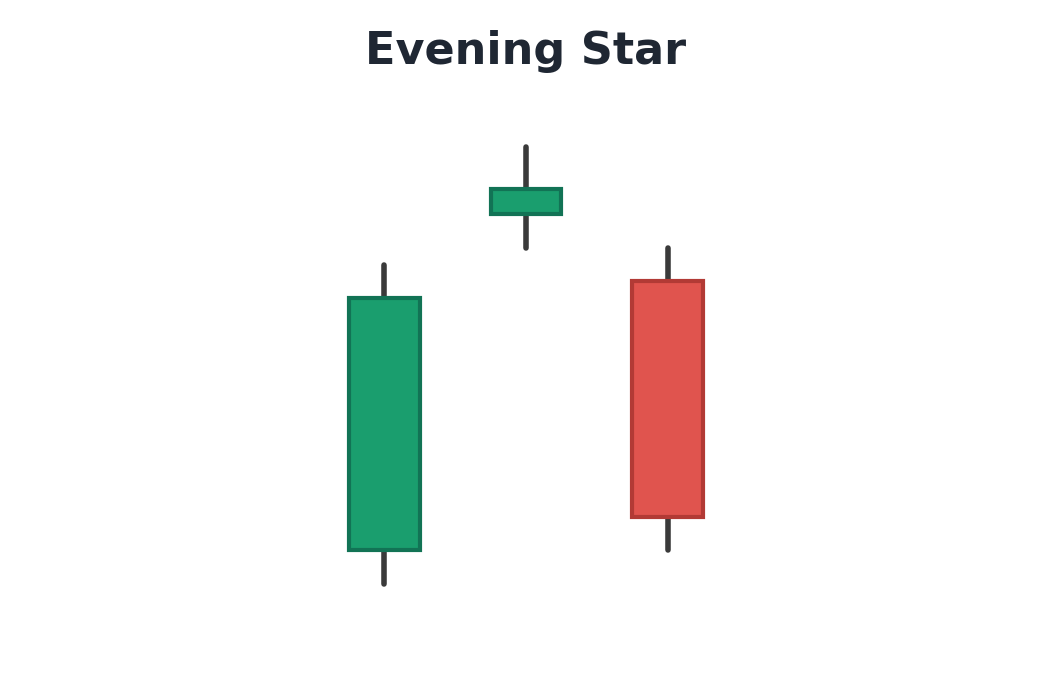
The Evening Star is a three-candle pattern and one of the most reliable bearish reversal signals in forex trading.
1. A large bullish candle forms, showing strong buying momentum
2. A small-bodied candle (the “star”) forms near the top, showing indecision
3. A large bearish candle closes well into the body of the first candle, confirming seller control
This three-candle sequence tells a clear story. Buyers drove the market up strongly. Indecision appeared at a key level. Sellers stepped in decisively and took control. When this forms at weekly resistance after a sustained uptrend, it deserves close attention
The Hanging Man
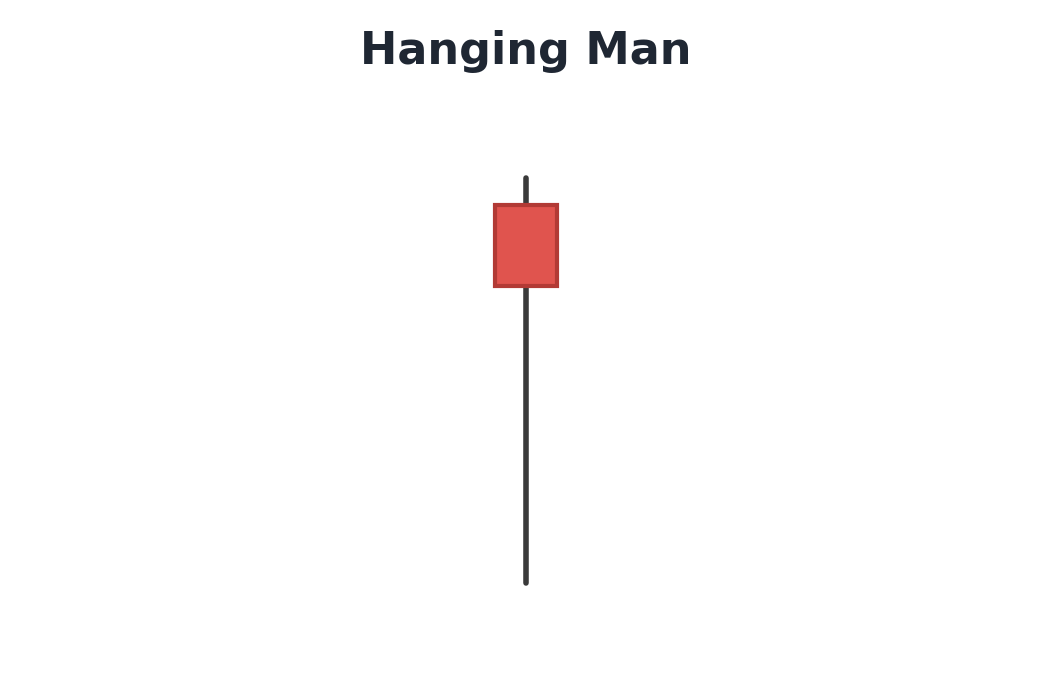
The Hanging Man is identical in shape to the Hammer: a small body near the top of the range and a long lower wick. The critical difference is context. It forms at the top of an uptrend, not the bottom of a downtrend.
The long lower wick signals that sellers are beginning to appear at those price levels. Buyers recovered by the close, but the probe lower is a warning. Always wait for bearish confirmation on the next candle before acting on a Hanging Man setup.
The Doji
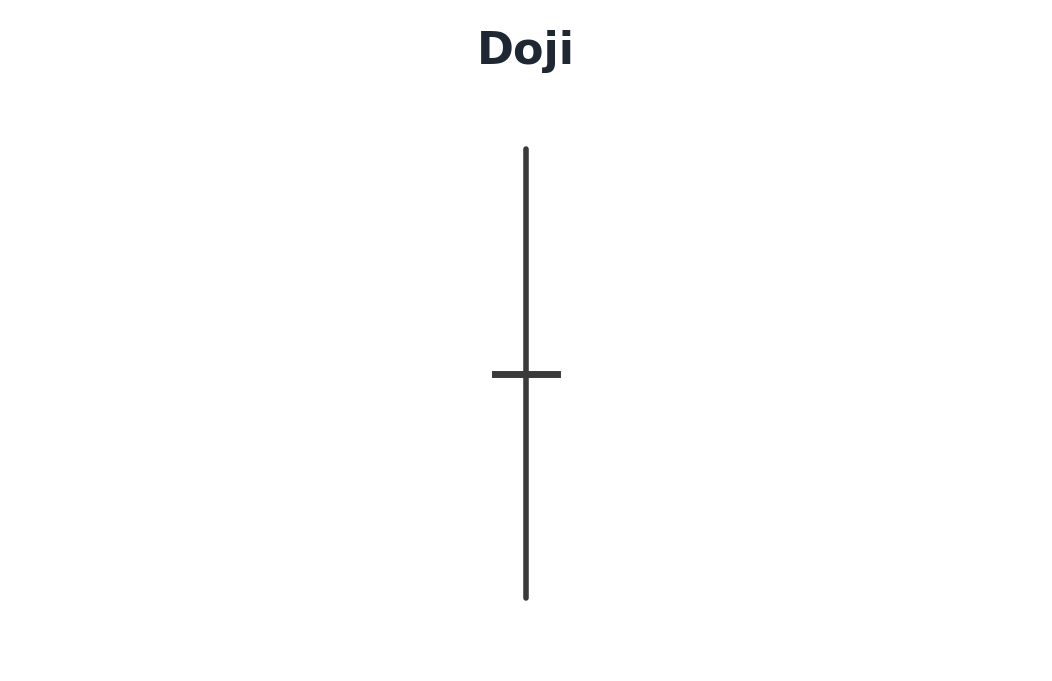
A Doji forms when price opens and closes at nearly the same level, leaving little to no body. It signals indecision, buyers and sellers fought to a standstill during that session. A Doji on its own means little. After an extended trend, at a key support or resistance level, it can be an early warning that momentum is stalling and a reversal may be near. Wait for the next candle to confirm the direction before acting.
Continuation Candle Patterns
Not every candle pattern signals a reversal. Some patterns signal the existing trend is pausing briefly before continuing in the same direction.
The Marubozu
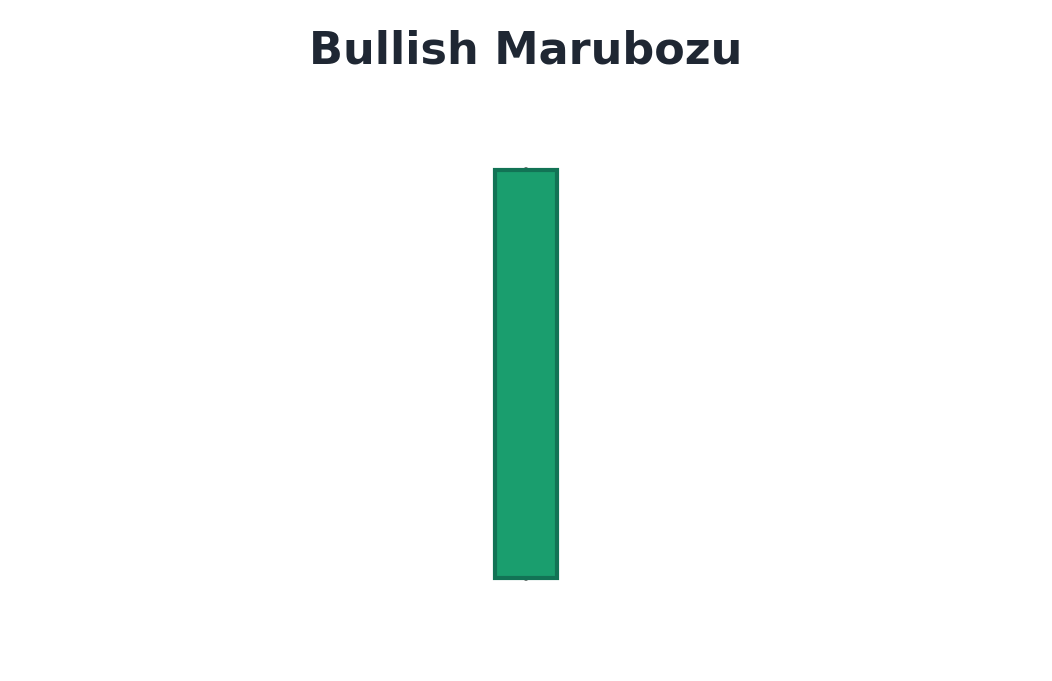
The Marubozu is a candle with little or no wicks. The price opened and closed at or very near the extreme of its range. A bullish Marubozu has no upper wick and a minimal lower wick. A bearish Marubozu has no lower wick and a minimal upper wick.
This candle shows pure one-directional conviction. Buyers (or sellers) controlled the entire session without meaningful opposition from the other side. A bullish Marubozu within an established uptrend often signals trend continuation on the next candle.
The Three White Soldiers
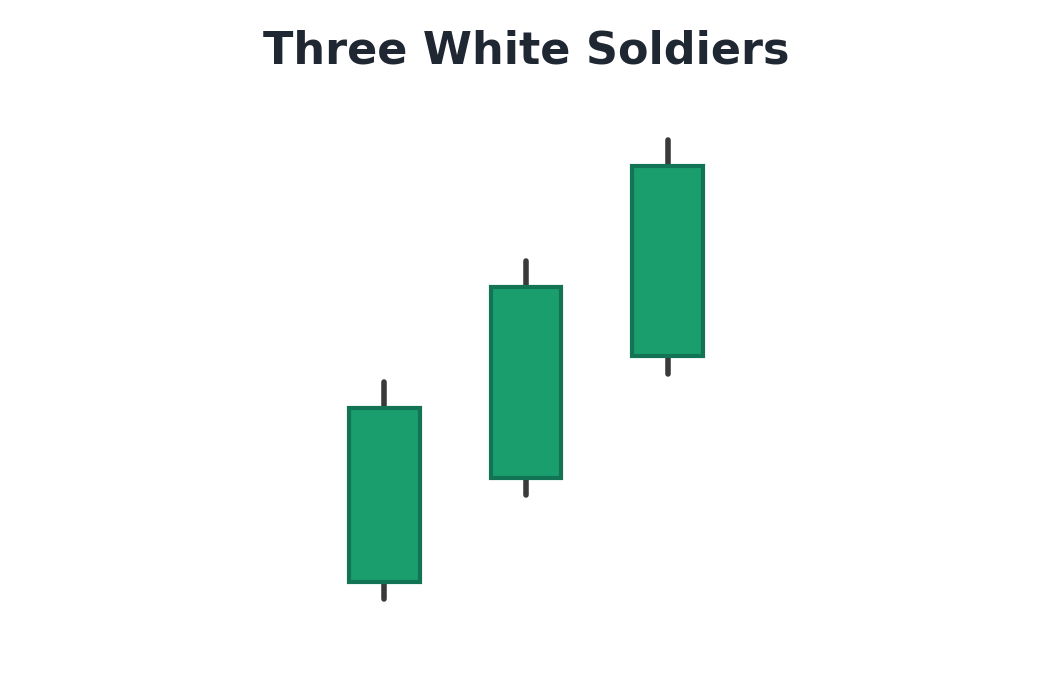
Three White Soldiers is a three-candle continuation pattern. Three consecutive bullish candles form, each opening within the prior candle’s body and closing at progressively higher prices. Small or nonexistent upper wicks confirm clean buying pressure throughout each session.
This pattern signals sustained bullish momentum. It carries the most reliability when it forms after a period of consolidation at support, not after an already extended upward move where risk-reward becomes unfavorable.
The Three Black Crows
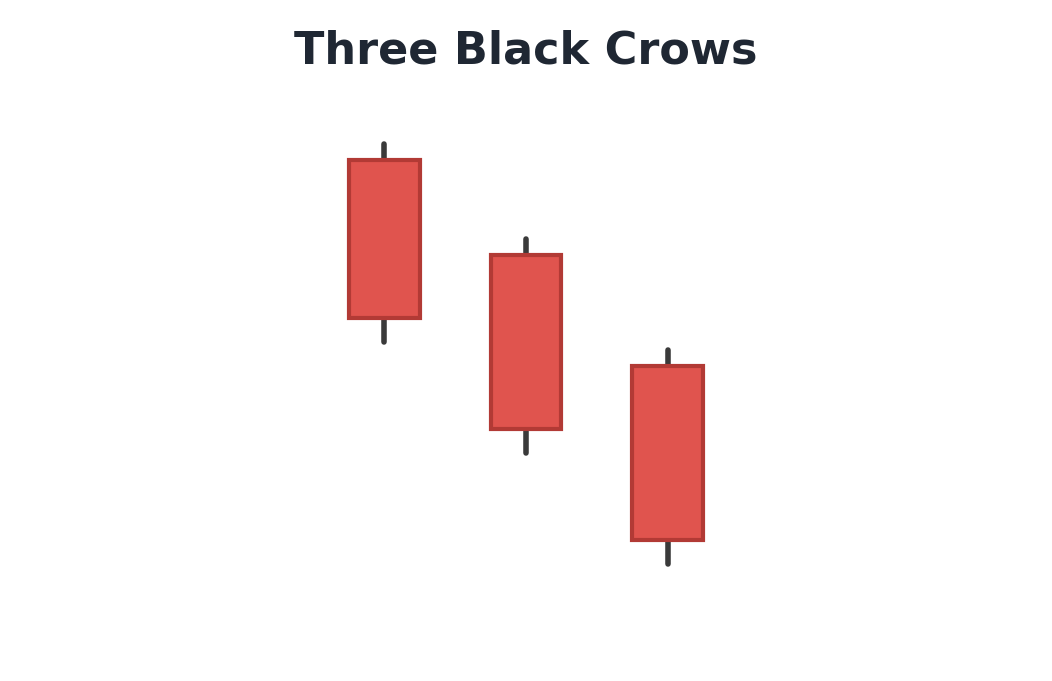
Three Black Crows is the bearish counterpart to Three White Soldiers. Three consecutive bearish candles form, each opening within the prior candle’s body and closing at new lows with minimal lower wicks.
The highest-probability application of this pattern is at a confirmed breakdown from a consolidation range or a significant support level that has just failed. Chasing it into an already extended downtrend reduces the reward available relative to the risk.
How to Trade Candle Patterns Correctly
Recognizing a pattern is the easy part. Trading it profitably requires a system built around it.
Most traders fail at candle pattern trading not because they cannot identify the patterns but because they apply them without structural context. They see a Bullish Engulfing, enter immediately, and get stopped out. The pattern was real. The location was wrong.
Here is the AFM 3-step framework for trading candle patterns:
1. Identify the trend.
Determine whether price is in an uptrend, downtrend, or range. Reversal patterns only carry weight at the end of a move. Continuation patterns only carry weight mid-trend after a controlled pullback.
2. Find the key level.
Every high-probability candle pattern setup appears at a significant support or resistance zone, a Fibonacci level, or a major moving average. The level gives the pattern its structural meaning.
3. Wait for the candle to close.
Never enter mid-candle. The pattern is only confirmed when the candle closes. A forming Shooting Star can become a bullish candle if buyers return before the session ends.
Setting Your Stop Loss
Every candle pattern entry requires a logical stop loss placement. With reversal patterns, the stop goes beyond the extreme of the pattern itself.
On a Hammer setup, it sits just below the lowest wick. A Shooting Star flips that, the stop goes just above the highest wick. A move beyond the pattern’s extreme invalidates the signal, so that is the logical invalidation point.
For continuation patterns, the stop goes below the most recent swing low in an uptrend or above the most recent swing high in a downtrend.
Setting Your Target
Target the nearest opposing level. For a Bullish Engulfing at support, target the nearest resistance. For an Evening Star at resistance, target the nearest support. Aim for a minimum 2:1 risk-to-reward ratio on every trade.
The Biggest Mistakes Traders Make with Candle Patterns
Knowing what not to do is equally as valuable as knowing the patterns themselves.
Trading Without Context
A Bullish Engulfing in the middle of a downtrend at a random price level is not a signal. It is noise. Every pattern requires a structural reason to exist at that location. Context transforms a shape into an actionable setup.
Ignoring the Timeframe
A pattern on a 1-minute chart carries far less reliability than the same pattern on a daily or 4-hour chart. Higher timeframes filter noise and reflect larger institutional moves. The core setups come primarily from the daily and 4-hour charts, the timeframes where real institutional money moves the market.
Entering Before the Candle Closes
Entering a trade while the candle is still forming is the most common mistake among newer traders. A Shooting Star forming mid-session can become a bullish candle if buying pressure returns before the close. The pattern is not confirmed until the candle closes. Full stop.
Treating Every Pattern Equally
A Bullish Engulfing that completely covers three prior bearish candles at a major weekly support level is not the same as one that barely covers a small inside candle at a random price. Read the strength of the signal, not just the shape.
The goal is not to memorize 60 patterns. The goal is to understand 6 to 8 patterns deeply enough to read the market like a story. See who is in control, wait for the evidence to point clearly in one direction, and act with conviction when it does.
Also Read: Smart Money Concepts Trading Strategy That Actually Works
Conclusion
Forex candle patterns are the language of price action. Learn to read them fluently and you will see what most traders miss.
The most reliable patterns are not the most complex ones. The Bullish Engulfing, Morning Star, Evening Star, Shooting Star, and Doji at key structural levels account for a large share of the setups that professional traders act on daily. Master these patterns in context and you have the foundation of a real trading edge.
The pattern is the evidence. The location makes it meaningful. Combine both with disciplined entry rules, a logical stop, and a realistic target and you are trading with the precision of a professional.
Frequently Asked Questions
What are the most reliable forex candle patterns?
The Bullish Engulfing, Bearish Engulfing, Morning Star, Evening Star, and Hammer are the most reliable forex candle patterns. Their effectiveness depends heavily on location. Patterns forming at significant support or resistance levels, Fibonacci zones, or key moving averages carry far more weight than patterns forming at random price points. Context is what separates a valid signal from noise.
How do I know when a candle pattern is valid?
A valid candle pattern requires three elements: the correct structure (the pattern forms as required), the right location (it forms at a significant market level), and a closed candle (the session must end before you enter). All three conditions must be present before considering an entry. Miss any one of them and the probability of success drops significantly.
Do forex candle patterns work on all timeframes?
Yes, but higher timeframes produce more reliable signals. Daily and 4-hour chart patterns filter out short-term noise and reflect more significant market participation. Patterns on 1-minute or 5-minute charts are more prone to false signals because spread costs and short-term randomness make clean pattern formation difficult to act on profitably.
What is the difference between a Hammer and a Hanging Man?
Both patterns have identical shapes: a small body near the top of the range and a long lower wick. The difference is entirely contextual. A Hammer forms at the bottom of a downtrend and signals a potential bullish reversal. A Hanging Man forms at the top of an uptrend and signals a potential bearish reversal. The same shape carries opposite meaning depending on where price is in its cycle.
Should I use candle patterns alone to make trading decisions?
No. Candle patterns work best as entry triggers within a broader trading system. They should be combined with trend analysis, key support and resistance identification, and clear risk management rules. Using a pattern in isolation without checking overall market structure significantly reduces the probability of a successful trade. The pattern confirms the decision. It should not make it.