Learn To Trade Forex • Best Forex Trading Course • AsiaForexMentor

Fibonacci Retracement Forex Trading Guide 2026

Written by

Ezekiel Chew

Updated on

August 4, 2026

i
Its a default text

Fibonacci Retracement Forex Trading Guide 2026

Written by:

Last updated on:

August 4, 2026

Most traders who use fibonacci retracement anchor the tool to the wrong swing points, then treat every level the chart produces as a valid trade signal.

ABOUT THIS GUIDE

This guide covers how to draw fibonacci retracement correctly on a real forex chart, which levels carry genuine weight, and the confluence rules that turn a fib line into a high-probability zone. It closes with a step-by-step entry, stop, and target method plus the common mistakes that cause false entries.


QUICK ANSWER

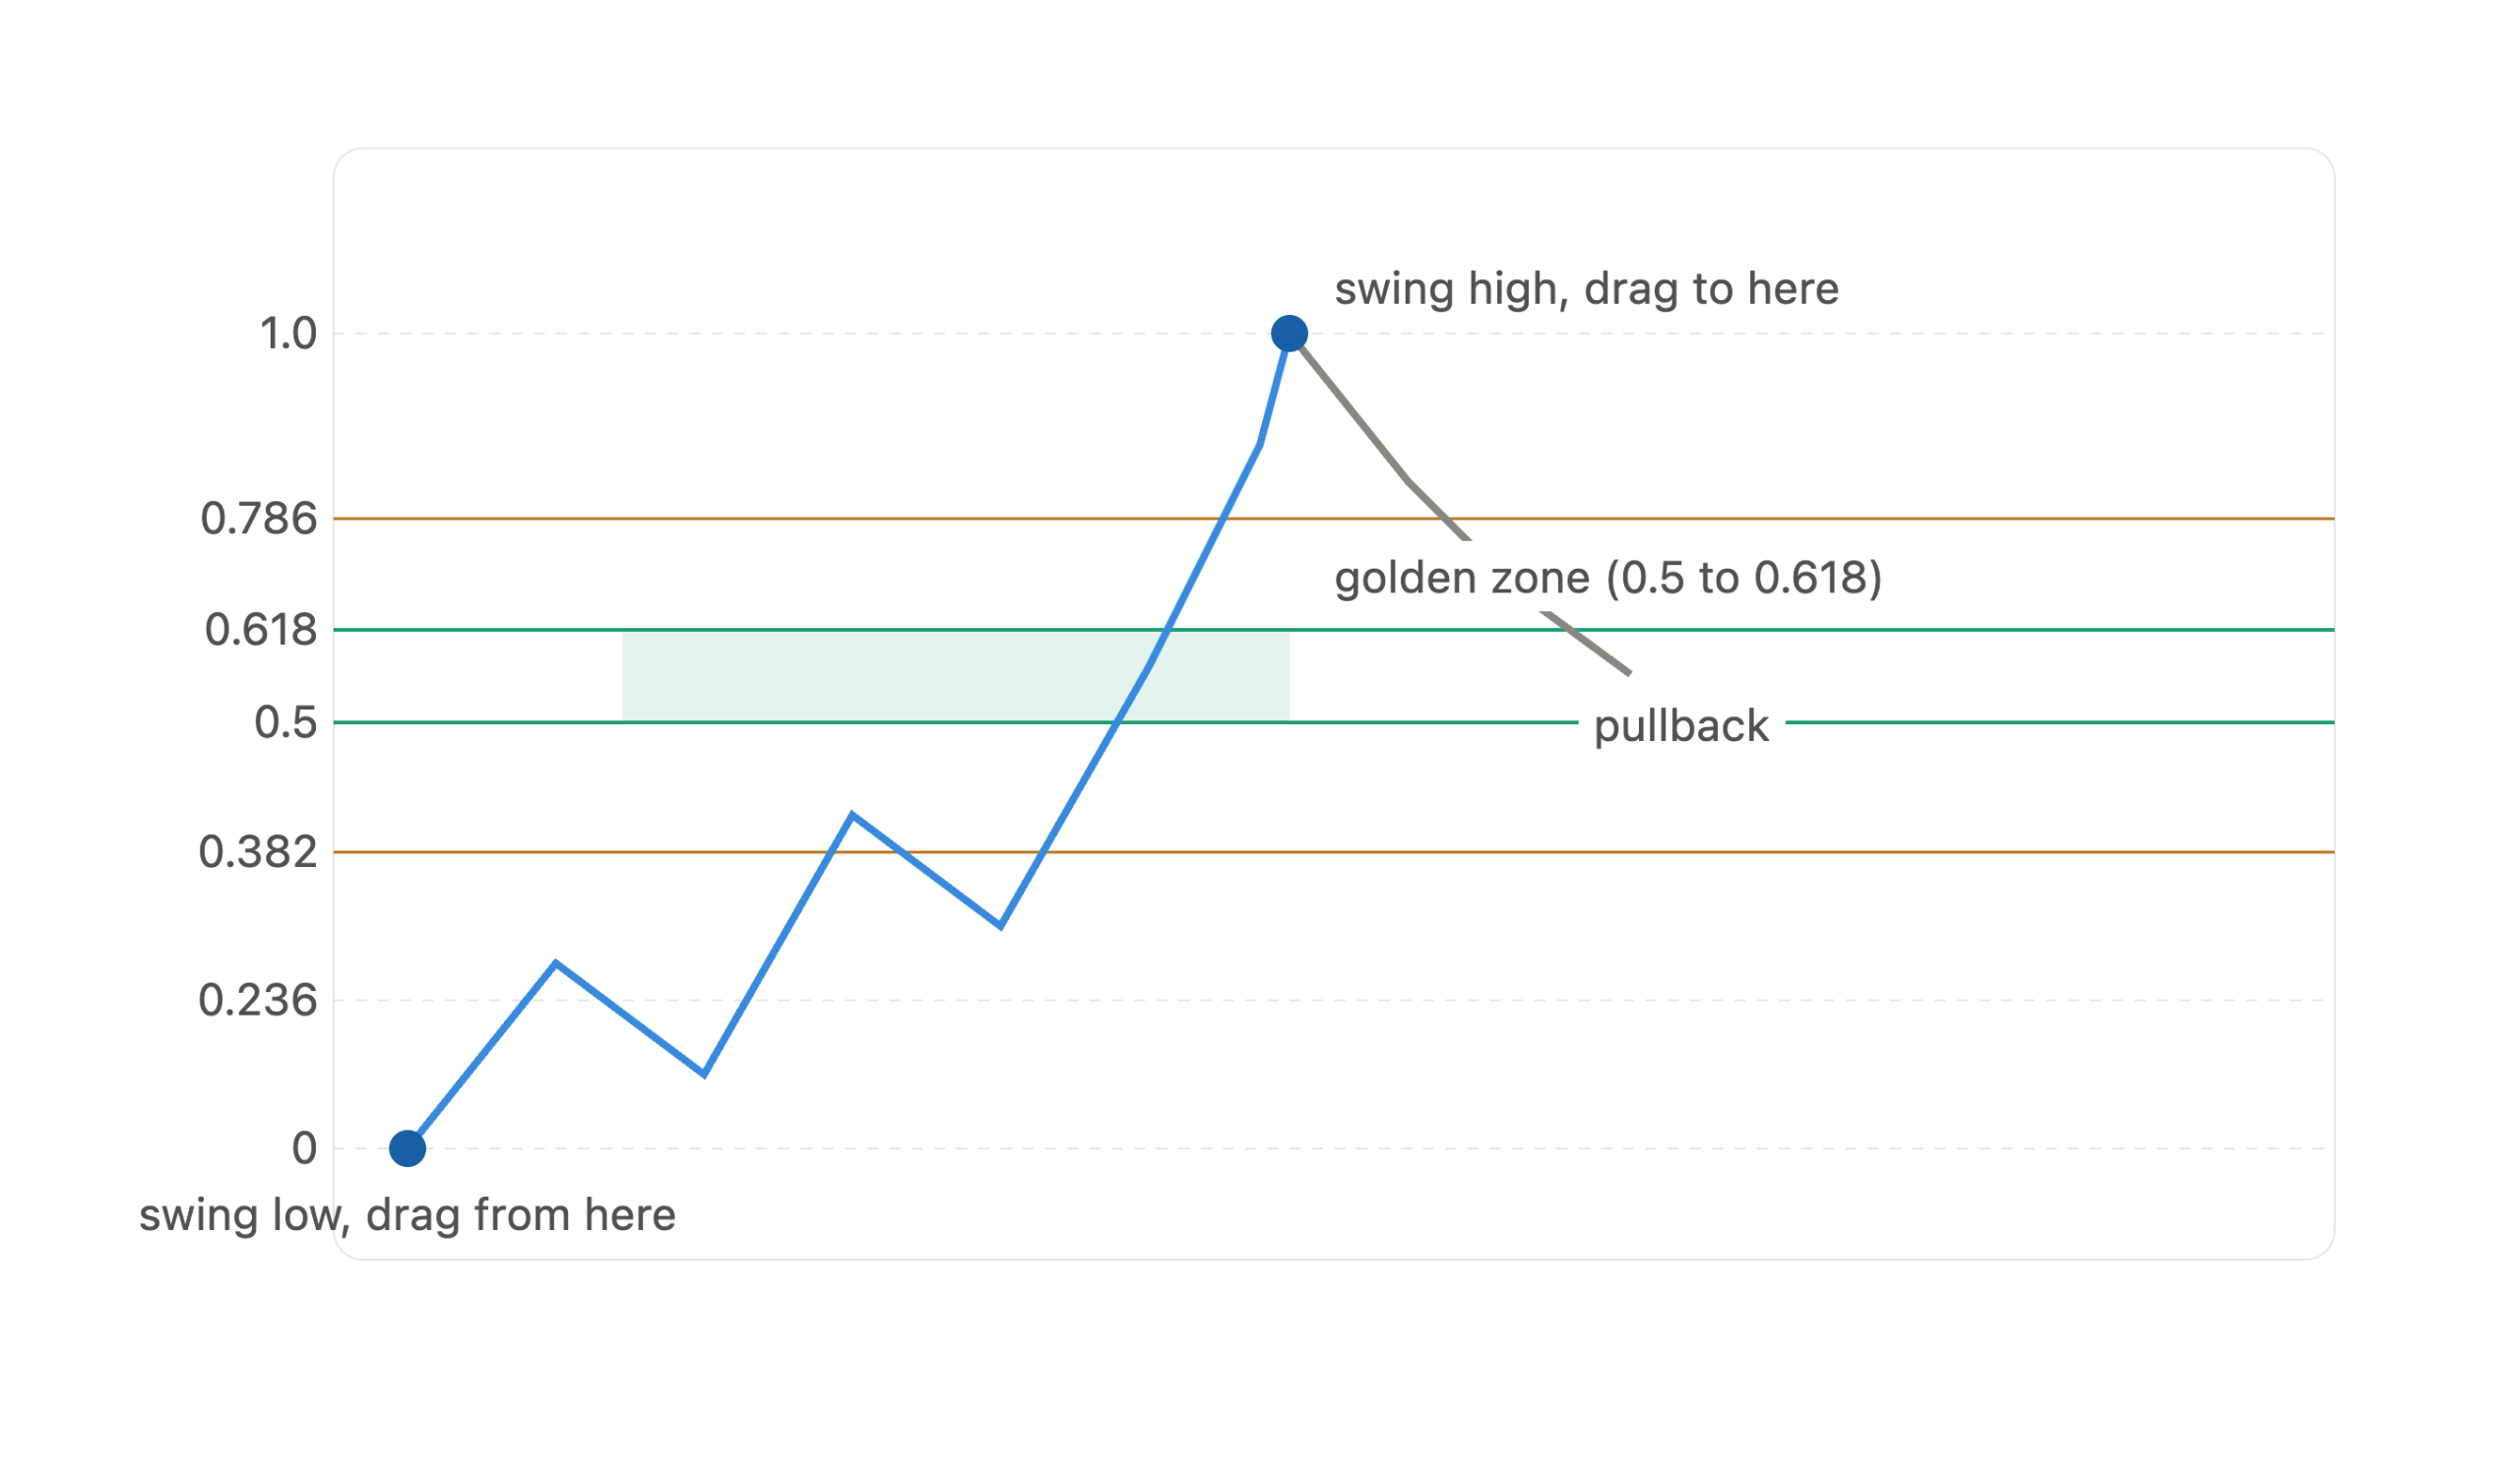
Fibonacci retracement is a technical tool that marks potential support and resistance levels within a price pullback. It divides a prior swing move into horizontal lines at 0.236, 0.382, 0.5, 0.618, and 0.786. The 0.618 and 0.5 levels carry the most weight in forex. These levels work best when they align with at least one other independent technical factor.

What Fibonacci Retracement Is and Why Most Traders Get It Wrong

The fibonacci sequence was documented by the Italian mathematician Leonardo Fibonacci in the 13th century. The sequence runs as follows: 0, 1, 1, 2, 3, 5, 8, 13, 21, 34, 55, 89, and so on. Each number is the sum of the two that come before it. Divide any number in the sequence by the one that follows it and the result approaches 0.618. This ratio, known as the golden ratio, appears throughout nature, architecture, and financial markets.

In forex, fibonacci retracement is applied after a clear, measurable price swing. The tool measures that swing and draws horizontal lines at specific mathematical ratios of its total distance. Traders use these lines to anticipate where a pullback may stall before the original trend resumes. The tool does not predict price. It marks zones where demand or supply has historically emerged at mathematically significant points.

The reason most traders struggle with this tool comes down to one error. They apply fibonacci retracement and then act on any level price touches, without requiring any additional technical confirmation. A fib level in isolation is just a horizontal line. It carries no edge on its own. The edge comes when that level coincides with at least one other independent factor. Without that second factor, a fibonacci level is noise.

The Five Fibonacci Retracement Levels Explained

The standard fibonacci retracement tool plots five levels between a swing high and a swing low. Each level represents a different percentage of the original move. Here is what each one means and how much weight it carries in a real forex context:

Level Type What It Signals in Forex Priority
0.236 (23.6%) True Fibonacci ratio Shallow pullback in a strong trend Low
0.382 (38.2%) True Fibonacci ratio Moderate retracement in a healthy trend Medium
0.500 (50%) Derived from Dow Theory Midpoint retracement, widely watched High
0.618 (61.8%) The golden ratio Deep retracement, strongest single level Highest
0.786 (78.6%) Square root of 0.618 Very deep pullback, last line before trend failure Medium

The 0.5 level deserves a note. It is not a true fibonacci ratio. It appears in most charting platforms because of its history in Dow Theory, where the midpoint of a move was treated as a natural equilibrium zone. In practice it behaves like a genuine fibonacci level because of its widespread use among traders worldwide.

The 0.786 level sits very close to the original swing point. A pullback that reaches 0.786 is testing the structural integrity of the entire prior move. If price holds there and reverses, the signal is valid. If price closes through it, the original swing is likely being redrawn and the trade idea is invalid.

The 0.236 level is the weakest of the five. It appears on strong trending moves but offers very little room for a logical stop loss. Entries at 0.236 tend to produce unfavorable risk-to-reward ratios and a higher rate of false signals. Most experienced traders skip it unless it coincides with a major horizontal level on a higher timeframe.

How to Draw Fibonacci Retracement Correctly on a Forex Chart

Getting the anchor points right is the foundation of the entire tool. An incorrect anchor produces incorrect levels, and no amount of confluence analysis fixes a badly drawn fibonacci.

  • In an uptrend: drag the fibonacci retracement tool from the most recent significant swing low to the most recent significant swing high. The 0 mark anchors at the swing low and the 1.0 mark anchors at the swing high. Retracement levels appear between those two points, representing pullback zones within the upswing.
  • In a downtrend: drag from the most recent significant swing high to the most recent significant swing low. The 0 mark anchors at the swing high and the 1.0 mark anchors at the swing low. Retracement levels now appear within the upward pullback zone.

The word significant carries real weight here. The swing points must be clearly visible price structures on the working timeframe. Using minor wicks instead of confirmed swing bodies introduces error into every level the tool draws. When the anchor points are ambiguous, move up one timeframe and identify the swing that is obvious and uncontested.

Three additional rules govern correct drawing:

  1. Use the same timeframe for both anchor points. Mixing a daily swing high with an hourly swing low produces inaccurate levels that do not reflect any single market structure.
  2. Only draw fibonacci retracement on a move with a clear start and a clear end. A sideways, choppy range has no valid directional swing to measure.
  3. Redraw the tool when a new, larger swing replaces the one you measured. Fibonacci levels from an old, superseded swing carry no current market significance.

Which Fibonacci Retracement Levels to Prioritize
Not every level on the chart deserves the same attention. These are the tiers that experienced forex traders use to organize the levels by importance.

The 0.618 Level

The 0.618 is the golden ratio and the single most important fibonacci retracement level in forex. It is the point where the mathematical relationship between consecutive fibonacci numbers converges most precisely. In a healthy, structured trend, price frequently returns to the 0.618 before continuing in the original direction. Institutional traders watch this level, which means it tends to be self-fulfilling when the broader trend is intact.

A pullback to the 0.618 tells a trader that sellers (in an uptrend) or buyers (in a downtrend) have absorbed roughly 61.8% of the prior move. That is a deep enough correction to shake out weak hands while still leaving the original trend intact. The 0.618 is where the highest-quality fibonacci setups tend to form.

The 0.5 Level

The 0.5 is the second priority. It marks the midpoint of the prior swing and carries weight because of its broad recognition across trading communities and institutions. When price retraces exactly to the 50% level, it is often the clearest test of whether buyers or sellers retain control of the trend.

When the 0.5 and 0.618 sit close together, the zone between them frequently acts as a concentrated demand or supply area. This “golden zone” between 50% and 61.8% is the area that consistent fibonacci traders target most aggressively.

The 0.382 Level

The 0.382 level matters most in very strong trending markets. When momentum is high and a trend is moving with force, price often does not give traders a deep pullback opportunity. A retracement to 0.382 in a strong trend can mark a high-probability continuation zone, particularly when combined with a clear candlestick signal.

Outside of a strong trend context, the 0.382 on its own carries limited weight. Treat it as relevant only when an additional technical factor confirms it.

The 0.236 and 0.786 Levels

These are the lowest priority for most setups. The 0.236 does not offer enough room for a sensible stop loss and tends to produce more false entries than valid ones. The 0.786 is structurally valid but sits so close to the original swing point that a stop placed beyond it often exposes excessive capital relative to potential reward. Use these levels as context rather than primary entry triggers.

Fibonacci Confluence and the Rule That Filters Signal from Noise

A fibonacci retracement level on its own carries no statistical edge. The edge comes from confluence. Confluence means the fib level aligns with at least one other independent technical factor at the same price zone. These are the four most reliable confluence combinations in forex trading.

Fib Level Plus Horizontal Support or Resistance

When the 0.618 sits on a prior swing high that has now flipped to support, two independent technical factors are marking the same price. This is the cleanest confluence setup available. The prior swing high already proved that buyers acted at that price. The fibonacci level says the current pullback has reached a natural mathematical boundary at the same point. These two factors together produce a zone with a genuine reason to hold.

Supply and demand zones often provide the strongest horizontal confirmation for fibonacci levels. A well-drawn demand zone that aligns with the 0.618 creates a setup where institutional order flow and fibonacci mathematics are pointing at the same location.

Fib Level Plus a Trendline

A rising trendline connecting a sequence of higher lows can intersect a fibonacci retracement level as the pullback deepens. When the trendline and the 0.618 or 0.5 converge at the same price, the zone strengthens significantly. The trendline represents dynamic support. The fib level represents static support derived from the swing structure. Both factors say price should find buyers at that zone.

This combination works particularly well on the four-hour and daily timeframes in forex, where trendlines tend to reflect genuine institutional positioning rather than random noise.

Fib Level Plus a Moving Average

The 20-period, 50-period, and 200-period moving averages are widely tracked by institutional participants. When a pullback brings price to the 0.618 and that level coincides with the 50-period moving average on the same timeframe, two types of market participants are watching the same zone. The fibonacci level attracts traders running fib-based strategies. The moving average attracts traders and algorithms tracking dynamic trend support. That combination produces fewer false entries than either factor alone.

Fib Level Plus a Candlestick Reversal Signal

Confluence does not always come from additional price levels or indicators. It can come from price behavior itself at the fib level. A bullish pin bar, a bullish engulfing candle, or a morning star pattern forming at the 0.618 tells a trader that price has tested the zone and sellers could not hold it. The candlestick signal provides both a structural reason to trade and a precise, low-risk entry point.

Reversal candlestick patterns at fibonacci zones produce some of the cleanest risk-to-reward setups available in forex. A single reversal candle closing within the confluence zone is often enough for a qualified entry, provided the trend direction is clear and the stop placement is logical.

The rule is this: require at least two independent factors to confirm before entering a fibonacci retracement trade. One factor is a line on a chart. Two factors are a zone with a reason to hold.

How to Trade Fibonacci Retracement Step by Step

Here is the structured framework for building a fibonacci retracement trade in forex. Each step must be completed before moving to the next. Skipping steps is the source of most false entries.

Step 1 — Confirm the Trend Direction

Only trade fibonacci retracement in the direction of the larger trend. Identify whether the market is forming higher highs and higher lows, or lower highs and lower lows. Use the daily or four-hour chart to confirm the dominant trend before dropping to your entry timeframe. Countertrend fibonacci setups carry significantly lower probability and require stricter criteria.

Step 2 — Identify the Measurable Swing

Find the most recent clear swing move in the direction of the trend. This is the distance you will measure with the fibonacci tool. Both the start and end of the swing must be unambiguous. If you need to debate where the swing begins or ends, it is not a clean enough structure to use.

Step 3 — Draw the Fibonacci Retracement

Apply the tool from swing low to swing high in an uptrend, or from swing high to swing low in a downtrend. Verify that the 0 mark anchors at your first reference point and the 1.0 mark at your second. Check that the levels plot cleanly across the retracement zone.

Step 4 — Locate the Confluence Zone

Look at the 0.5 and 0.618 levels first. Check whether any horizontal support or resistance, an active trendline, or a key moving average aligns with either level. If confluence exists, mark that zone on your chart. If no confluence exists at these levels, do not force a trade. Not every fibonacci drawing produces a tradeable setup.

Step 5 — Wait for a Candlestick Signal

Price entering the confluence zone is not an entry trigger. Wait for a reversal candlestick to close within or immediately adjacent to the zone. The most reliable signals include pin bars, engulfing candles, and inside bars with a subsequent breakout. This single step removes the majority of false entries from a fibonacci trading approach.

Step 6 — Enter, Place the Stop, and Set the Target

Enter at the open of the candle following the confirmed reversal signal. Place the stop loss just beyond the 0.786 level or just beyond the original swing point, whichever is farther from the entry. For targets, use the opposing swing point as the first objective. Fibonacci extension levels at 1.272 and 1.618 of the original swing serve as secondary targets when the setup has strong momentum behind it.

Require a minimum risk-to-reward ratio of 1:2 before entering. If the stop placement relative to the confluence zone does not produce at least two units of potential reward for every unit of risk, the setup does not qualify.

What a Qualified Fibonacci Trade Looks Like

Before taking any fibonacci retracement trade, verify all five of the following:

  • The setup runs with the higher-timeframe trend.
  • Price is pulling back to the 0.5 or 0.618 of a clear, measurable swing.
  • At least one additional technical factor confirms the zone.
  • A reversal candlestick has closed at or near the confluence zone.
  • The stop beyond the swing provides a minimum 1:2 risk-to-reward ratio.

If any single criterion is missing, the trade does not qualify. Passing on a setup that does not meet the criteria is the skill. Taking every level that appears on the chart is the habit that produces consistent losses.

Understanding price action reading at the structural level is what separates a trader who uses fibonacci as a filter from one who uses it as a prediction tool.

Six Fibonacci Retracement Mistakes That Cost Traders Money

These are the six most common errors traders make with fibonacci retracement in forex. Each one has a specific fix.

Mistake 1 — Drawing on Minor Swings

The fibonacci tool is only as useful as the swing it measures. Drawing it on a one-hour minor move inside a daily downtrend produces levels that carry little structural weight. Always anchor the tool to the most significant and visible swing on the working timeframe. When in doubt, validate the swing on the next higher timeframe before using it as an anchor.

Mistake 2 — Treating Every Level as Equally Valid

Five levels appear on every fibonacci drawing. Treating all five as equally valid means a trader is always near some level, which creates overconfidence rather than precision. The 0.5 and 0.618 are the primary levels. The 0.382 is valid in strong trend contexts. The 0.236 and 0.786 require stricter confluence to justify an entry.

Mistake 3 — Entering Without Confluence

Price touching a fibonacci level is not a trade signal. It is a prompt to check for confluence. Without a second confirming factor, the probability of a sustained reversal at the level is no better than random. This single mistake accounts for more fibonacci losses than any other error.

Mistake 4 — Trading Against the Trend

Fibonacci retracement is designed as a trend continuation tool. Using it to trade countertrend reversals at the 0.786 or even the 0.618 introduces trend risk into every trade. In strongly trending markets, this approach repeatedly catches traders on the wrong side of institutional order flow.

Mistake 5 — Placing the Stop Loss Too Tight

A stop loss placed just below the 0.618 in an uptrend will be triggered by normal market volatility before price resumes higher. The stop must sit beyond the 0.786, or ideally just beyond the original swing low. Tight stops turn structurally valid setups into losing trades. Proper stop loss placement is not a secondary consideration in fibonacci trading. It is central to whether the method works at all.

Mistake 6 — Mixing Timeframes on the Anchor Points

Anchoring the swing low from a daily chart and the swing high from a 15-minute chart destroys the mathematical integrity of every level the tool draws. Each level becomes inaccurate because the tool is measuring a relationship that does not exist between those two points. Use the same timeframe for both anchor points, every time.

Conclusion

Fibonacci retracement is one of the most widely used tools in forex trading and one of the most consistently misused. The difference between a trader who extracts reliable setups from fibonacci levels and one who does not comes down to three disciplines. Draw the tool on the correct, significant swing. Require genuine confluence before treating a level as tradeable. Wait for a candlestick reversal signal before committing capital.

The 0.618 and 0.5 levels are where the edge concentrates. Pair them with at least one confirming factor from supply and demand zones, trendlines, or key moving averages. Apply the six-step framework. Respect the stop placement rules. Then let the trade either work or invalidate cleanly.

Asia Forex Mentor's free training  covers the complete confluence framework that ties fibonacci retracement into a broader trading system. It includes how fibonacci levels integrate with trend structure and institutional price action, the same methodology that has earned Asia Forex Mentor recognition from Investopedia as “Most Comprehensive Course” and from Benzinga as “Best Forex Trading Course.”

Also Read: Mastering Fibonacci Extension for Precise Exits

Frequently Asked Questions

What Is the Best Fibonacci Retracement Level to Trade?

The 0.618 level, known as the golden ratio, is the most reliable fibonacci retracement level in forex. It is the point where the mathematical ratio between consecutive fibonacci numbers converges most precisely. Price respects this level most consistently in trending markets, particularly when it coincides with a horizontal support zone, a trendline, or a key moving average. The 0.5 level is the second-strongest and is often watched alongside the 0.618 as a combined zone.

How Do You Draw Fibonacci Retracement Correctly?

In an uptrend, drag the fibonacci retracement tool from the swing low to the swing high. The 0 mark anchors at the low and the 1.0 mark at the high. In a downtrend, drag from the swing high to the swing low. Always use the most significant and clearly visible swing points on your working timeframe. Never mix anchor points from different timeframes, as this produces inaccurate levels across the entire drawing.

What Is Fibonacci Confluence and Why Does It Matter?

Fibonacci confluence means a fibonacci retracement level aligns with at least one other independent technical factor at the same price zone. Examples include a 0.618 level that sits on a prior swing high, a 0.5 level that coincides with the 50-period moving average, or a 0.618 that touches an active trendline. Two independent factors pointing at the same price zone increase the probability that price will react there. One factor is a line. Two factors are a zone with a reason to hold.

Which Timeframe Works Best for Fibonacci Retracement in Forex?

The daily and four-hour timeframes produce the most reliable fibonacci retracement levels in forex. These timeframes capture institutional order flow more effectively than shorter intervals. Lower timeframes such as the 15-minute or one-hour chart can be used to refine entries after the setup is identified on the higher timeframe. This top-down approach keeps the fibonacci analysis anchored to significant market structure while allowing precise entry timing on the lower timeframe.

Where Should the Stop Loss Go on a Fibonacci Retracement Trade?

Place the stop loss just beyond the 0.786 retracement level or just beyond the original swing point, whichever gives more distance from the entry. This placement allows the trade room to absorb normal market volatility without being stopped out on noise. Stops placed at the exact 0.618 level are too tight and frequently get hit before price resumes in the intended direction. A stop beyond the swing point is the only logical invalidation level for a fibonacci-based entry.

About Ezekiel Chew​

Ezekiel Chew, founder and head of training at Asia Forex Mentor, is a renowned forex expert, frequently invited to speak at major industry events. Known for his deep market insights, Ezekiel is one of the top traders committed to supporting the trading community. Making six figures per trade, he also trains traders working in banks, fund management, and prop trading firms.

Multiple Timeframe Analysis How Institutions Trade Forex

Most forex traders who get stopped out consistently are missing the same thing: multiple timeframe analysis. They always blindly enter trades based from the the larger market structure is doing. ABOUT THIS GUIDE This guide explains the complete multiple timeframe analysis process used by institutional forex traders. It covers why

Read More

Double Top Pattern Forex Trading Guide In 2026

The double top pattern has taken more money from traders than it has returned to them. The pattern works fine. The problem is that most traders pull the trigger before the neckline ever breaks. ABOUT THIS GUIDE This guide explains what the double top pattern is, how to identify it

Read More

Market Structure Trading Strategy That Actually Works

Market structure trading stops working the moment traders ignore location and timing. Clean analysis on the wrong side of a level produces the same outcome every time. The move starts without you, and the chart tells you exactly why, after the fact. ABOUT THIS GUIDE This guide covers three approaches

Read More

How to Stop FOMO Trading Before It Wrecks Your Account

Learning how to stop FOMO trading matters more than any strategy, because FOMO wrecks more trading accounts than bad entries, weak setups, or poor timing ever will. Most traders try to beat FOMO with willpower. They promise to stay calm. They tell themselves they will wait for the next clean

Read More

Elliott Wave Trading Explained the Right Way

Hey, what’s up guys? It’s Ezekiel Chew here. So if you ever wanted to actually understand where the market is in a cycle right now, not just about following candles, not just about reacting to breakouts, but to know whether or not are you in an impulse or are you

Read More

AFM Trading Summit Live

Date: Coming Soon

Join us at the AFM Trading Summit Live and learn from top industry experts through live trading sessions, market insights, and actionable strategies.

Fibonacci Retracement Forex Trading Guide 2026

4.0
Overall Trust Index

Written by:

Updated:

August 4, 2026
Most traders who use fibonacci retracement anchor the tool to the wrong swing points, then treat every level the chart produces as a valid trade signal.

ABOUT THIS GUIDE

This guide covers how to draw fibonacci retracement correctly on a real forex chart, which levels carry genuine weight, and the confluence rules that turn a fib line into a high-probability zone. It closes with a step-by-step entry, stop, and target method plus the common mistakes that cause false entries.
 

QUICK ANSWER

Fibonacci retracement is a technical tool that marks potential support and resistance levels within a price pullback. It divides a prior swing move into horizontal lines at 0.236, 0.382, 0.5, 0.618, and 0.786. The 0.618 and 0.5 levels carry the most weight in forex. These levels work best when they align with at least one other independent technical factor.

What Fibonacci Retracement Is and Why Most Traders Get It Wrong

The fibonacci sequence was documented by the Italian mathematician Leonardo Fibonacci in the 13th century. The sequence runs as follows: 0, 1, 1, 2, 3, 5, 8, 13, 21, 34, 55, 89, and so on. Each number is the sum of the two that come before it. Divide any number in the sequence by the one that follows it and the result approaches 0.618. This ratio, known as the golden ratio, appears throughout nature, architecture, and financial markets. In forex, fibonacci retracement is applied after a clear, measurable price swing. The tool measures that swing and draws horizontal lines at specific mathematical ratios of its total distance. Traders use these lines to anticipate where a pullback may stall before the original trend resumes. The tool does not predict price. It marks zones where demand or supply has historically emerged at mathematically significant points. The reason most traders struggle with this tool comes down to one error. They apply fibonacci retracement and then act on any level price touches, without requiring any additional technical confirmation. A fib level in isolation is just a horizontal line. It carries no edge on its own. The edge comes when that level coincides with at least one other independent factor. Without that second factor, a fibonacci level is noise.

The Five Fibonacci Retracement Levels Explained

The standard fibonacci retracement tool plots five levels between a swing high and a swing low. Each level represents a different percentage of the original move. Here is what each one means and how much weight it carries in a real forex context:
Level Type What It Signals in Forex Priority
0.236 (23.6%) True Fibonacci ratio Shallow pullback in a strong trend Low
0.382 (38.2%) True Fibonacci ratio Moderate retracement in a healthy trend Medium
0.500 (50%) Derived from Dow Theory Midpoint retracement, widely watched High
0.618 (61.8%) The golden ratio Deep retracement, strongest single level Highest
0.786 (78.6%) Square root of 0.618 Very deep pullback, last line before trend failure Medium
The 0.5 level deserves a note. It is not a true fibonacci ratio. It appears in most charting platforms because of its history in Dow Theory, where the midpoint of a move was treated as a natural equilibrium zone. In practice it behaves like a genuine fibonacci level because of its widespread use among traders worldwide. The 0.786 level sits very close to the original swing point. A pullback that reaches 0.786 is testing the structural integrity of the entire prior move. If price holds there and reverses, the signal is valid. If price closes through it, the original swing is likely being redrawn and the trade idea is invalid. The 0.236 level is the weakest of the five. It appears on strong trending moves but offers very little room for a logical stop loss. Entries at 0.236 tend to produce unfavorable risk-to-reward ratios and a higher rate of false signals. Most experienced traders skip it unless it coincides with a major horizontal level on a higher timeframe.

How to Draw Fibonacci Retracement Correctly on a Forex Chart

Getting the anchor points right is the foundation of the entire tool. An incorrect anchor produces incorrect levels, and no amount of confluence analysis fixes a badly drawn fibonacci.
  • In an uptrend: drag the fibonacci retracement tool from the most recent significant swing low to the most recent significant swing high. The 0 mark anchors at the swing low and the 1.0 mark anchors at the swing high. Retracement levels appear between those two points, representing pullback zones within the upswing.
  • In a downtrend: drag from the most recent significant swing high to the most recent significant swing low. The 0 mark anchors at the swing high and the 1.0 mark anchors at the swing low. Retracement levels now appear within the upward pullback zone.
The word significant carries real weight here. The swing points must be clearly visible price structures on the working timeframe. Using minor wicks instead of confirmed swing bodies introduces error into every level the tool draws. When the anchor points are ambiguous, move up one timeframe and identify the swing that is obvious and uncontested. Three additional rules govern correct drawing:
  1. Use the same timeframe for both anchor points. Mixing a daily swing high with an hourly swing low produces inaccurate levels that do not reflect any single market structure.
  2. Only draw fibonacci retracement on a move with a clear start and a clear end. A sideways, choppy range has no valid directional swing to measure.
  3. Redraw the tool when a new, larger swing replaces the one you measured. Fibonacci levels from an old, superseded swing carry no current market significance.

Which Fibonacci Retracement Levels to Prioritize
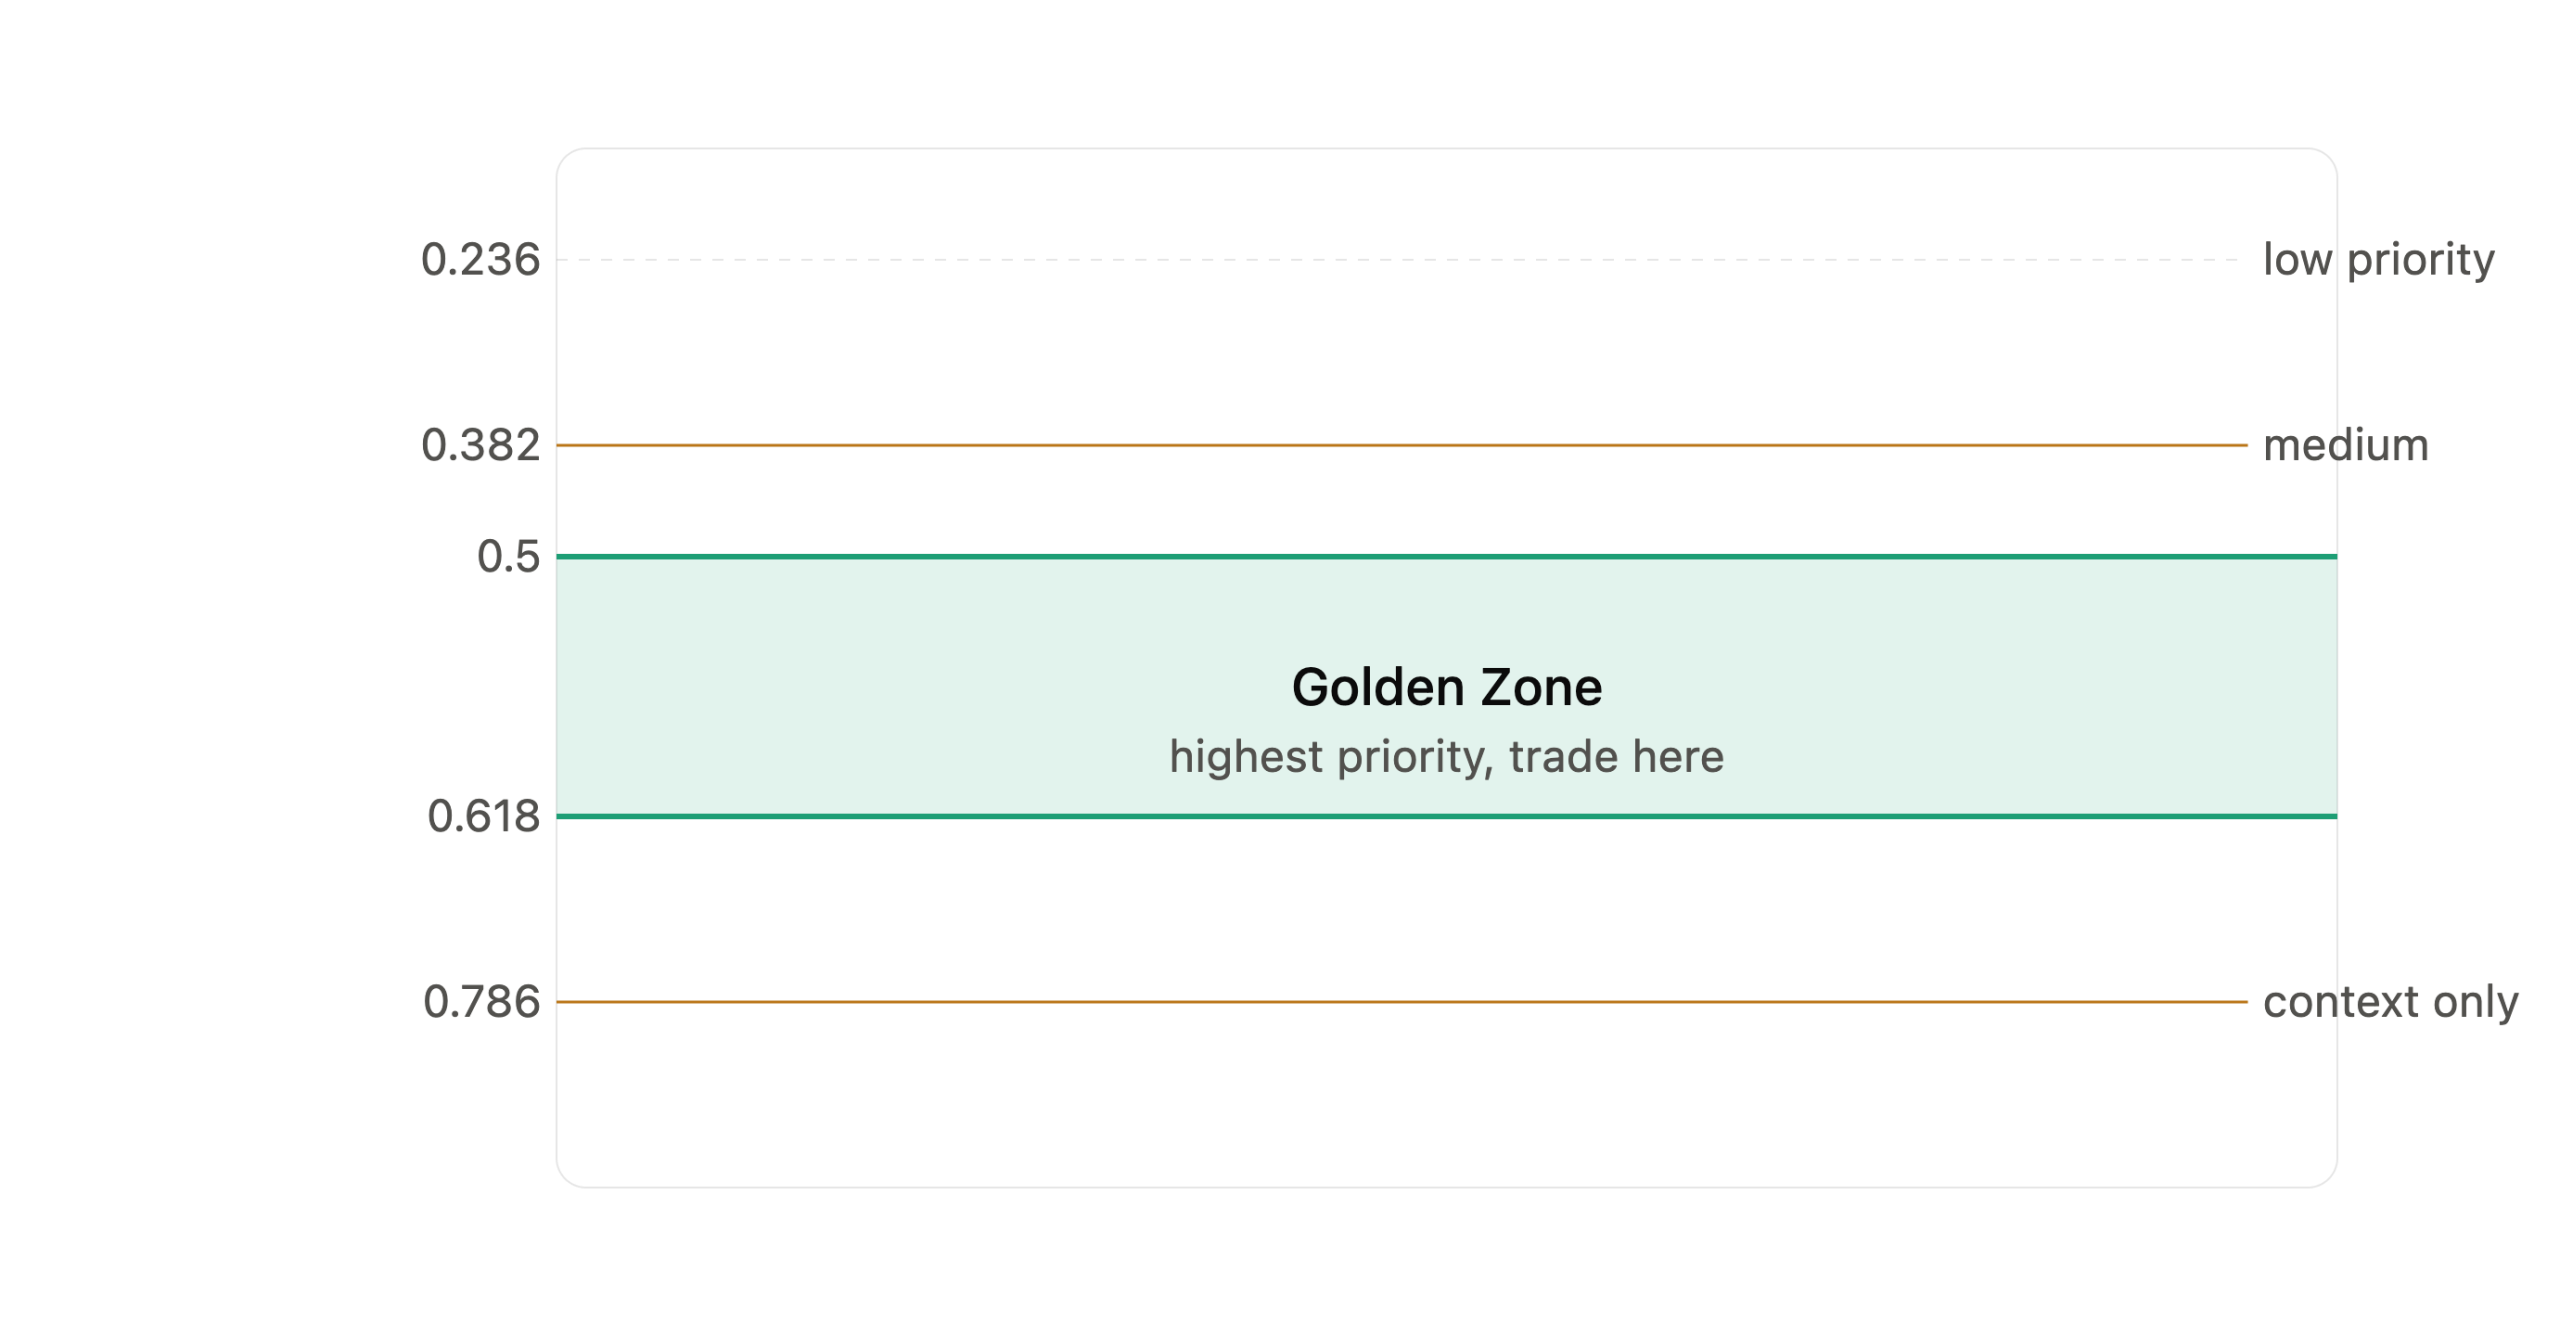
Not every level on the chart deserves the same attention. These are the tiers that experienced forex traders use to organize the levels by importance.

The 0.618 Level

The 0.618 is the golden ratio and the single most important fibonacci retracement level in forex. It is the point where the mathematical relationship between consecutive fibonacci numbers converges most precisely. In a healthy, structured trend, price frequently returns to the 0.618 before continuing in the original direction. Institutional traders watch this level, which means it tends to be self-fulfilling when the broader trend is intact. A pullback to the 0.618 tells a trader that sellers (in an uptrend) or buyers (in a downtrend) have absorbed roughly 61.8% of the prior move. That is a deep enough correction to shake out weak hands while still leaving the original trend intact. The 0.618 is where the highest-quality fibonacci setups tend to form.

The 0.5 Level

The 0.5 is the second priority. It marks the midpoint of the prior swing and carries weight because of its broad recognition across trading communities and institutions. When price retraces exactly to the 50% level, it is often the clearest test of whether buyers or sellers retain control of the trend. When the 0.5 and 0.618 sit close together, the zone between them frequently acts as a concentrated demand or supply area. This "golden zone" between 50% and 61.8% is the area that consistent fibonacci traders target most aggressively.

The 0.382 Level

The 0.382 level matters most in very strong trending markets. When momentum is high and a trend is moving with force, price often does not give traders a deep pullback opportunity. A retracement to 0.382 in a strong trend can mark a high-probability continuation zone, particularly when combined with a clear candlestick signal. Outside of a strong trend context, the 0.382 on its own carries limited weight. Treat it as relevant only when an additional technical factor confirms it.

The 0.236 and 0.786 Levels

These are the lowest priority for most setups. The 0.236 does not offer enough room for a sensible stop loss and tends to produce more false entries than valid ones. The 0.786 is structurally valid but sits so close to the original swing point that a stop placed beyond it often exposes excessive capital relative to potential reward. Use these levels as context rather than primary entry triggers.

Fibonacci Confluence and the Rule That Filters Signal from Noise
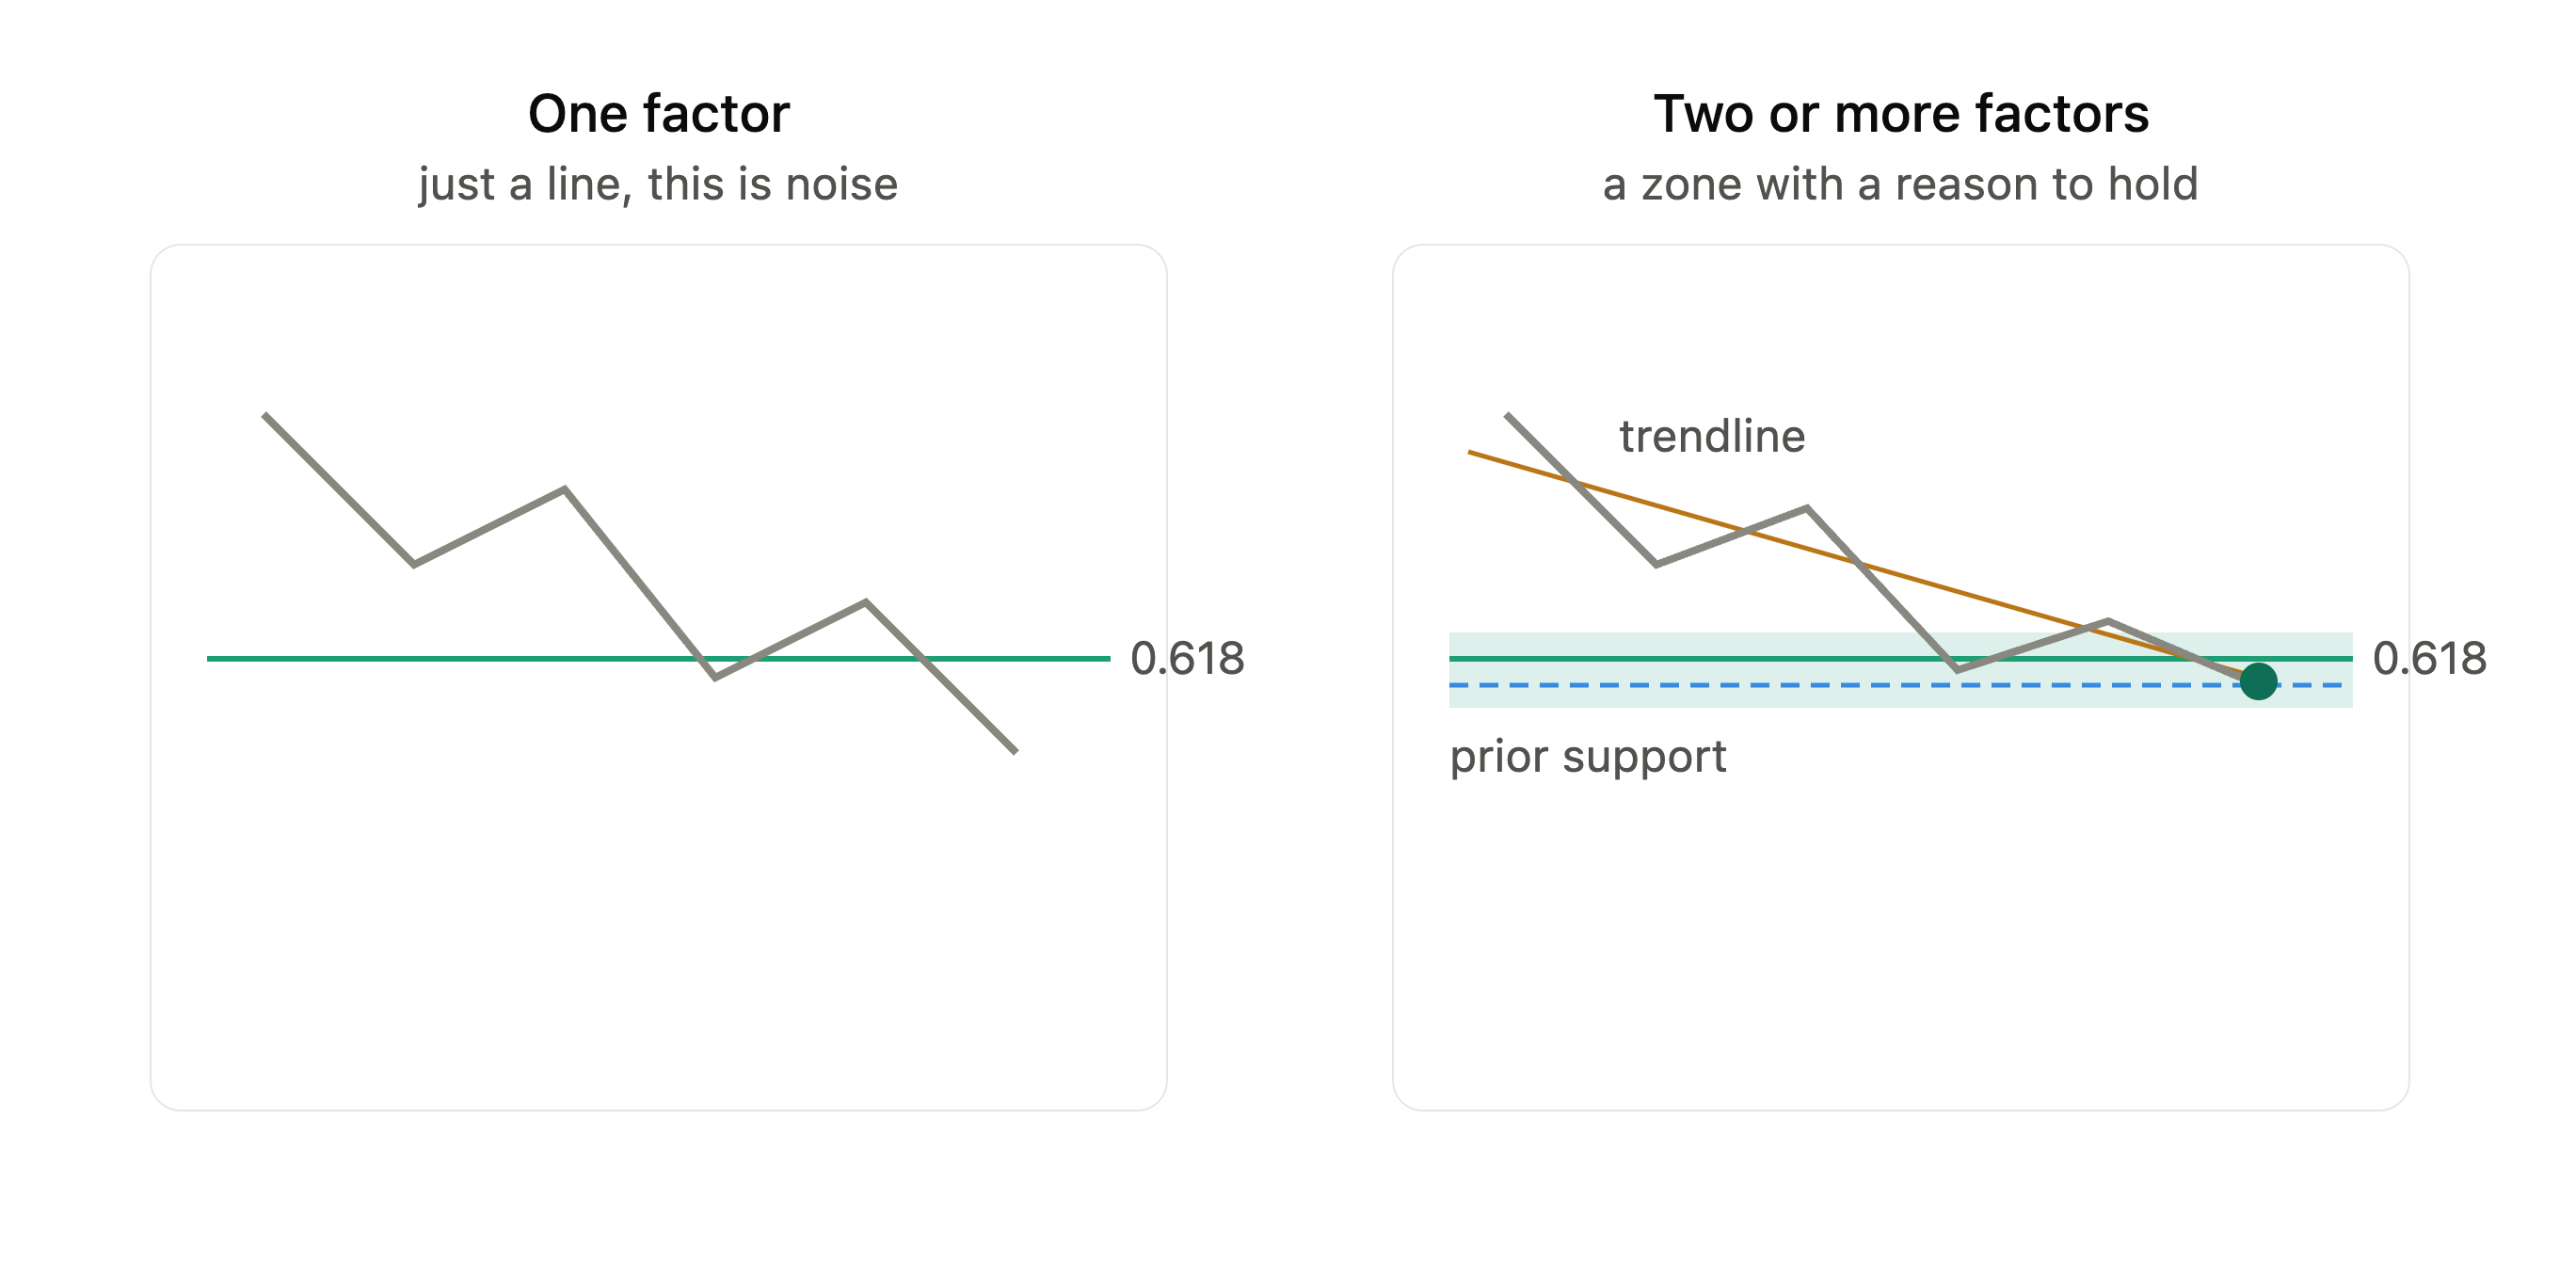
A fibonacci retracement level on its own carries no statistical edge. The edge comes from confluence. Confluence means the fib level aligns with at least one other independent technical factor at the same price zone. These are the four most reliable confluence combinations in forex trading.

Fib Level Plus Horizontal Support or Resistance

When the 0.618 sits on a prior swing high that has now flipped to support, two independent technical factors are marking the same price. This is the cleanest confluence setup available. The prior swing high already proved that buyers acted at that price. The fibonacci level says the current pullback has reached a natural mathematical boundary at the same point. These two factors together produce a zone with a genuine reason to hold. Supply and demand zones often provide the strongest horizontal confirmation for fibonacci levels. A well-drawn demand zone that aligns with the 0.618 creates a setup where institutional order flow and fibonacci mathematics are pointing at the same location.

Fib Level Plus a Trendline

A rising trendline connecting a sequence of higher lows can intersect a fibonacci retracement level as the pullback deepens. When the trendline and the 0.618 or 0.5 converge at the same price, the zone strengthens significantly. The trendline represents dynamic support. The fib level represents static support derived from the swing structure. Both factors say price should find buyers at that zone. This combination works particularly well on the four-hour and daily timeframes in forex, where trendlines tend to reflect genuine institutional positioning rather than random noise.

Fib Level Plus a Moving Average

The 20-period, 50-period, and 200-period moving averages are widely tracked by institutional participants. When a pullback brings price to the 0.618 and that level coincides with the 50-period moving average on the same timeframe, two types of market participants are watching the same zone. The fibonacci level attracts traders running fib-based strategies. The moving average attracts traders and algorithms tracking dynamic trend support. That combination produces fewer false entries than either factor alone.

Fib Level Plus a Candlestick Reversal Signal

Confluence does not always come from additional price levels or indicators. It can come from price behavior itself at the fib level. A bullish pin bar, a bullish engulfing candle, or a morning star pattern forming at the 0.618 tells a trader that price has tested the zone and sellers could not hold it. The candlestick signal provides both a structural reason to trade and a precise, low-risk entry point. Reversal candlestick patterns at fibonacci zones produce some of the cleanest risk-to-reward setups available in forex. A single reversal candle closing within the confluence zone is often enough for a qualified entry, provided the trend direction is clear and the stop placement is logical. The rule is this: require at least two independent factors to confirm before entering a fibonacci retracement trade. One factor is a line on a chart. Two factors are a zone with a reason to hold.

How to Trade Fibonacci Retracement Step by Step
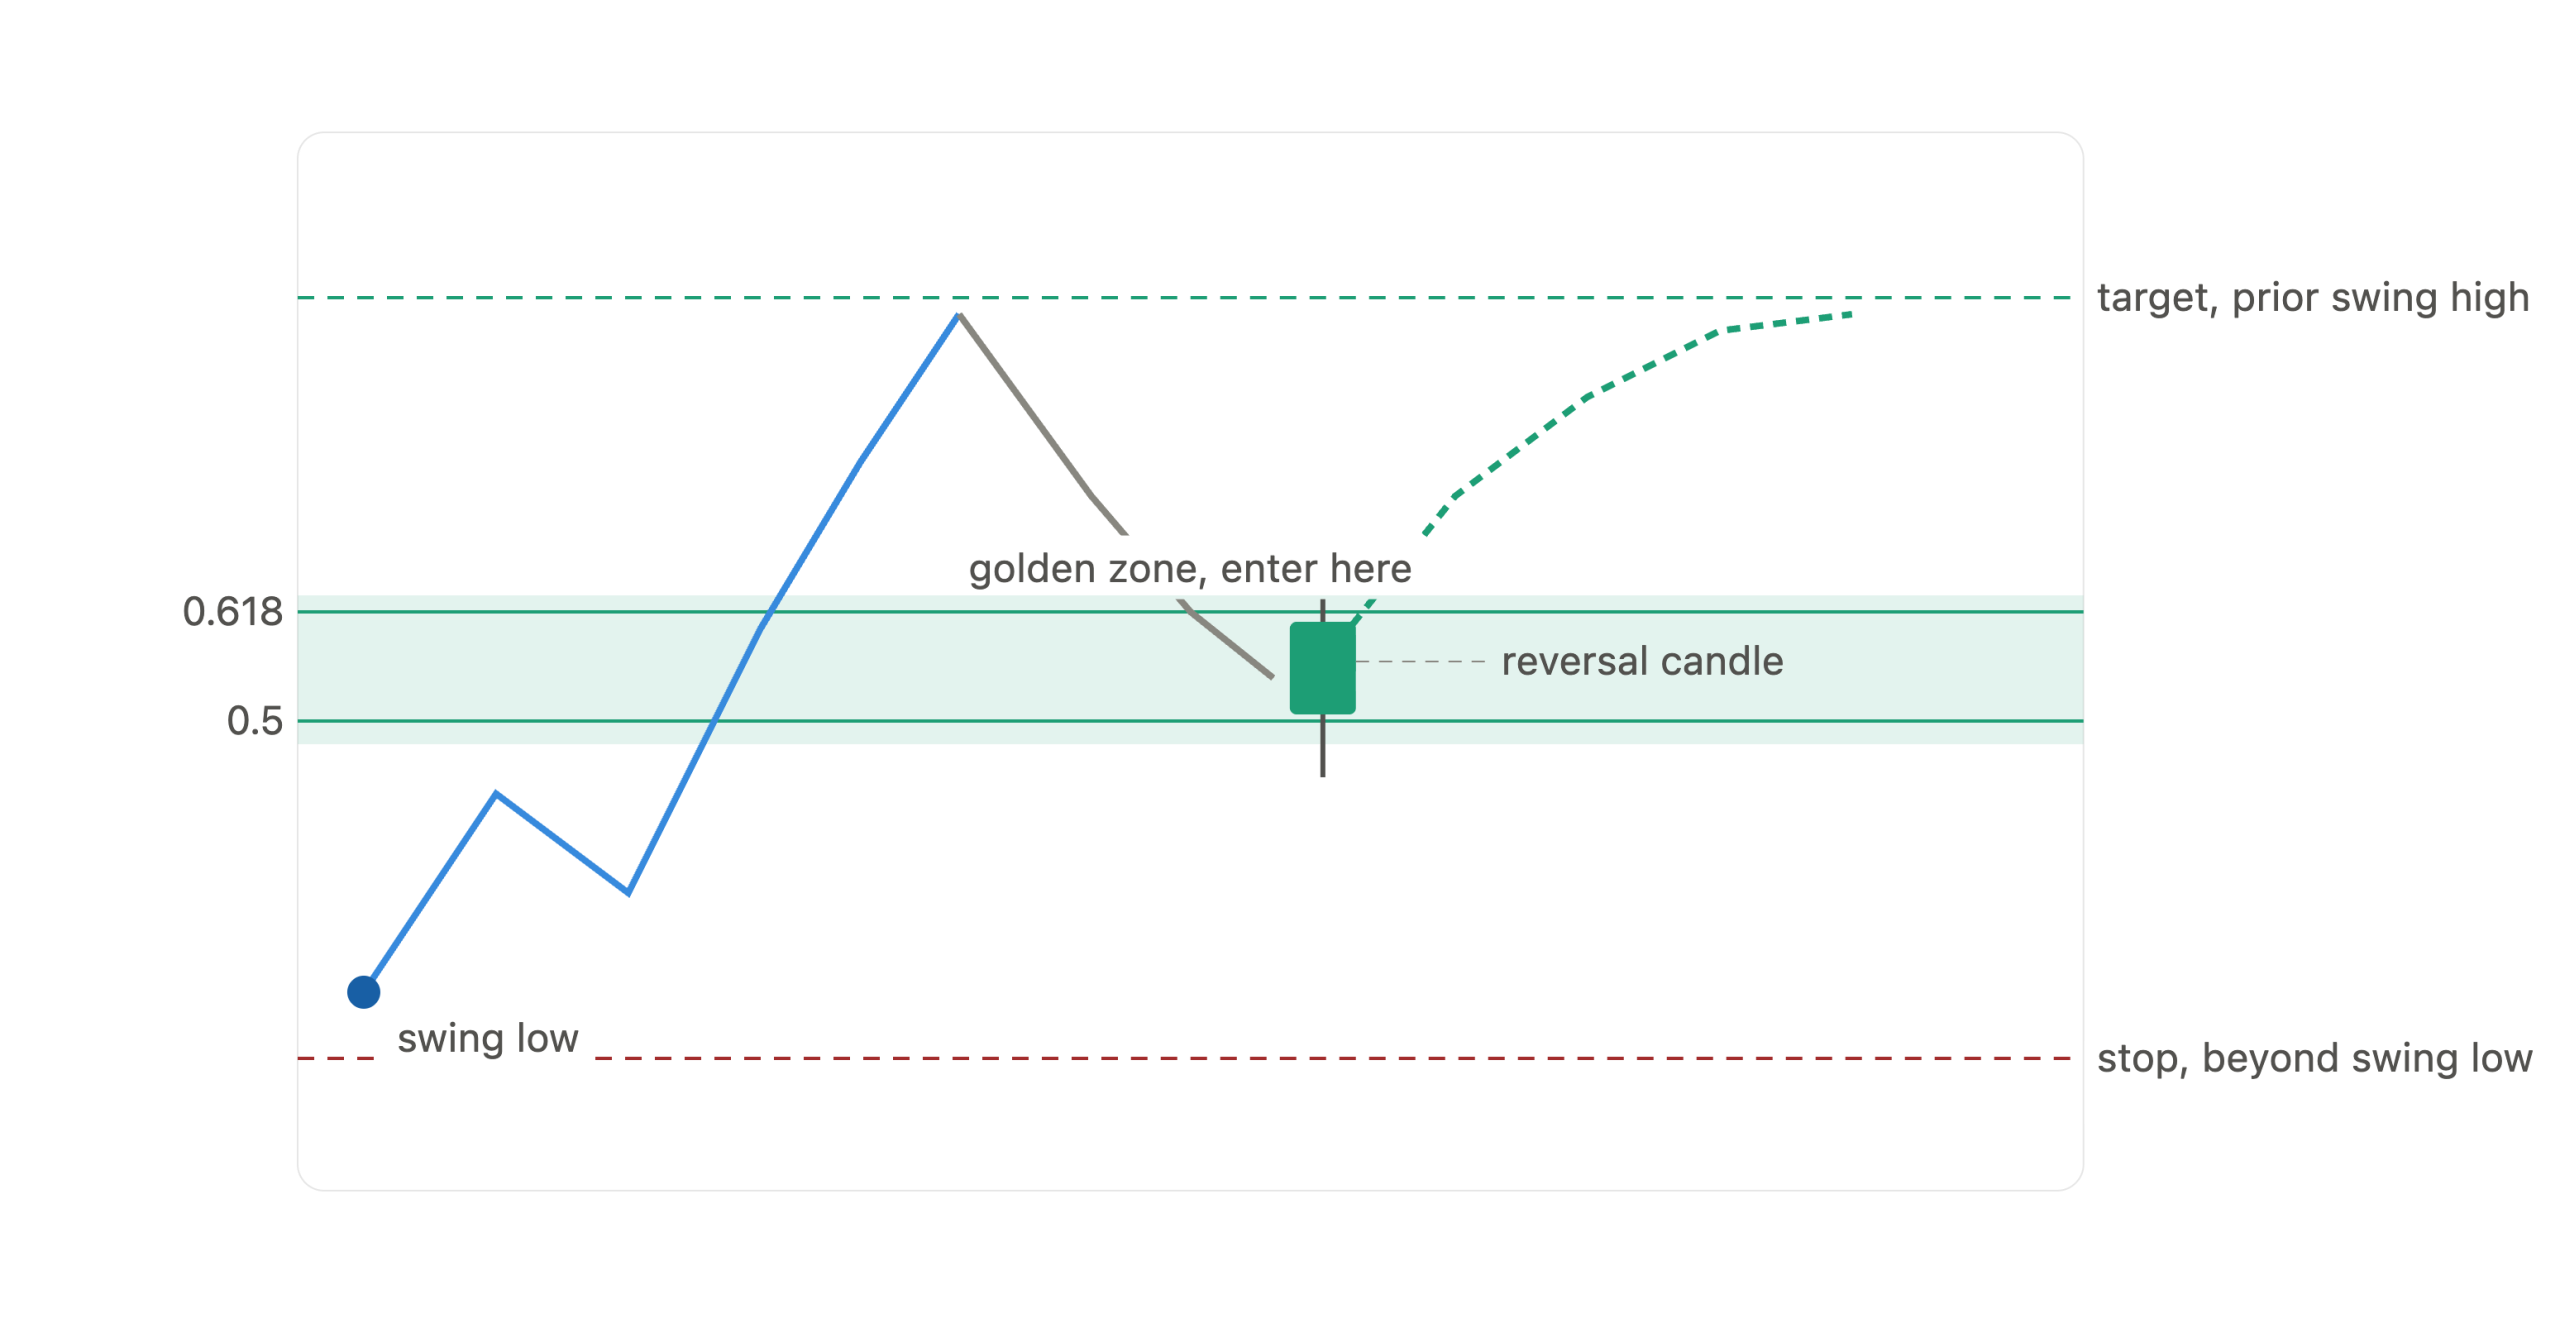
Here is the structured framework for building a fibonacci retracement trade in forex. Each step must be completed before moving to the next. Skipping steps is the source of most false entries.

Step 1 — Confirm the Trend Direction

Only trade fibonacci retracement in the direction of the larger trend. Identify whether the market is forming higher highs and higher lows, or lower highs and lower lows. Use the daily or four-hour chart to confirm the dominant trend before dropping to your entry timeframe. Countertrend fibonacci setups carry significantly lower probability and require stricter criteria.

Step 2 — Identify the Measurable Swing

Find the most recent clear swing move in the direction of the trend. This is the distance you will measure with the fibonacci tool. Both the start and end of the swing must be unambiguous. If you need to debate where the swing begins or ends, it is not a clean enough structure to use.

Step 3 — Draw the Fibonacci Retracement

Apply the tool from swing low to swing high in an uptrend, or from swing high to swing low in a downtrend. Verify that the 0 mark anchors at your first reference point and the 1.0 mark at your second. Check that the levels plot cleanly across the retracement zone.

Step 4 — Locate the Confluence Zone

Look at the 0.5 and 0.618 levels first. Check whether any horizontal support or resistance, an active trendline, or a key moving average aligns with either level. If confluence exists, mark that zone on your chart. If no confluence exists at these levels, do not force a trade. Not every fibonacci drawing produces a tradeable setup.

Step 5 — Wait for a Candlestick Signal

Price entering the confluence zone is not an entry trigger. Wait for a reversal candlestick to close within or immediately adjacent to the zone. The most reliable signals include pin bars, engulfing candles, and inside bars with a subsequent breakout. This single step removes the majority of false entries from a fibonacci trading approach.

Step 6 — Enter, Place the Stop, and Set the Target

Enter at the open of the candle following the confirmed reversal signal. Place the stop loss just beyond the 0.786 level or just beyond the original swing point, whichever is farther from the entry. For targets, use the opposing swing point as the first objective. Fibonacci extension levels at 1.272 and 1.618 of the original swing serve as secondary targets when the setup has strong momentum behind it. Require a minimum risk-to-reward ratio of 1:2 before entering. If the stop placement relative to the confluence zone does not produce at least two units of potential reward for every unit of risk, the setup does not qualify.

What a Qualified Fibonacci Trade Looks Like

Before taking any fibonacci retracement trade, verify all five of the following:
  • The setup runs with the higher-timeframe trend.
  • Price is pulling back to the 0.5 or 0.618 of a clear, measurable swing.
  • At least one additional technical factor confirms the zone.
  • A reversal candlestick has closed at or near the confluence zone.
  • The stop beyond the swing provides a minimum 1:2 risk-to-reward ratio.
If any single criterion is missing, the trade does not qualify. Passing on a setup that does not meet the criteria is the skill. Taking every level that appears on the chart is the habit that produces consistent losses. Understanding price action reading at the structural level is what separates a trader who uses fibonacci as a filter from one who uses it as a prediction tool.

Six Fibonacci Retracement Mistakes That Cost Traders Money

These are the six most common errors traders make with fibonacci retracement in forex. Each one has a specific fix.

Mistake 1 — Drawing on Minor Swings

The fibonacci tool is only as useful as the swing it measures. Drawing it on a one-hour minor move inside a daily downtrend produces levels that carry little structural weight. Always anchor the tool to the most significant and visible swing on the working timeframe. When in doubt, validate the swing on the next higher timeframe before using it as an anchor.

Mistake 2 — Treating Every Level as Equally Valid

Five levels appear on every fibonacci drawing. Treating all five as equally valid means a trader is always near some level, which creates overconfidence rather than precision. The 0.5 and 0.618 are the primary levels. The 0.382 is valid in strong trend contexts. The 0.236 and 0.786 require stricter confluence to justify an entry.

Mistake 3 — Entering Without Confluence

Price touching a fibonacci level is not a trade signal. It is a prompt to check for confluence. Without a second confirming factor, the probability of a sustained reversal at the level is no better than random. This single mistake accounts for more fibonacci losses than any other error.

Mistake 4 — Trading Against the Trend

Fibonacci retracement is designed as a trend continuation tool. Using it to trade countertrend reversals at the 0.786 or even the 0.618 introduces trend risk into every trade. In strongly trending markets, this approach repeatedly catches traders on the wrong side of institutional order flow.

Mistake 5 — Placing the Stop Loss Too Tight

A stop loss placed just below the 0.618 in an uptrend will be triggered by normal market volatility before price resumes higher. The stop must sit beyond the 0.786, or ideally just beyond the original swing low. Tight stops turn structurally valid setups into losing trades. Proper stop loss placement is not a secondary consideration in fibonacci trading. It is central to whether the method works at all.

Mistake 6 — Mixing Timeframes on the Anchor Points

Anchoring the swing low from a daily chart and the swing high from a 15-minute chart destroys the mathematical integrity of every level the tool draws. Each level becomes inaccurate because the tool is measuring a relationship that does not exist between those two points. Use the same timeframe for both anchor points, every time.

Conclusion

Fibonacci retracement is one of the most widely used tools in forex trading and one of the most consistently misused. The difference between a trader who extracts reliable setups from fibonacci levels and one who does not comes down to three disciplines. Draw the tool on the correct, significant swing. Require genuine confluence before treating a level as tradeable. Wait for a candlestick reversal signal before committing capital. The 0.618 and 0.5 levels are where the edge concentrates. Pair them with at least one confirming factor from supply and demand zones, trendlines, or key moving averages. Apply the six-step framework. Respect the stop placement rules. Then let the trade either work or invalidate cleanly. Asia Forex Mentor's free training covers the complete confluence framework that ties fibonacci retracement into a broader trading system. It includes how fibonacci levels integrate with trend structure and institutional price action, the same methodology that has earned Asia Forex Mentor recognition from Investopedia as "Most Comprehensive Course" and from Benzinga as "Best Forex Trading Course."

Also Read: Mastering Fibonacci Extension for Precise Exits

Frequently Asked Questions

What Is the Best Fibonacci Retracement Level to Trade?

The 0.618 level, known as the golden ratio, is the most reliable fibonacci retracement level in forex. It is the point where the mathematical ratio between consecutive fibonacci numbers converges most precisely. Price respects this level most consistently in trending markets, particularly when it coincides with a horizontal support zone, a trendline, or a key moving average. The 0.5 level is the second-strongest and is often watched alongside the 0.618 as a combined zone.

How Do You Draw Fibonacci Retracement Correctly?

In an uptrend, drag the fibonacci retracement tool from the swing low to the swing high. The 0 mark anchors at the low and the 1.0 mark at the high. In a downtrend, drag from the swing high to the swing low. Always use the most significant and clearly visible swing points on your working timeframe. Never mix anchor points from different timeframes, as this produces inaccurate levels across the entire drawing.

What Is Fibonacci Confluence and Why Does It Matter?

Fibonacci confluence means a fibonacci retracement level aligns with at least one other independent technical factor at the same price zone. Examples include a 0.618 level that sits on a prior swing high, a 0.5 level that coincides with the 50-period moving average, or a 0.618 that touches an active trendline. Two independent factors pointing at the same price zone increase the probability that price will react there. One factor is a line. Two factors are a zone with a reason to hold.

Which Timeframe Works Best for Fibonacci Retracement in Forex?

The daily and four-hour timeframes produce the most reliable fibonacci retracement levels in forex. These timeframes capture institutional order flow more effectively than shorter intervals. Lower timeframes such as the 15-minute or one-hour chart can be used to refine entries after the setup is identified on the higher timeframe. This top-down approach keeps the fibonacci analysis anchored to significant market structure while allowing precise entry timing on the lower timeframe.

Where Should the Stop Loss Go on a Fibonacci Retracement Trade?

Place the stop loss just beyond the 0.786 retracement level or just beyond the original swing point, whichever gives more distance from the entry. This placement allows the trade room to absorb normal market volatility without being stopped out on noise. Stops placed at the exact 0.618 level are too tight and frequently get hit before price resumes in the intended direction. A stop beyond the swing point is the only logical invalidation level for a fibonacci-based entry.


ezekiel chew asiaforexmentor

About Ezekiel Chew

Ezekiel Chew, founder and head of training at Asia Forex Mentor, is a renowned forex expert, frequently invited to speak at major industry events. Known for his deep market insights, Ezekiel is one of the top traders committed to supporting the trading community. Making six figures per trade, he also trains traders working in banks, fund management, and prop trading firms.

RELATED ARTICLES

Fibonacci Retracement Forex Trading Guide 2026

4.0
Overall Trust Index

Written by:

Updated:

August 4, 2026
Most traders who use fibonacci retracement anchor the tool to the wrong swing points, then treat every level the chart produces as a valid trade signal.

ABOUT THIS GUIDE

This guide covers how to draw fibonacci retracement correctly on a real forex chart, which levels carry genuine weight, and the confluence rules that turn a fib line into a high-probability zone. It closes with a step-by-step entry, stop, and target method plus the common mistakes that cause false entries.
 

QUICK ANSWER

Fibonacci retracement is a technical tool that marks potential support and resistance levels within a price pullback. It divides a prior swing move into horizontal lines at 0.236, 0.382, 0.5, 0.618, and 0.786. The 0.618 and 0.5 levels carry the most weight in forex. These levels work best when they align with at least one other independent technical factor.

What Fibonacci Retracement Is and Why Most Traders Get It Wrong

The fibonacci sequence was documented by the Italian mathematician Leonardo Fibonacci in the 13th century. The sequence runs as follows: 0, 1, 1, 2, 3, 5, 8, 13, 21, 34, 55, 89, and so on. Each number is the sum of the two that come before it. Divide any number in the sequence by the one that follows it and the result approaches 0.618. This ratio, known as the golden ratio, appears throughout nature, architecture, and financial markets. In forex, fibonacci retracement is applied after a clear, measurable price swing. The tool measures that swing and draws horizontal lines at specific mathematical ratios of its total distance. Traders use these lines to anticipate where a pullback may stall before the original trend resumes. The tool does not predict price. It marks zones where demand or supply has historically emerged at mathematically significant points. The reason most traders struggle with this tool comes down to one error. They apply fibonacci retracement and then act on any level price touches, without requiring any additional technical confirmation. A fib level in isolation is just a horizontal line. It carries no edge on its own. The edge comes when that level coincides with at least one other independent factor. Without that second factor, a fibonacci level is noise.

The Five Fibonacci Retracement Levels Explained

The standard fibonacci retracement tool plots five levels between a swing high and a swing low. Each level represents a different percentage of the original move. Here is what each one means and how much weight it carries in a real forex context:
Level Type What It Signals in Forex Priority
0.236 (23.6%) True Fibonacci ratio Shallow pullback in a strong trend Low
0.382 (38.2%) True Fibonacci ratio Moderate retracement in a healthy trend Medium
0.500 (50%) Derived from Dow Theory Midpoint retracement, widely watched High
0.618 (61.8%) The golden ratio Deep retracement, strongest single level Highest
0.786 (78.6%) Square root of 0.618 Very deep pullback, last line before trend failure Medium
The 0.5 level deserves a note. It is not a true fibonacci ratio. It appears in most charting platforms because of its history in Dow Theory, where the midpoint of a move was treated as a natural equilibrium zone. In practice it behaves like a genuine fibonacci level because of its widespread use among traders worldwide. The 0.786 level sits very close to the original swing point. A pullback that reaches 0.786 is testing the structural integrity of the entire prior move. If price holds there and reverses, the signal is valid. If price closes through it, the original swing is likely being redrawn and the trade idea is invalid. The 0.236 level is the weakest of the five. It appears on strong trending moves but offers very little room for a logical stop loss. Entries at 0.236 tend to produce unfavorable risk-to-reward ratios and a higher rate of false signals. Most experienced traders skip it unless it coincides with a major horizontal level on a higher timeframe.

How to Draw Fibonacci Retracement Correctly on a Forex Chart

Getting the anchor points right is the foundation of the entire tool. An incorrect anchor produces incorrect levels, and no amount of confluence analysis fixes a badly drawn fibonacci.
  • In an uptrend: drag the fibonacci retracement tool from the most recent significant swing low to the most recent significant swing high. The 0 mark anchors at the swing low and the 1.0 mark anchors at the swing high. Retracement levels appear between those two points, representing pullback zones within the upswing.
  • In a downtrend: drag from the most recent significant swing high to the most recent significant swing low. The 0 mark anchors at the swing high and the 1.0 mark anchors at the swing low. Retracement levels now appear within the upward pullback zone.
The word significant carries real weight here. The swing points must be clearly visible price structures on the working timeframe. Using minor wicks instead of confirmed swing bodies introduces error into every level the tool draws. When the anchor points are ambiguous, move up one timeframe and identify the swing that is obvious and uncontested. Three additional rules govern correct drawing:
  1. Use the same timeframe for both anchor points. Mixing a daily swing high with an hourly swing low produces inaccurate levels that do not reflect any single market structure.
  2. Only draw fibonacci retracement on a move with a clear start and a clear end. A sideways, choppy range has no valid directional swing to measure.
  3. Redraw the tool when a new, larger swing replaces the one you measured. Fibonacci levels from an old, superseded swing carry no current market significance.

Which Fibonacci Retracement Levels to Prioritize

Not every level on the chart deserves the same attention. These are the tiers that experienced forex traders use to organize the levels by importance.

The 0.618 Level

The 0.618 is the golden ratio and the single most important fibonacci retracement level in forex. It is the point where the mathematical relationship between consecutive fibonacci numbers converges most precisely. In a healthy, structured trend, price frequently returns to the 0.618 before continuing in the original direction. Institutional traders watch this level, which means it tends to be self-fulfilling when the broader trend is intact. A pullback to the 0.618 tells a trader that sellers (in an uptrend) or buyers (in a downtrend) have absorbed roughly 61.8% of the prior move. That is a deep enough correction to shake out weak hands while still leaving the original trend intact. The 0.618 is where the highest-quality fibonacci setups tend to form.

The 0.5 Level

The 0.5 is the second priority. It marks the midpoint of the prior swing and carries weight because of its broad recognition across trading communities and institutions. When price retraces exactly to the 50% level, it is often the clearest test of whether buyers or sellers retain control of the trend. When the 0.5 and 0.618 sit close together, the zone between them frequently acts as a concentrated demand or supply area. This "golden zone" between 50% and 61.8% is the area that consistent fibonacci traders target most aggressively.

The 0.382 Level

The 0.382 level matters most in very strong trending markets. When momentum is high and a trend is moving with force, price often does not give traders a deep pullback opportunity. A retracement to 0.382 in a strong trend can mark a high-probability continuation zone, particularly when combined with a clear candlestick signal. Outside of a strong trend context, the 0.382 on its own carries limited weight. Treat it as relevant only when an additional technical factor confirms it.

The 0.236 and 0.786 Levels

These are the lowest priority for most setups. The 0.236 does not offer enough room for a sensible stop loss and tends to produce more false entries than valid ones. The 0.786 is structurally valid but sits so close to the original swing point that a stop placed beyond it often exposes excessive capital relative to potential reward. Use these levels as context rather than primary entry triggers.

Fibonacci Confluence and the Rule That Filters Signal from Noise

A fibonacci retracement level on its own carries no statistical edge. The edge comes from confluence. Confluence means the fib level aligns with at least one other independent technical factor at the same price zone. These are the four most reliable confluence combinations in forex trading.

Fib Level Plus Horizontal Support or Resistance

When the 0.618 sits on a prior swing high that has now flipped to support, two independent technical factors are marking the same price. This is the cleanest confluence setup available. The prior swing high already proved that buyers acted at that price. The fibonacci level says the current pullback has reached a natural mathematical boundary at the same point. These two factors together produce a zone with a genuine reason to hold. Supply and demand zones often provide the strongest horizontal confirmation for fibonacci levels. A well-drawn demand zone that aligns with the 0.618 creates a setup where institutional order flow and fibonacci mathematics are pointing at the same location.

Fib Level Plus a Trendline

A rising trendline connecting a sequence of higher lows can intersect a fibonacci retracement level as the pullback deepens. When the trendline and the 0.618 or 0.5 converge at the same price, the zone strengthens significantly. The trendline represents dynamic support. The fib level represents static support derived from the swing structure. Both factors say price should find buyers at that zone. This combination works particularly well on the four-hour and daily timeframes in forex, where trendlines tend to reflect genuine institutional positioning rather than random noise.

Fib Level Plus a Moving Average

The 20-period, 50-period, and 200-period moving averages are widely tracked by institutional participants. When a pullback brings price to the 0.618 and that level coincides with the 50-period moving average on the same timeframe, two types of market participants are watching the same zone. The fibonacci level attracts traders running fib-based strategies. The moving average attracts traders and algorithms tracking dynamic trend support. That combination produces fewer false entries than either factor alone.

Fib Level Plus a Candlestick Reversal Signal

Confluence does not always come from additional price levels or indicators. It can come from price behavior itself at the fib level. A bullish pin bar, a bullish engulfing candle, or a morning star pattern forming at the 0.618 tells a trader that price has tested the zone and sellers could not hold it. The candlestick signal provides both a structural reason to trade and a precise, low-risk entry point. Reversal candlestick patterns at fibonacci zones produce some of the cleanest risk-to-reward setups available in forex. A single reversal candle closing within the confluence zone is often enough for a qualified entry, provided the trend direction is clear and the stop placement is logical. The rule is this: require at least two independent factors to confirm before entering a fibonacci retracement trade. One factor is a line on a chart. Two factors are a zone with a reason to hold.

How to Trade Fibonacci Retracement Step by Step

Here is the structured framework for building a fibonacci retracement trade in forex. Each step must be completed before moving to the next. Skipping steps is the source of most false entries.

Step 1 — Confirm the Trend Direction

Only trade fibonacci retracement in the direction of the larger trend. Identify whether the market is forming higher highs and higher lows, or lower highs and lower lows. Use the daily or four-hour chart to confirm the dominant trend before dropping to your entry timeframe. Countertrend fibonacci setups carry significantly lower probability and require stricter criteria.

Step 2 — Identify the Measurable Swing

Find the most recent clear swing move in the direction of the trend. This is the distance you will measure with the fibonacci tool. Both the start and end of the swing must be unambiguous. If you need to debate where the swing begins or ends, it is not a clean enough structure to use.

Step 3 — Draw the Fibonacci Retracement

Apply the tool from swing low to swing high in an uptrend, or from swing high to swing low in a downtrend. Verify that the 0 mark anchors at your first reference point and the 1.0 mark at your second. Check that the levels plot cleanly across the retracement zone.

Step 4 — Locate the Confluence Zone

Look at the 0.5 and 0.618 levels first. Check whether any horizontal support or resistance, an active trendline, or a key moving average aligns with either level. If confluence exists, mark that zone on your chart. If no confluence exists at these levels, do not force a trade. Not every fibonacci drawing produces a tradeable setup.

Step 5 — Wait for a Candlestick Signal

Price entering the confluence zone is not an entry trigger. Wait for a reversal candlestick to close within or immediately adjacent to the zone. The most reliable signals include pin bars, engulfing candles, and inside bars with a subsequent breakout. This single step removes the majority of false entries from a fibonacci trading approach.

Step 6 — Enter, Place the Stop, and Set the Target

Enter at the open of the candle following the confirmed reversal signal. Place the stop loss just beyond the 0.786 level or just beyond the original swing point, whichever is farther from the entry. For targets, use the opposing swing point as the first objective. Fibonacci extension levels at 1.272 and 1.618 of the original swing serve as secondary targets when the setup has strong momentum behind it. Require a minimum risk-to-reward ratio of 1:2 before entering. If the stop placement relative to the confluence zone does not produce at least two units of potential reward for every unit of risk, the setup does not qualify.

What a Qualified Fibonacci Trade Looks Like

Before taking any fibonacci retracement trade, verify all five of the following:
  • The setup runs with the higher-timeframe trend.
  • Price is pulling back to the 0.5 or 0.618 of a clear, measurable swing.
  • At least one additional technical factor confirms the zone.
  • A reversal candlestick has closed at or near the confluence zone.
  • The stop beyond the swing provides a minimum 1:2 risk-to-reward ratio.
If any single criterion is missing, the trade does not qualify. Passing on a setup that does not meet the criteria is the skill. Taking every level that appears on the chart is the habit that produces consistent losses. Understanding price action reading at the structural level is what separates a trader who uses fibonacci as a filter from one who uses it as a prediction tool.

Six Fibonacci Retracement Mistakes That Cost Traders Money

These are the six most common errors traders make with fibonacci retracement in forex. Each one has a specific fix.

Mistake 1 — Drawing on Minor Swings

The fibonacci tool is only as useful as the swing it measures. Drawing it on a one-hour minor move inside a daily downtrend produces levels that carry little structural weight. Always anchor the tool to the most significant and visible swing on the working timeframe. When in doubt, validate the swing on the next higher timeframe before using it as an anchor.

Mistake 2 — Treating Every Level as Equally Valid

Five levels appear on every fibonacci drawing. Treating all five as equally valid means a trader is always near some level, which creates overconfidence rather than precision. The 0.5 and 0.618 are the primary levels. The 0.382 is valid in strong trend contexts. The 0.236 and 0.786 require stricter confluence to justify an entry.

Mistake 3 — Entering Without Confluence

Price touching a fibonacci level is not a trade signal. It is a prompt to check for confluence. Without a second confirming factor, the probability of a sustained reversal at the level is no better than random. This single mistake accounts for more fibonacci losses than any other error.

Mistake 4 — Trading Against the Trend

Fibonacci retracement is designed as a trend continuation tool. Using it to trade countertrend reversals at the 0.786 or even the 0.618 introduces trend risk into every trade. In strongly trending markets, this approach repeatedly catches traders on the wrong side of institutional order flow.

Mistake 5 — Placing the Stop Loss Too Tight

A stop loss placed just below the 0.618 in an uptrend will be triggered by normal market volatility before price resumes higher. The stop must sit beyond the 0.786, or ideally just beyond the original swing low. Tight stops turn structurally valid setups into losing trades. Proper stop loss placement is not a secondary consideration in fibonacci trading. It is central to whether the method works at all.

Mistake 6 — Mixing Timeframes on the Anchor Points

Anchoring the swing low from a daily chart and the swing high from a 15-minute chart destroys the mathematical integrity of every level the tool draws. Each level becomes inaccurate because the tool is measuring a relationship that does not exist between those two points. Use the same timeframe for both anchor points, every time.

Conclusion

Fibonacci retracement is one of the most widely used tools in forex trading and one of the most consistently misused. The difference between a trader who extracts reliable setups from fibonacci levels and one who does not comes down to three disciplines. Draw the tool on the correct, significant swing. Require genuine confluence before treating a level as tradeable. Wait for a candlestick reversal signal before committing capital. The 0.618 and 0.5 levels are where the edge concentrates. Pair them with at least one confirming factor from supply and demand zones, trendlines, or key moving averages. Apply the six-step framework. Respect the stop placement rules. Then let the trade either work or invalidate cleanly. Asia Forex Mentor's free training covers the complete confluence framework that ties fibonacci retracement into a broader trading system. It includes how fibonacci levels integrate with trend structure and institutional price action, the same methodology that has earned Asia Forex Mentor recognition from Investopedia as "Most Comprehensive Course" and from Benzinga as "Best Forex Trading Course."

Also Read: Mastering Fibonacci Extension for Precise Exits

Frequently Asked Questions

What Is the Best Fibonacci Retracement Level to Trade?

The 0.618 level, known as the golden ratio, is the most reliable fibonacci retracement level in forex. It is the point where the mathematical ratio between consecutive fibonacci numbers converges most precisely. Price respects this level most consistently in trending markets, particularly when it coincides with a horizontal support zone, a trendline, or a key moving average. The 0.5 level is the second-strongest and is often watched alongside the 0.618 as a combined zone.

How Do You Draw Fibonacci Retracement Correctly?

In an uptrend, drag the fibonacci retracement tool from the swing low to the swing high. The 0 mark anchors at the low and the 1.0 mark at the high. In a downtrend, drag from the swing high to the swing low. Always use the most significant and clearly visible swing points on your working timeframe. Never mix anchor points from different timeframes, as this produces inaccurate levels across the entire drawing.

What Is Fibonacci Confluence and Why Does It Matter?

Fibonacci confluence means a fibonacci retracement level aligns with at least one other independent technical factor at the same price zone. Examples include a 0.618 level that sits on a prior swing high, a 0.5 level that coincides with the 50-period moving average, or a 0.618 that touches an active trendline. Two independent factors pointing at the same price zone increase the probability that price will react there. One factor is a line. Two factors are a zone with a reason to hold.

Which Timeframe Works Best for Fibonacci Retracement in Forex?

The daily and four-hour timeframes produce the most reliable fibonacci retracement levels in forex. These timeframes capture institutional order flow more effectively than shorter intervals. Lower timeframes such as the 15-minute or one-hour chart can be used to refine entries after the setup is identified on the higher timeframe. This top-down approach keeps the fibonacci analysis anchored to significant market structure while allowing precise entry timing on the lower timeframe.

Where Should the Stop Loss Go on a Fibonacci Retracement Trade?

Place the stop loss just beyond the 0.786 retracement level or just beyond the original swing point, whichever gives more distance from the entry. This placement allows the trade room to absorb normal market volatility without being stopped out on noise. Stops placed at the exact 0.618 level are too tight and frequently get hit before price resumes in the intended direction. A stop beyond the swing point is the only logical invalidation level for a fibonacci-based entry.
ezekiel chew asiaforexmentor

About Ezekiel Chew

Ezekiel Chew, founder and head of training at Asia Forex Mentor, is a renowned forex expert, frequently invited to speak at major industry events. Known for his deep market insights, Ezekiel is one of the top traders committed to supporting the trading community. Making six figures per trade, he also trains traders working in banks, fund management, and prop trading firms.

RELATED ARTICLES

Join the Live Event
Get Your Free Ticket Now

I consent to receiving emails and/or text message reminders for this event.

REGISTER FOR THE MASTERCLASS!