Hey, what’s up guys? It’s Ezekiel Chew here.
So let me hit you with this.
If you ever wanted a way to actually know where price is likely to finish a move, not guessing, not hope, not closing out early, today I’m breaking down the exact Fibonacci extension framework I use to map targets before price even gets there.
Not drawing random lines. Not slapping the 61.8% on a chart and then hoping.
I’m talking about a structured way to project where momentum is likely to exhaust, stack high-probability profit targets, and exit with precision instead of emotion.
So when you anchor the Fibonacci extensions correctly, the market no longer feels unpredictable. It becomes measurable. It becomes a very clean projection, a logical target.
When you see these levels line up with structure and momentum, taking profits no longer feels like a gamble anymore.
📺 Watch the full breakdown in this video:
What the Fibonacci Extension Really Does
Maybe you have heard traders talk about Fibonacci levels like some kind of secret code.
The truth is that they are not magic.
They are measurements.
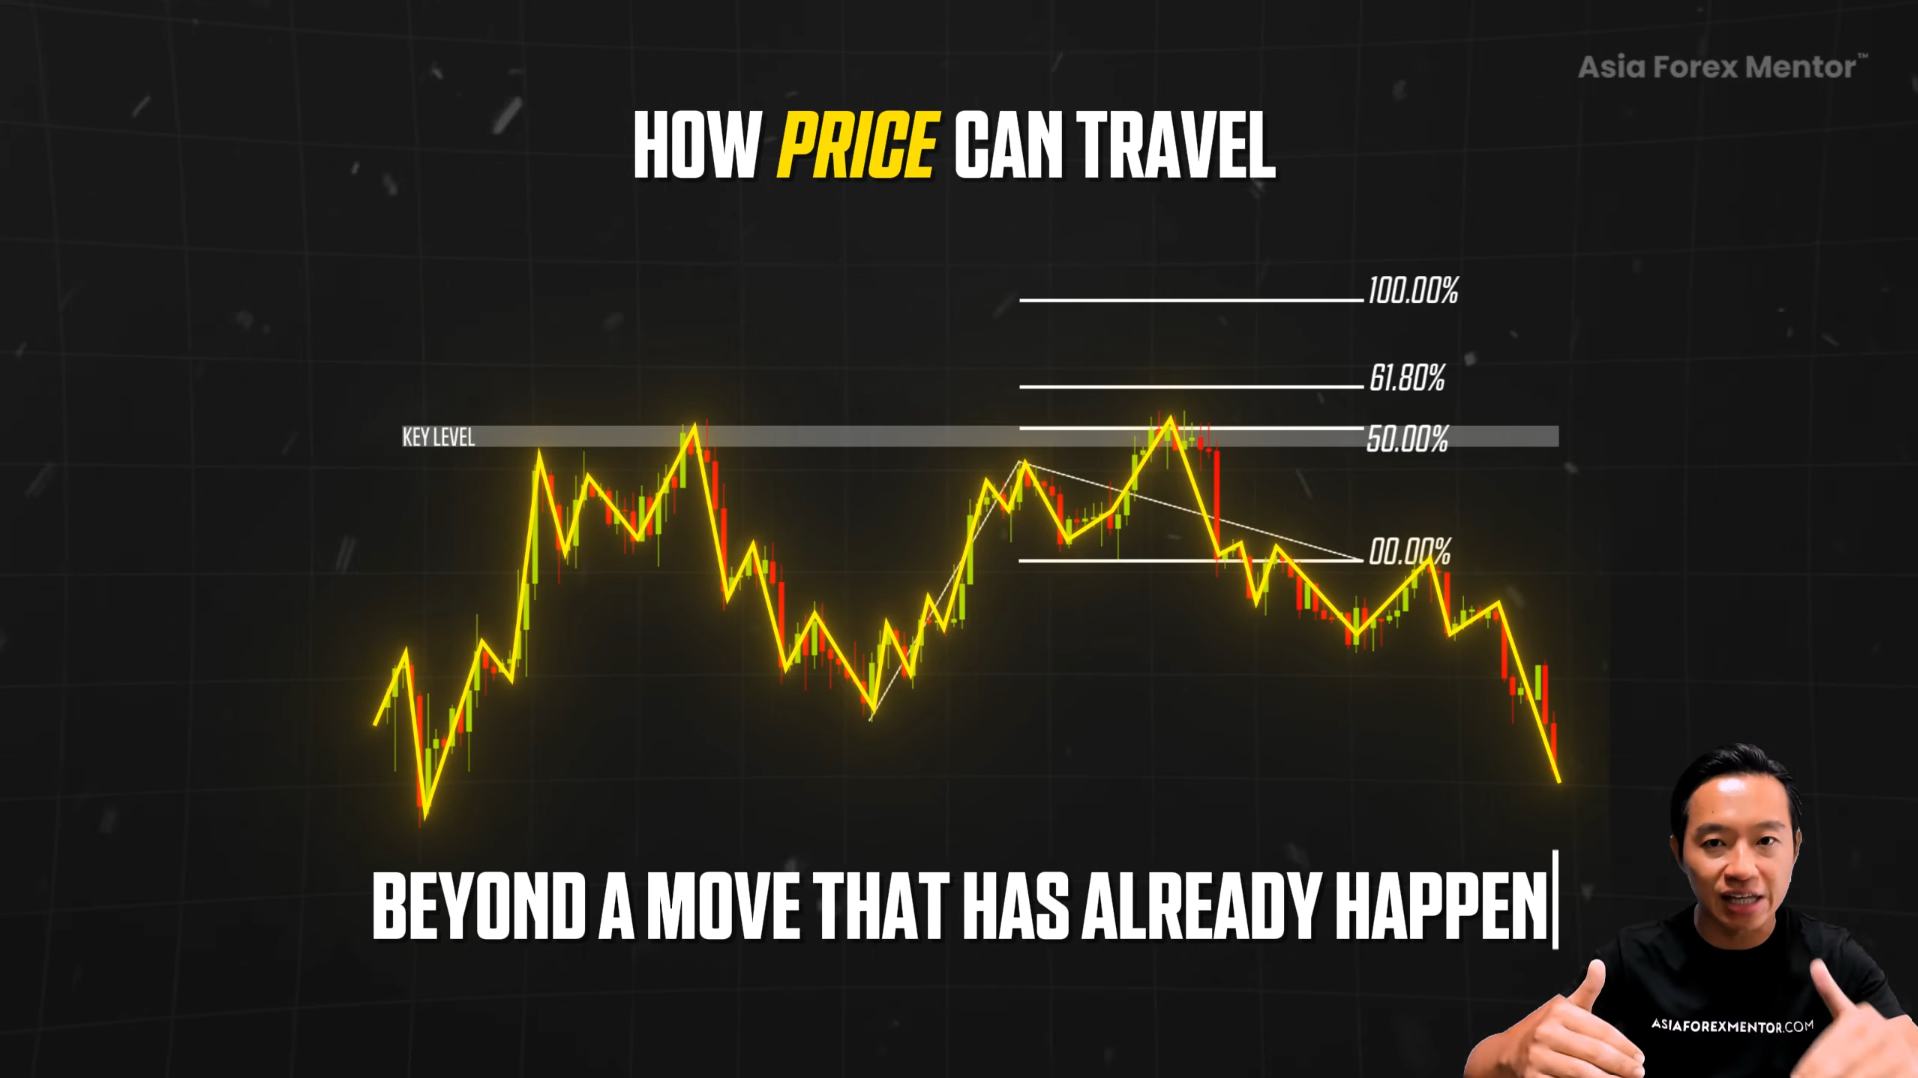
The Fibonacci extension simply shows how price can travel beyond a move that has already happened. Think of it like a projection tool, not a pullback gauge.
This is where a lot of traders get mixed up.
They use the Fibonacci retracement tool to find where price might pull back to. This is not about Fibonacci retracement. This is about Fibonacci extension.
Fibonacci extension is used to project where price could push towards next.
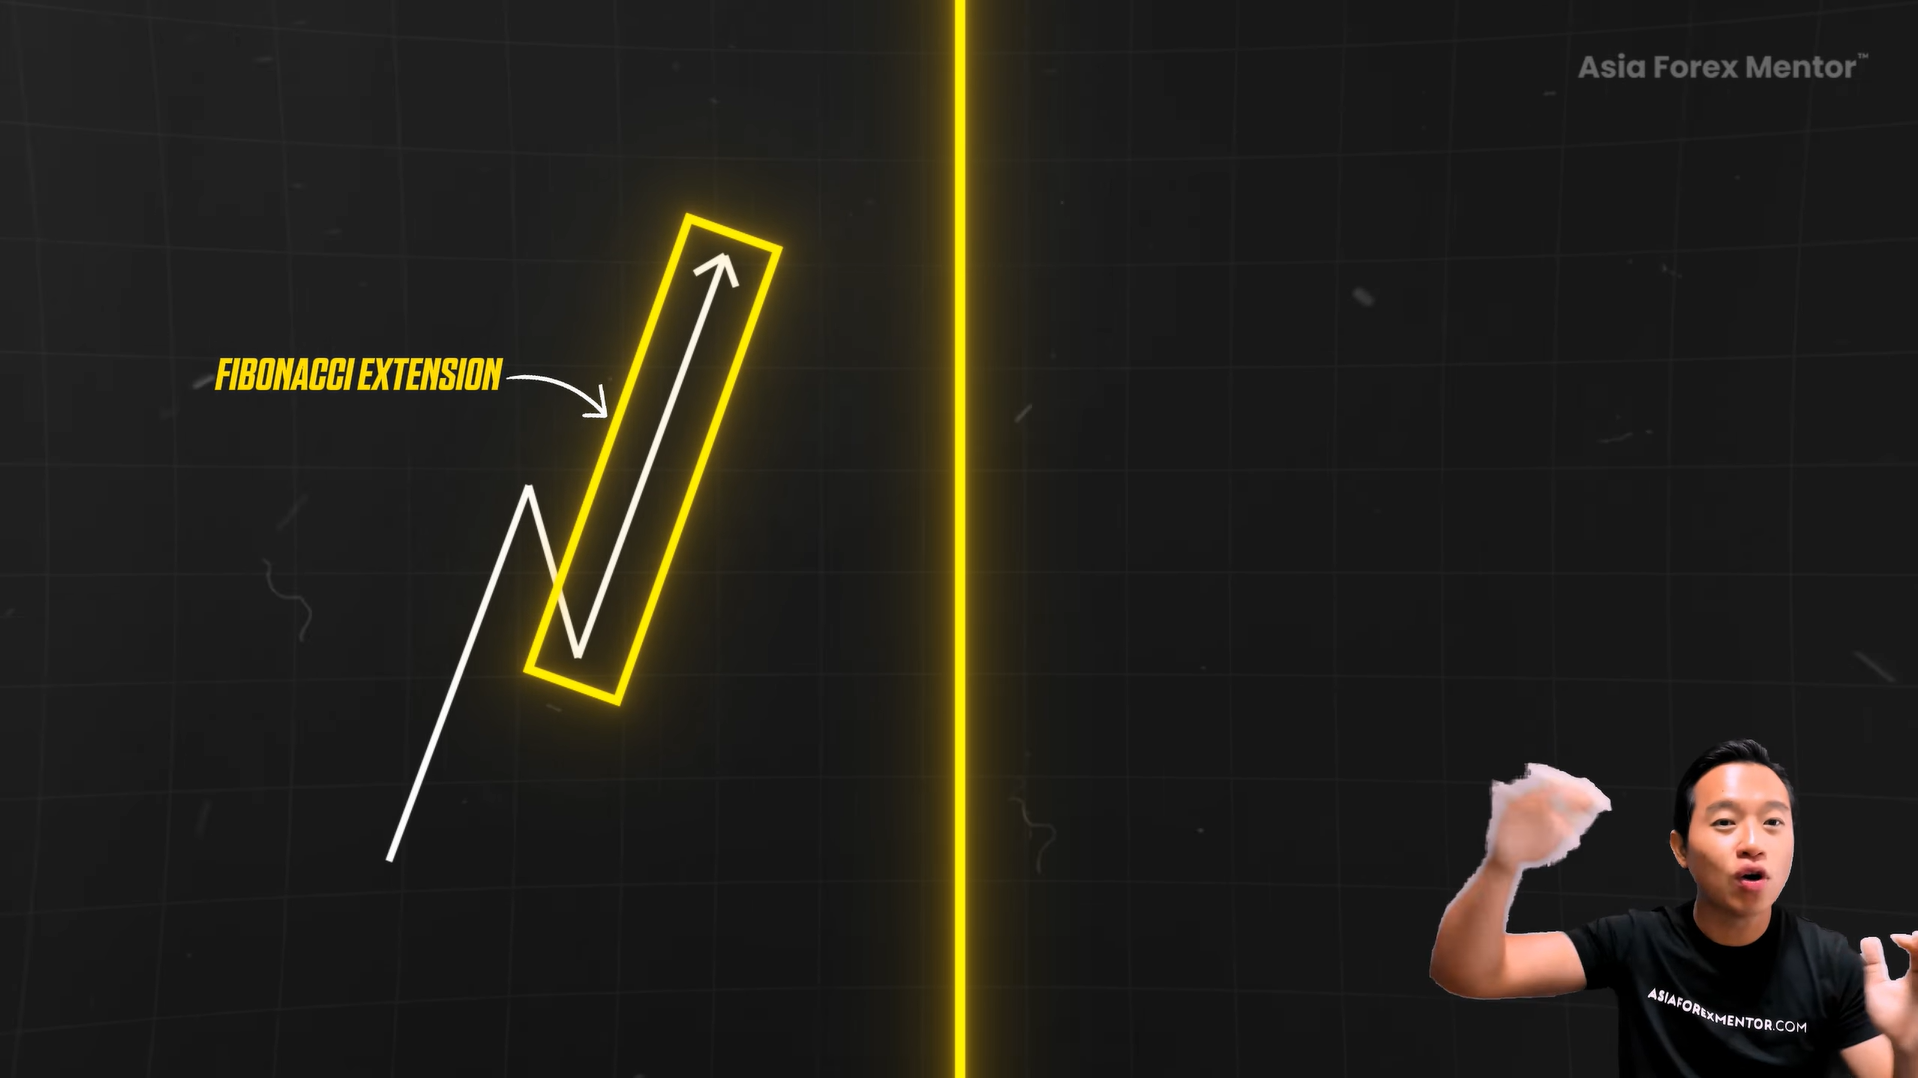
The retracement looks backwards, where it retraces to. The extension looks forward. It is as simple as that.
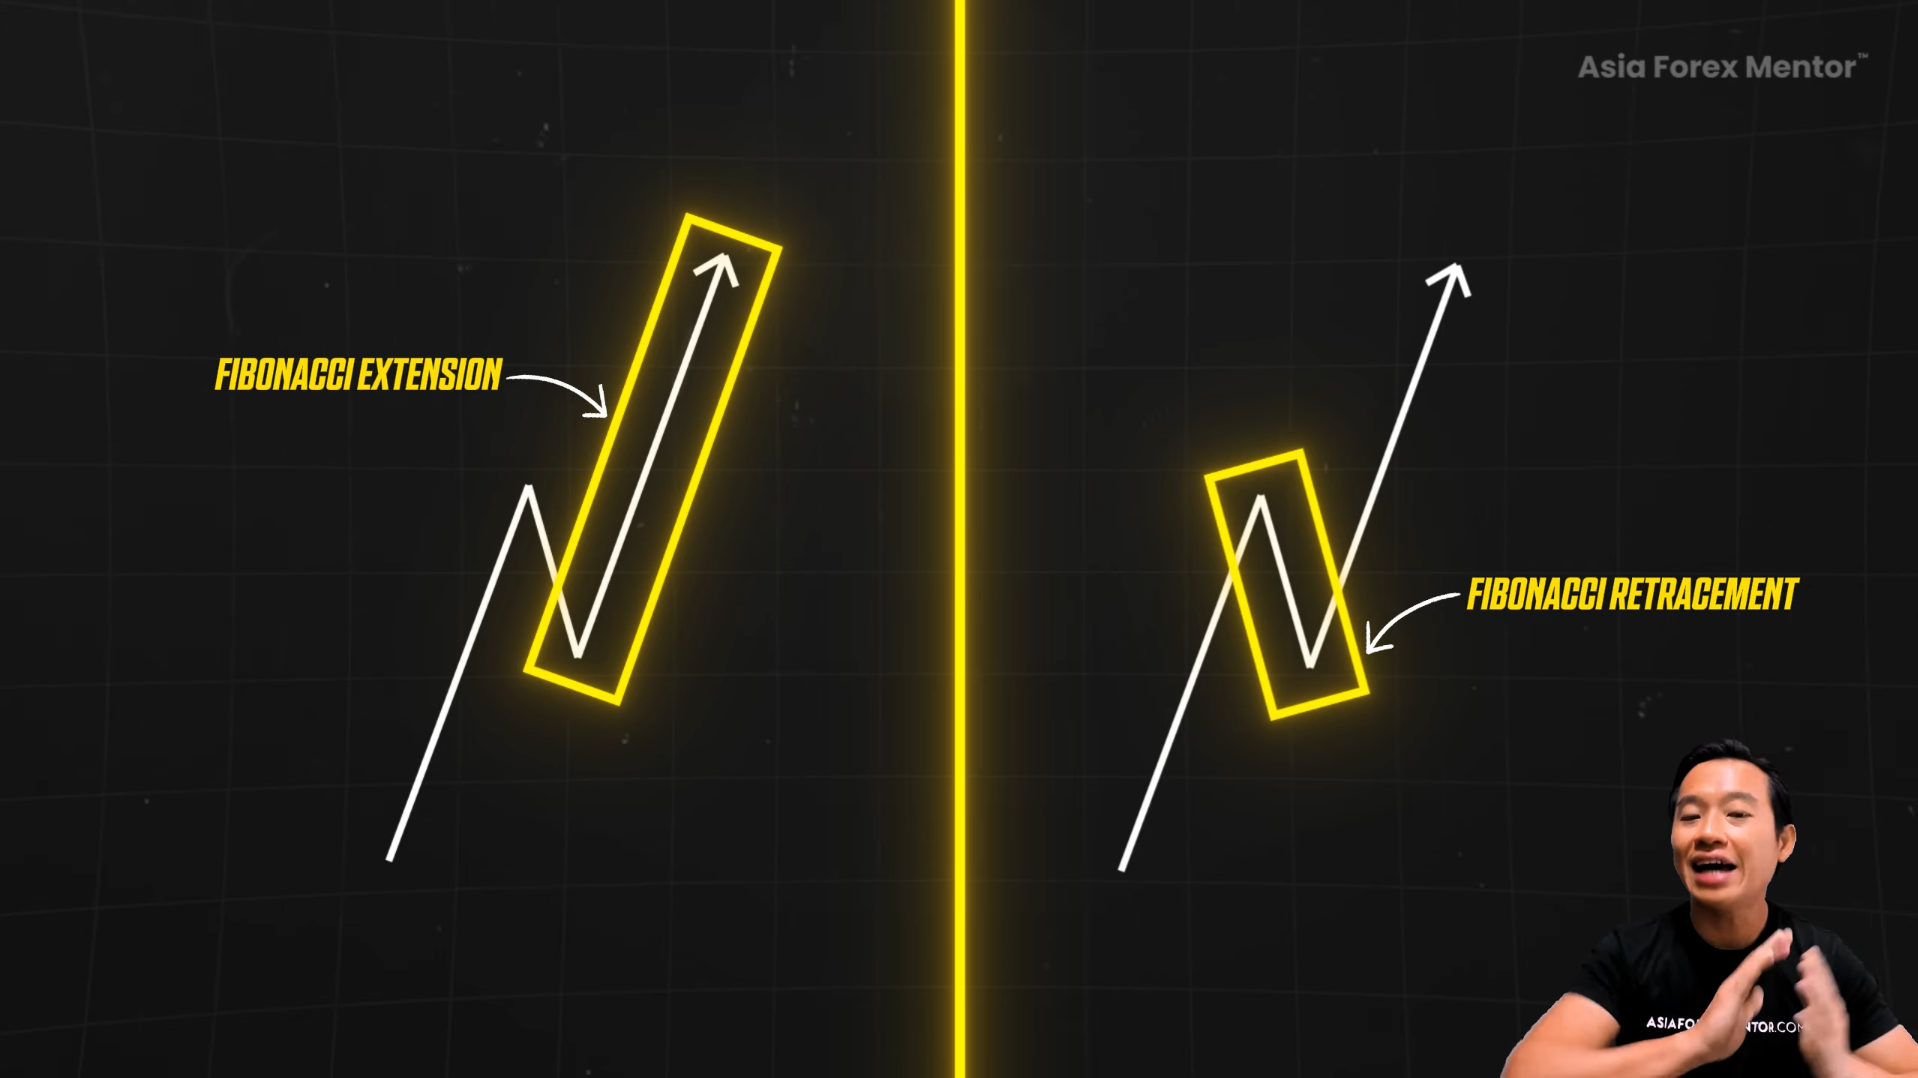
When you understand the difference, it changes how you plan the exit, because you are no longer guessing where to take profit.
You are now mapping it out with precision.
If your chart looks like chaos, do not expect your trades to look any better.
So the first step is the foundation of setting up the Fibonacci extension tool the right way.
STEP 1
First thing that we need to do is open up the toolbar and look for the trend-based Fibonacci extension.
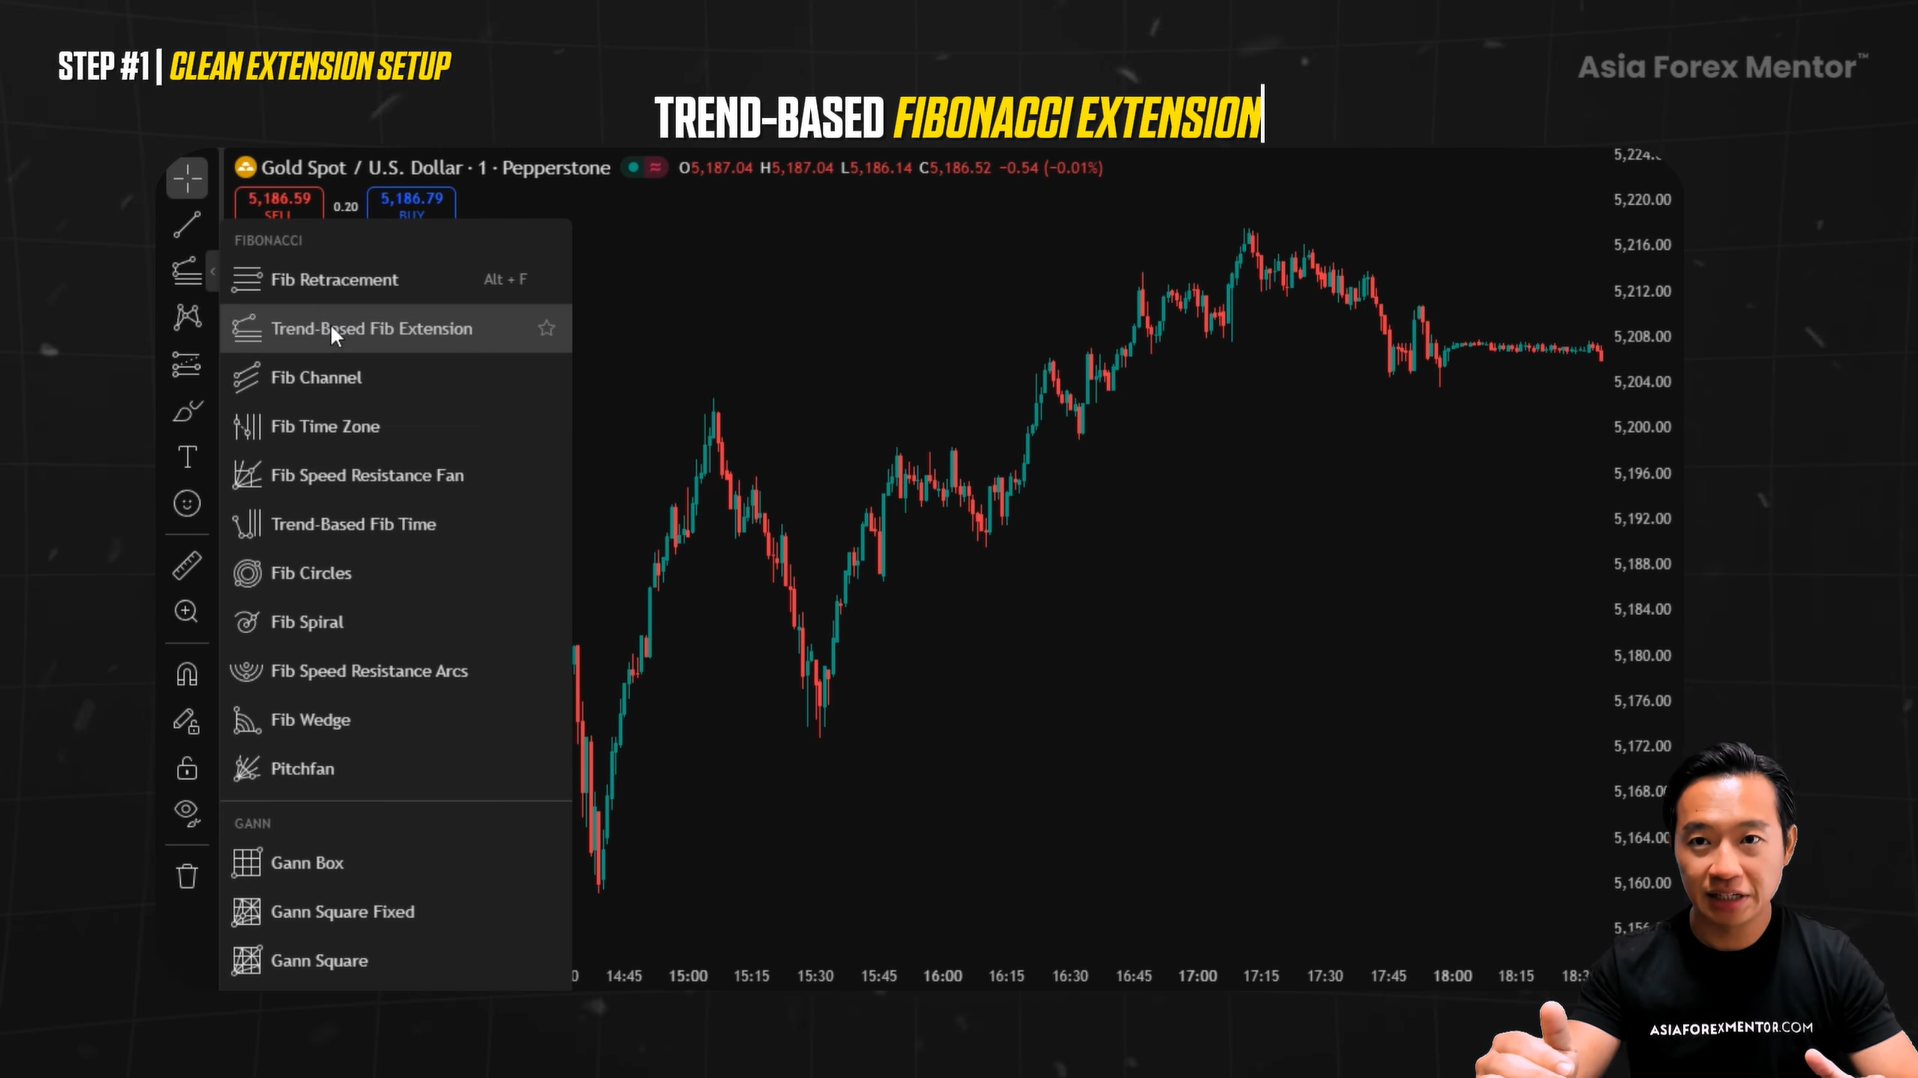
If you are using TradingView, you have it there. If you are using MetaTrader, you have a Fibonacci extension there as well.
When you set it up, you click once at the start of the move, then drag it towards the top of the impulse and click again, then drag it down to the correction and click once more.
That is your basic extension tool on the chart.
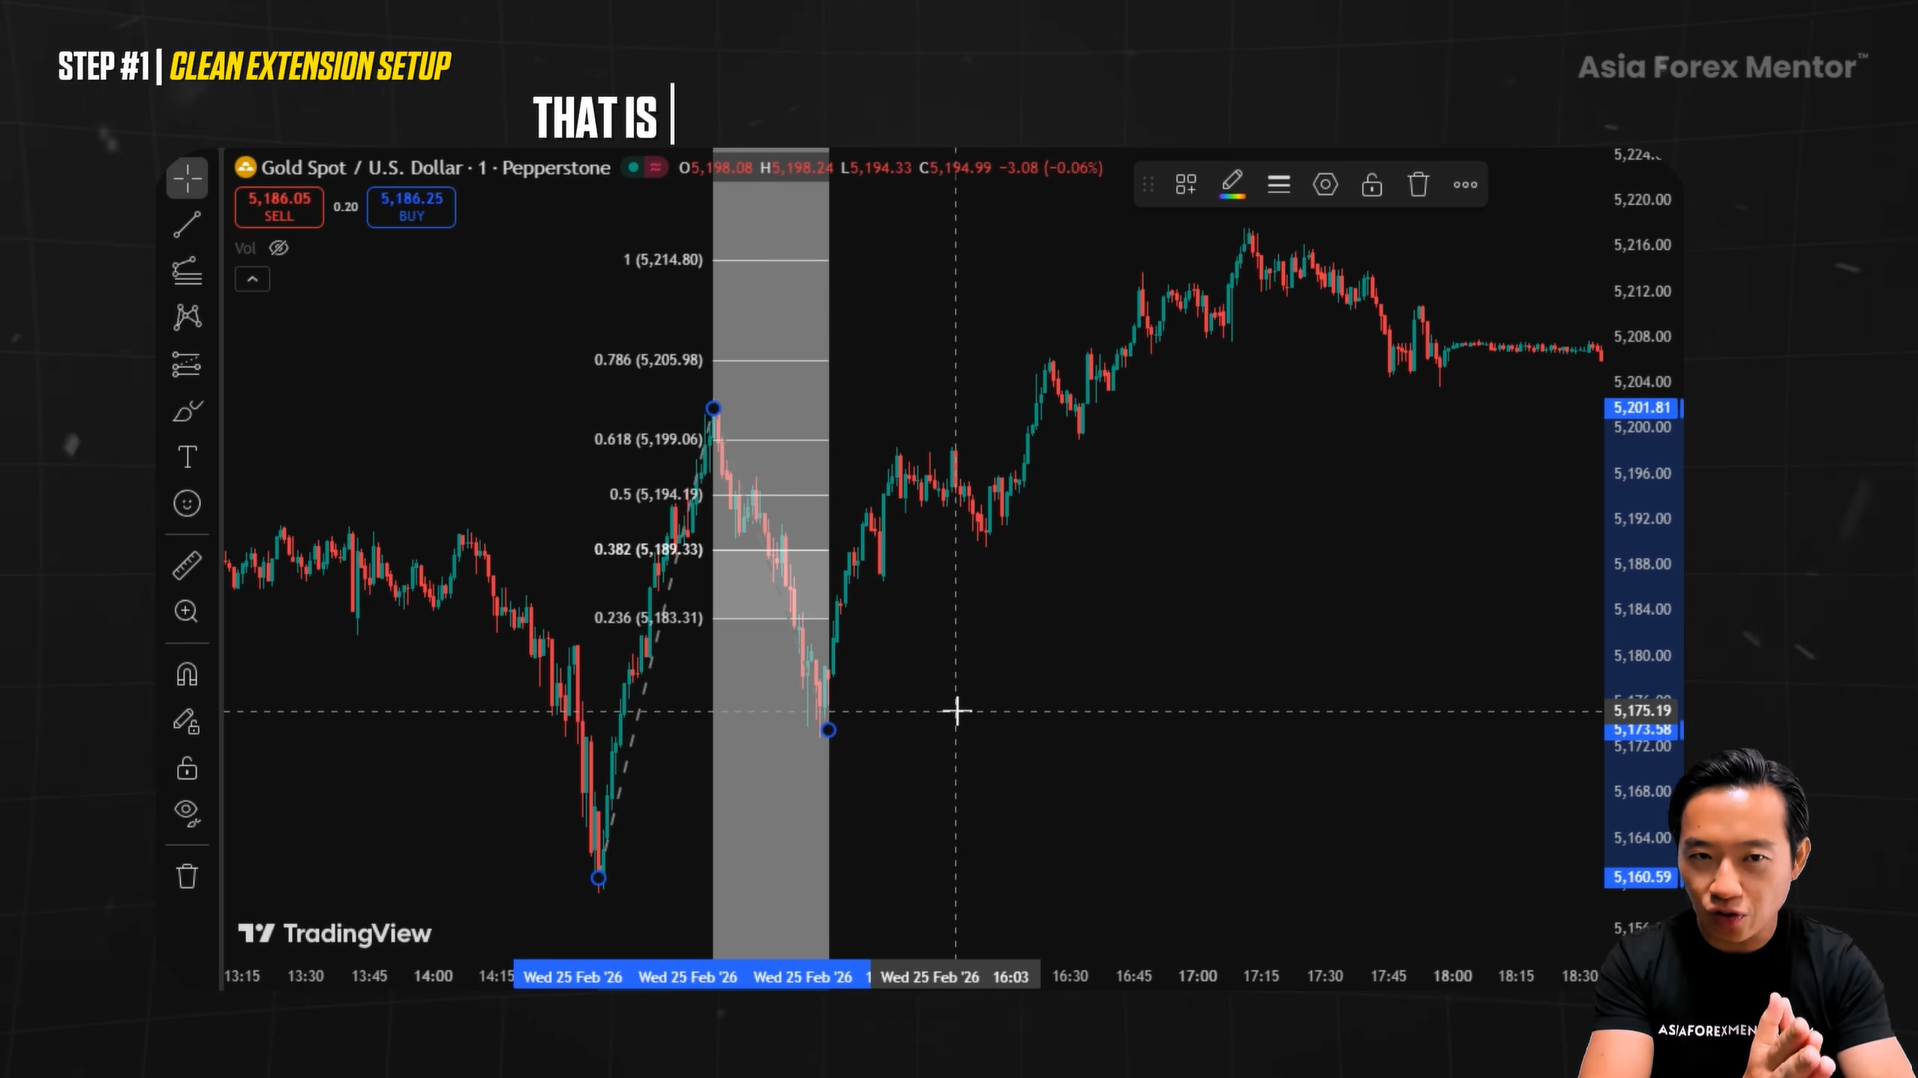
Now let’s make it readable first.
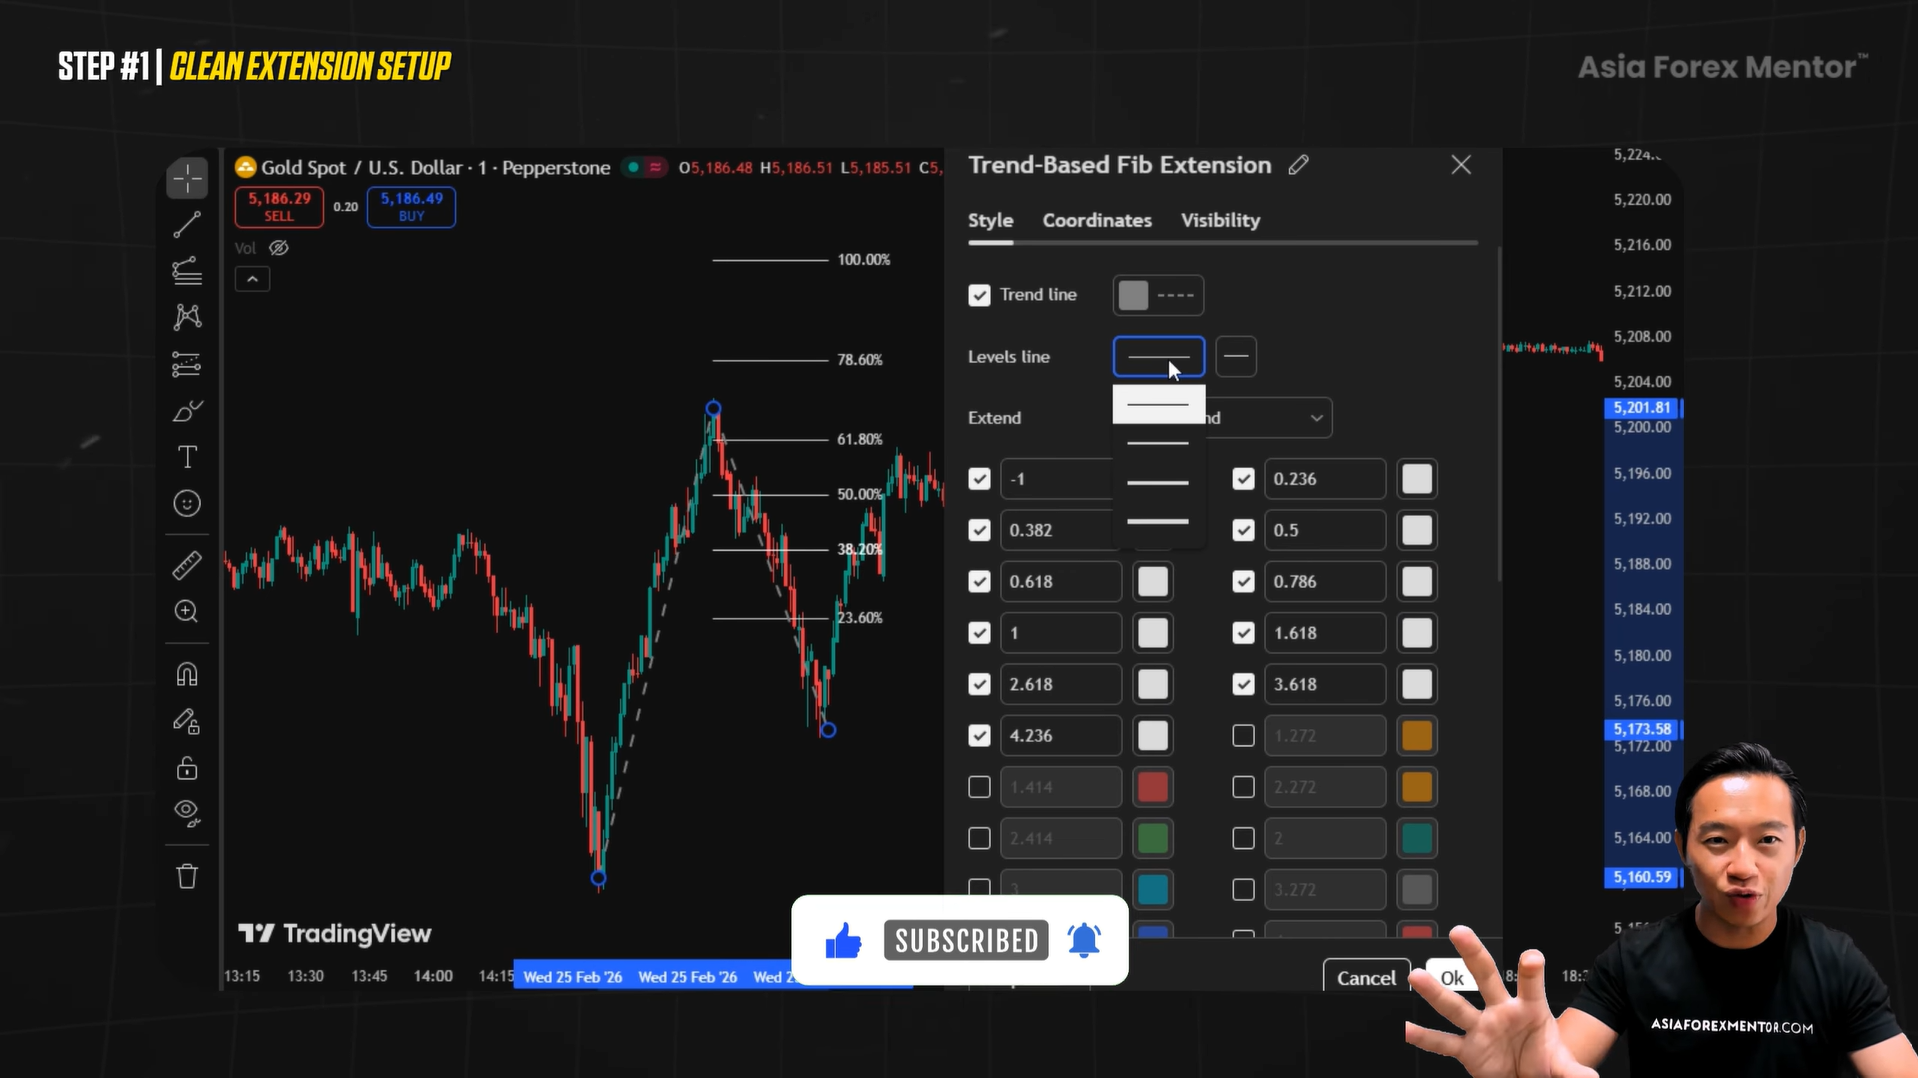
First, strip away all the noise. Delete all the extra levels you are not going to use.
Turn off the background color. You want to be able to see the candles and let them breathe, not hide behind all the colors.
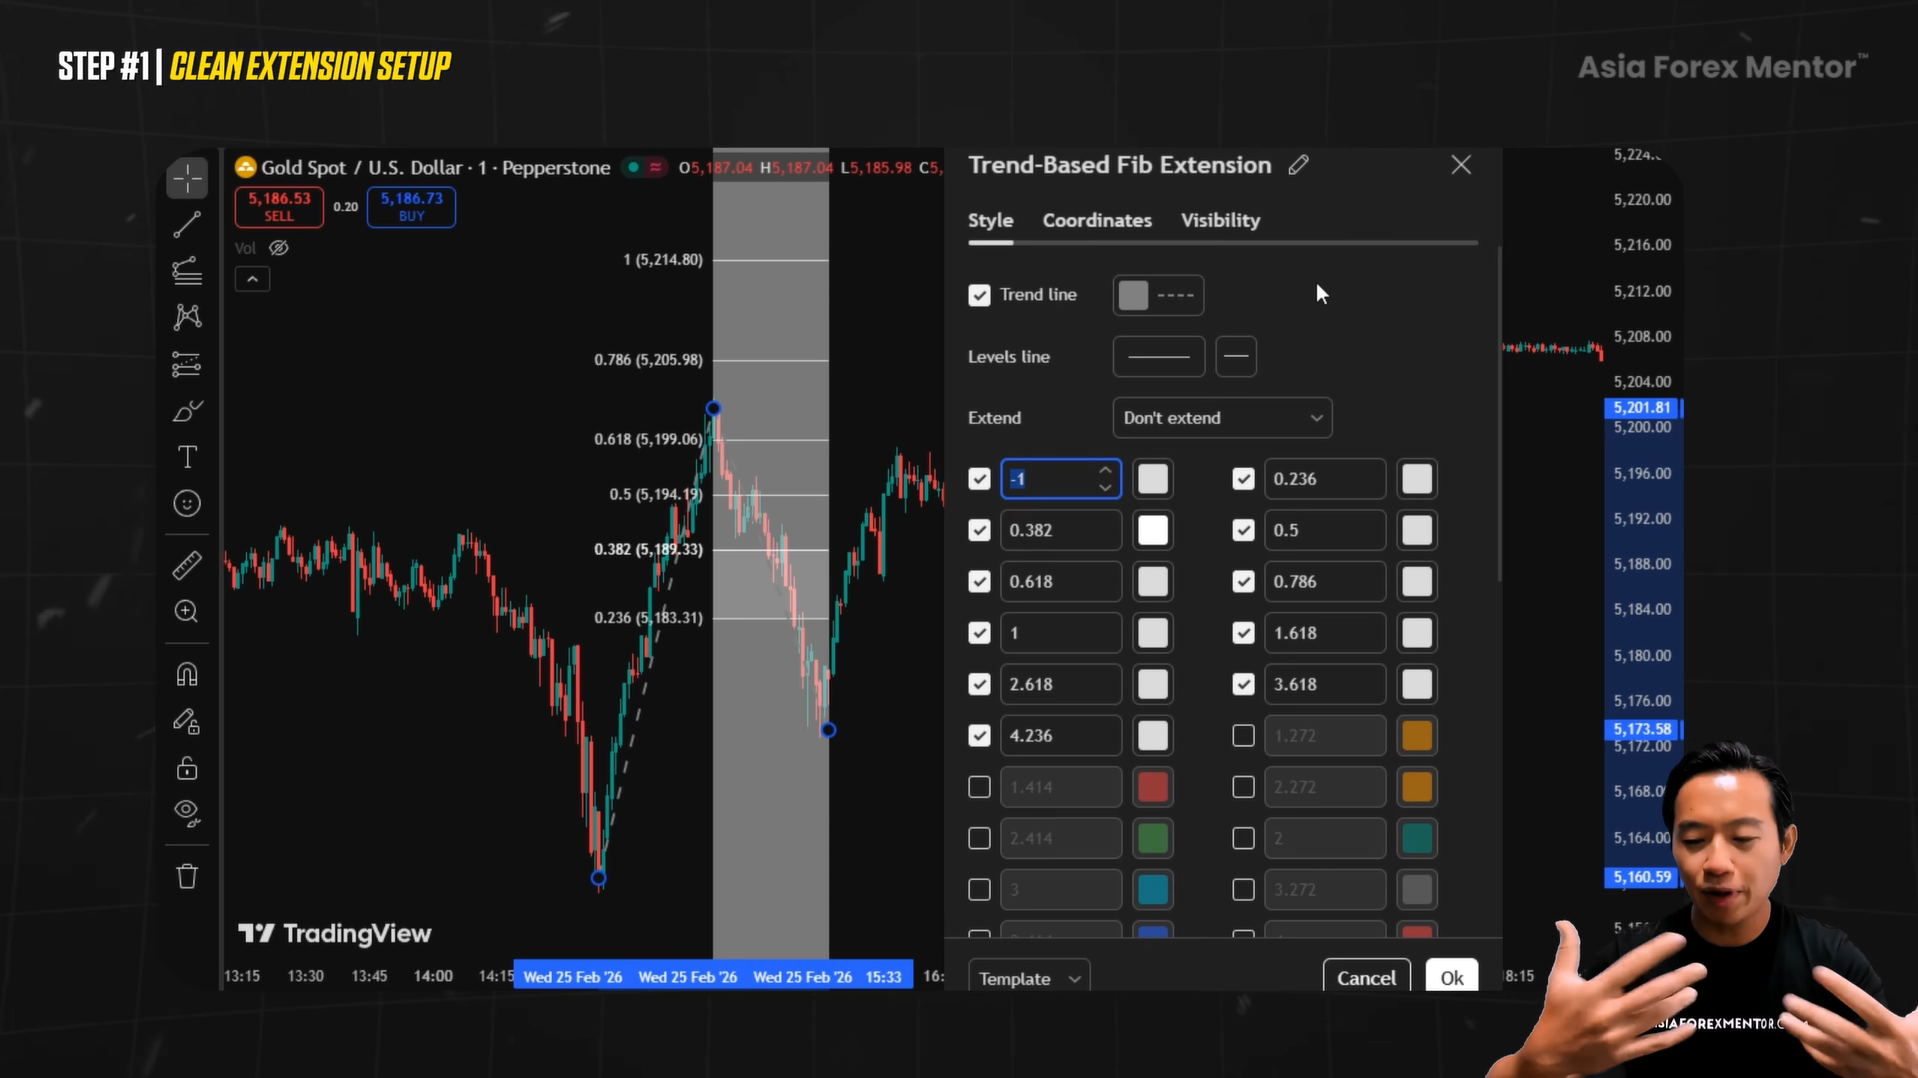
Uncheck the prices too if you are using TradingView. You do not need distractions floating all over the chart.
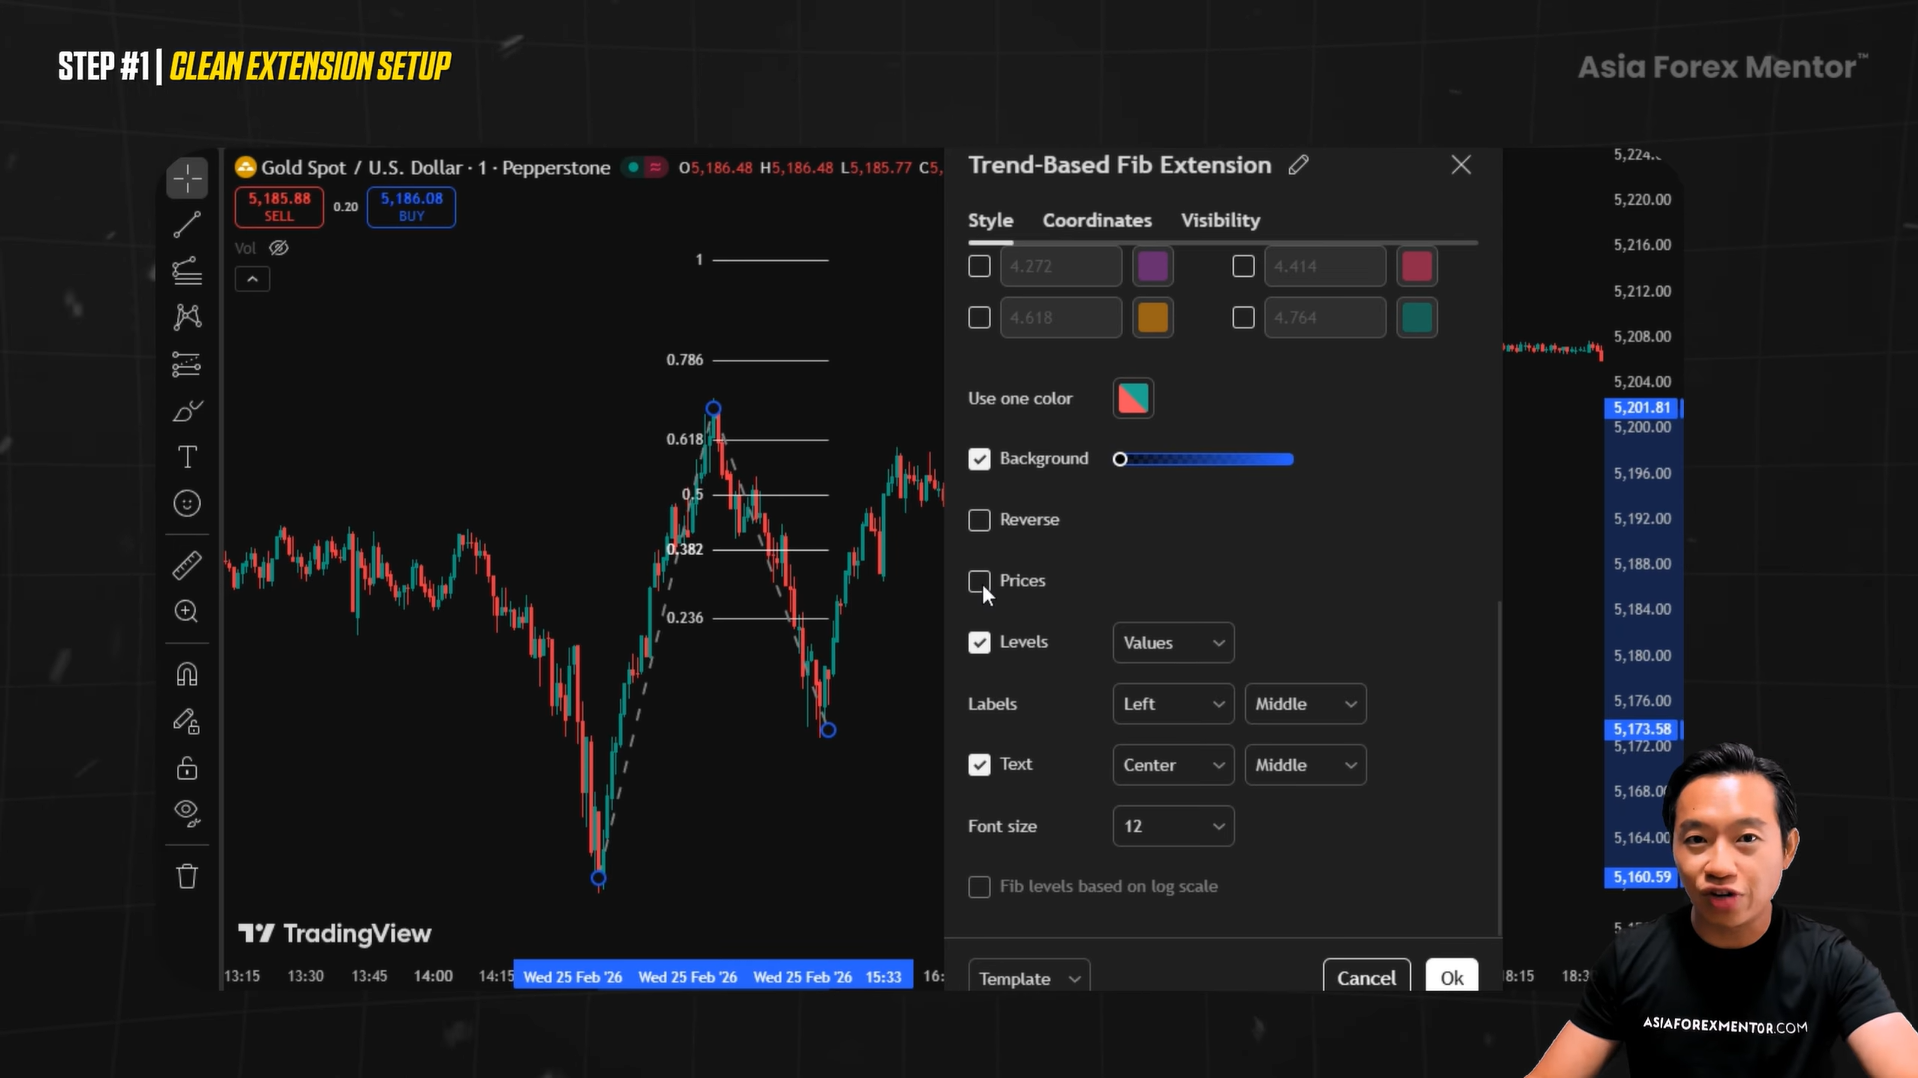
Next, switch the values to percentages, which is easier to read in real time.
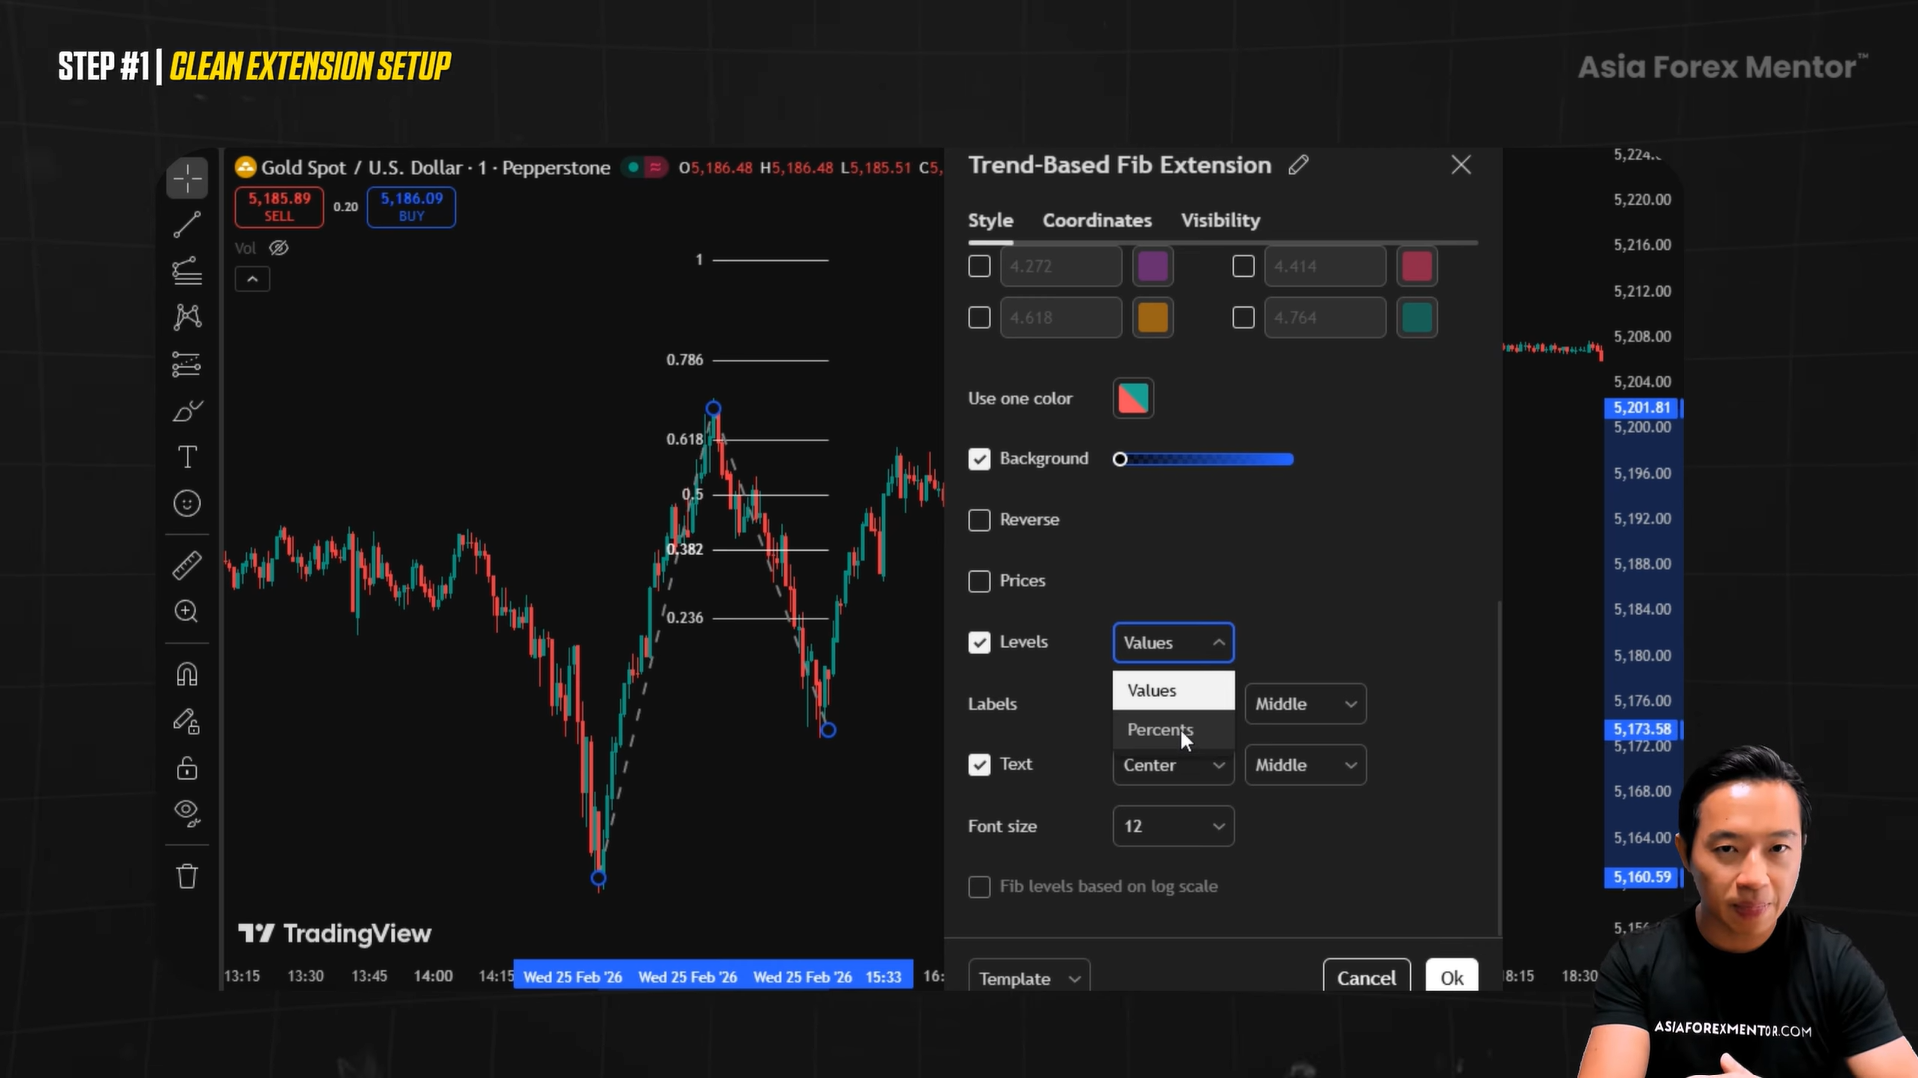
After that, move the labels to the right-hand side of the chart. That is exactly where your eyes are going to expect them to be.
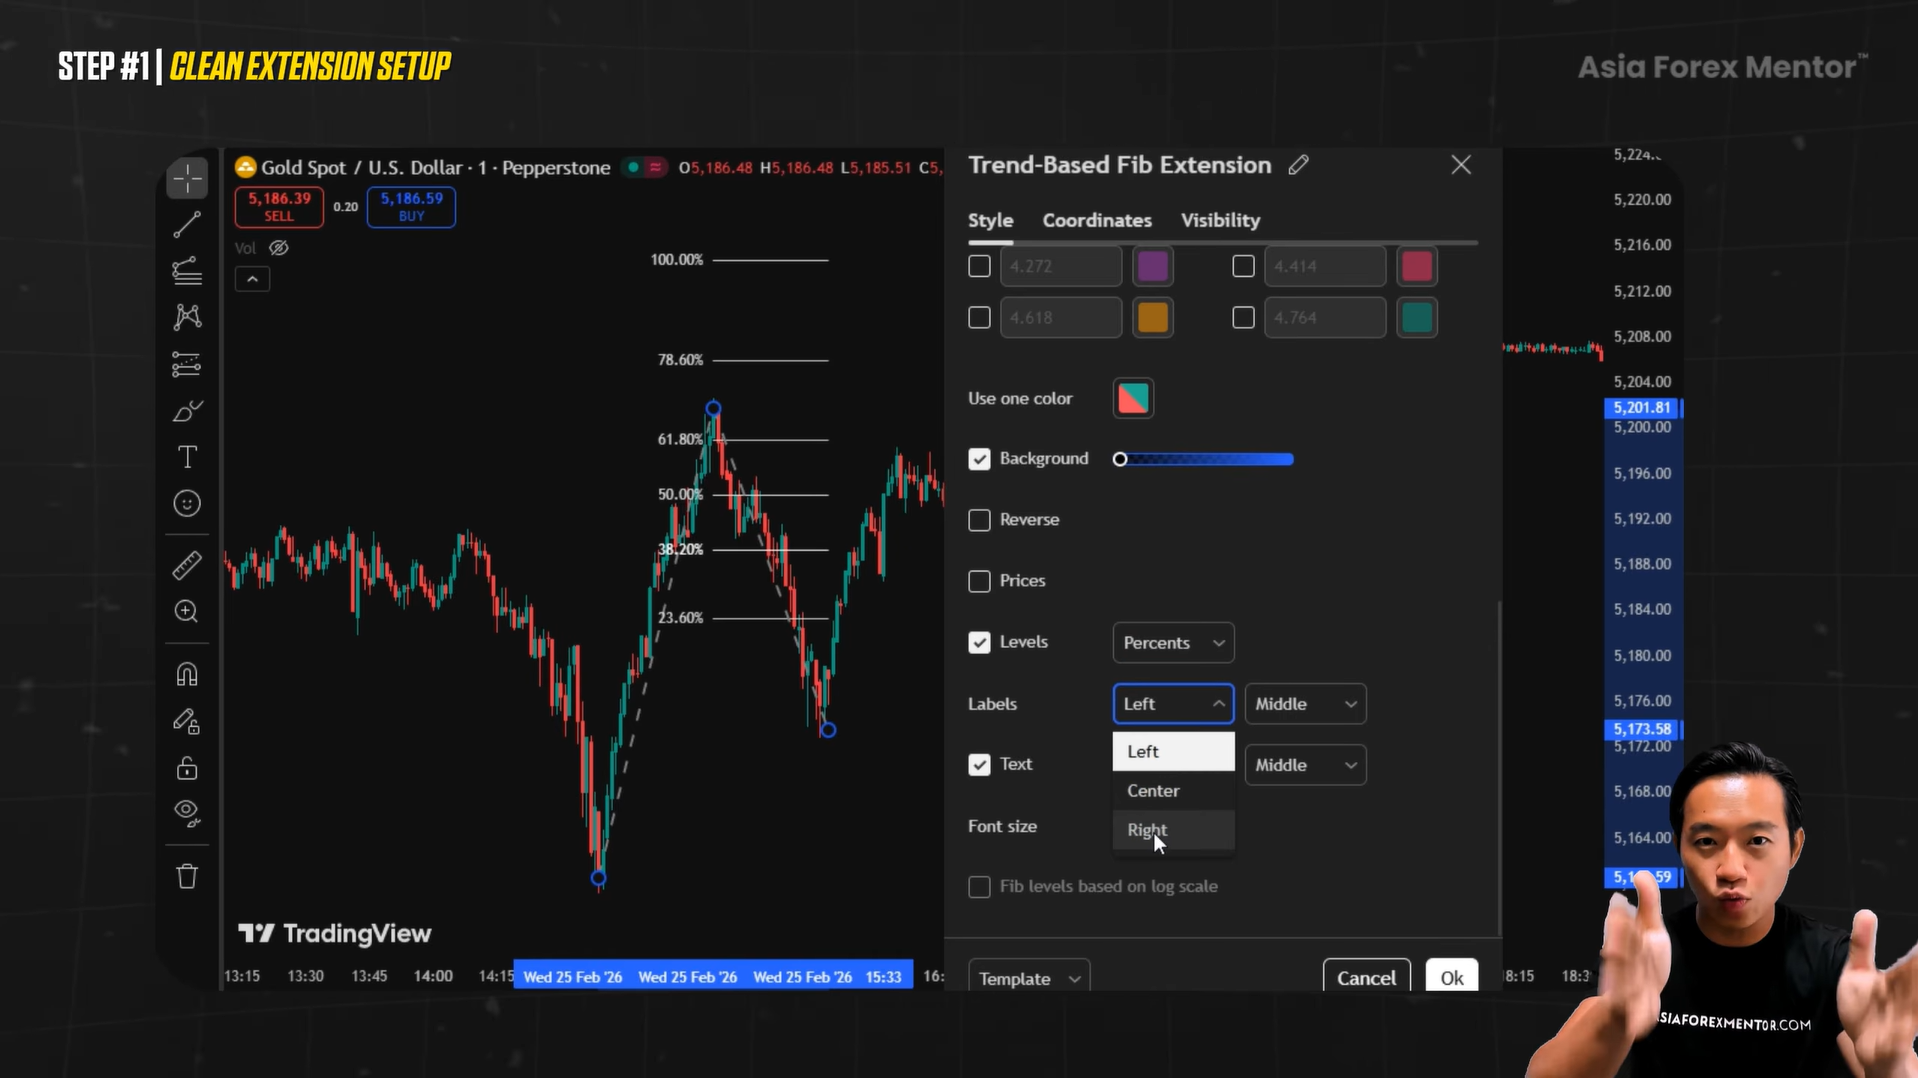
Adjust them so they sit right beside each line. If you want to, you can bump up the font size so that it is clean enough. You can make the line thicker as well.
When all this is set up, it gives you confidence and clarity in the market.
One-time setup. Permanent setup.
Now it is time to use it properly.
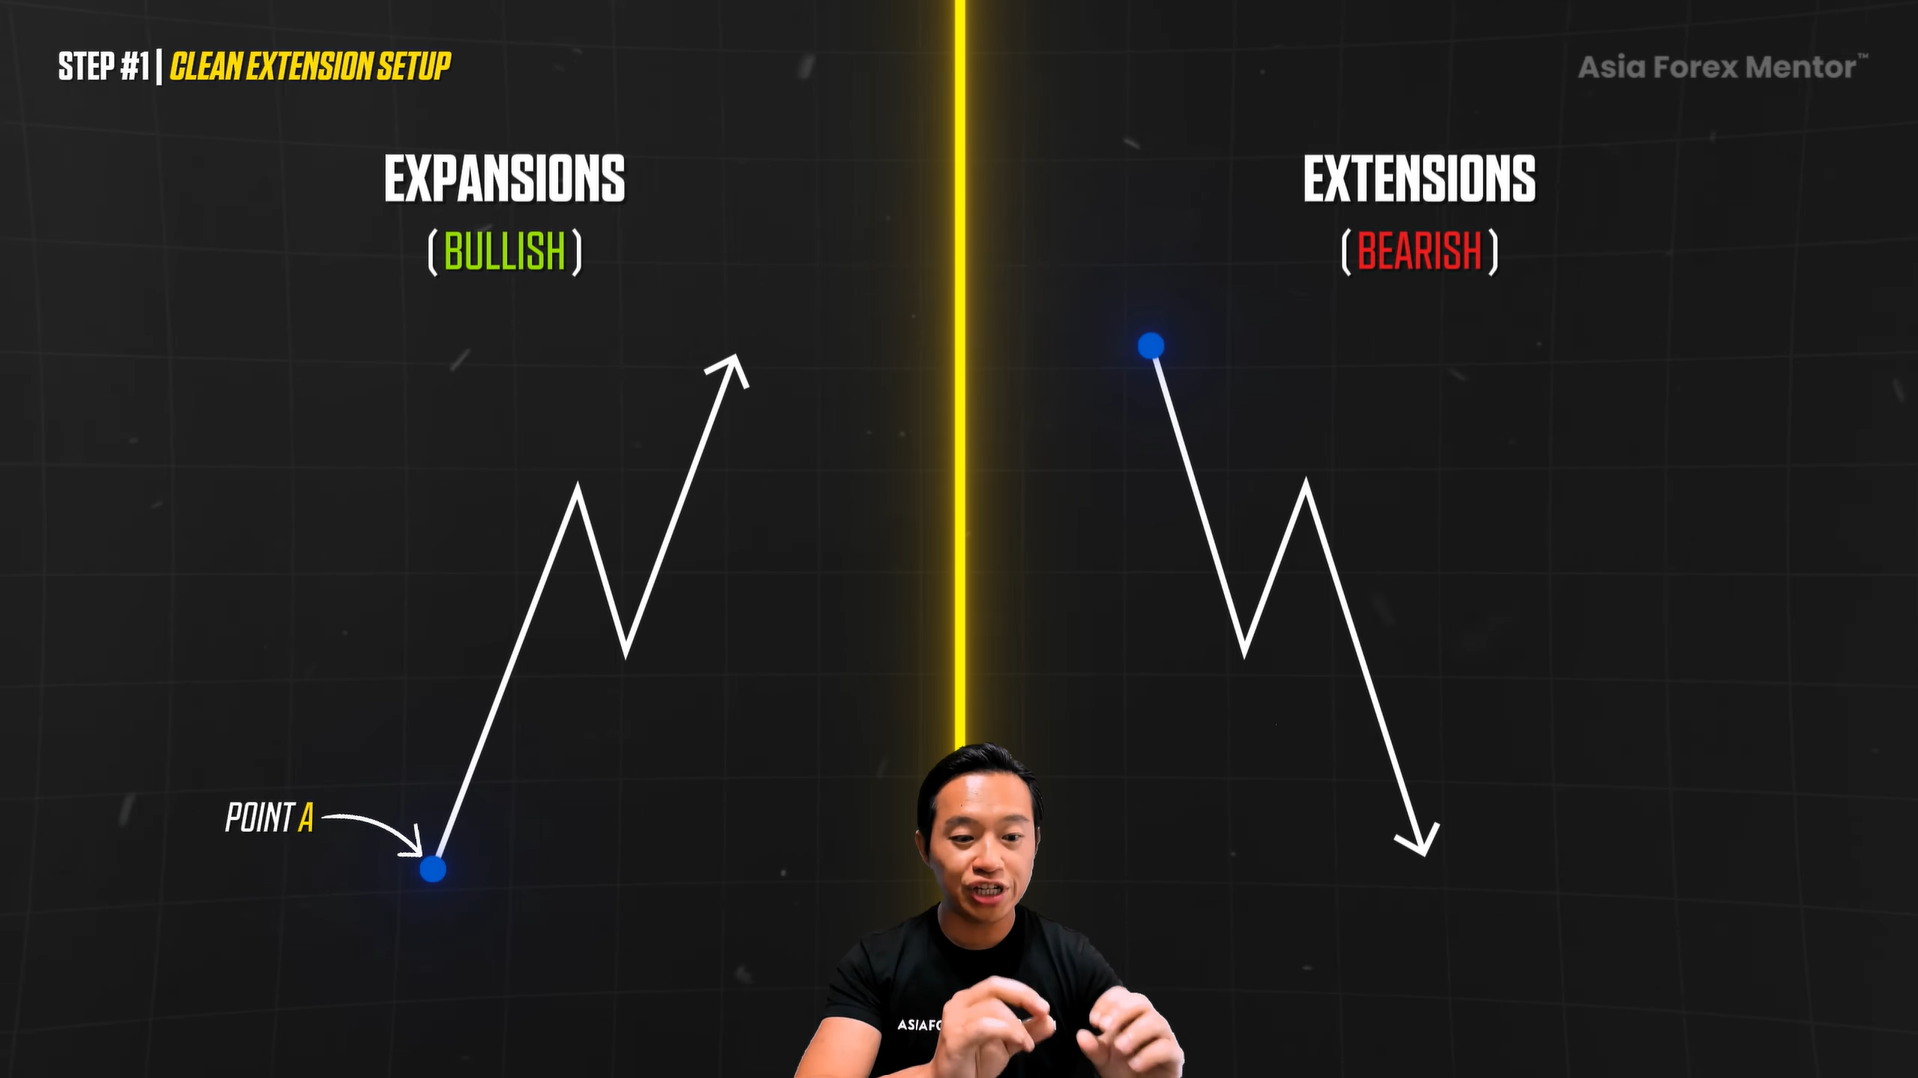
Everything begins with identifying your impulsive move, which is the strong directional move that tells you where the momentum lives.
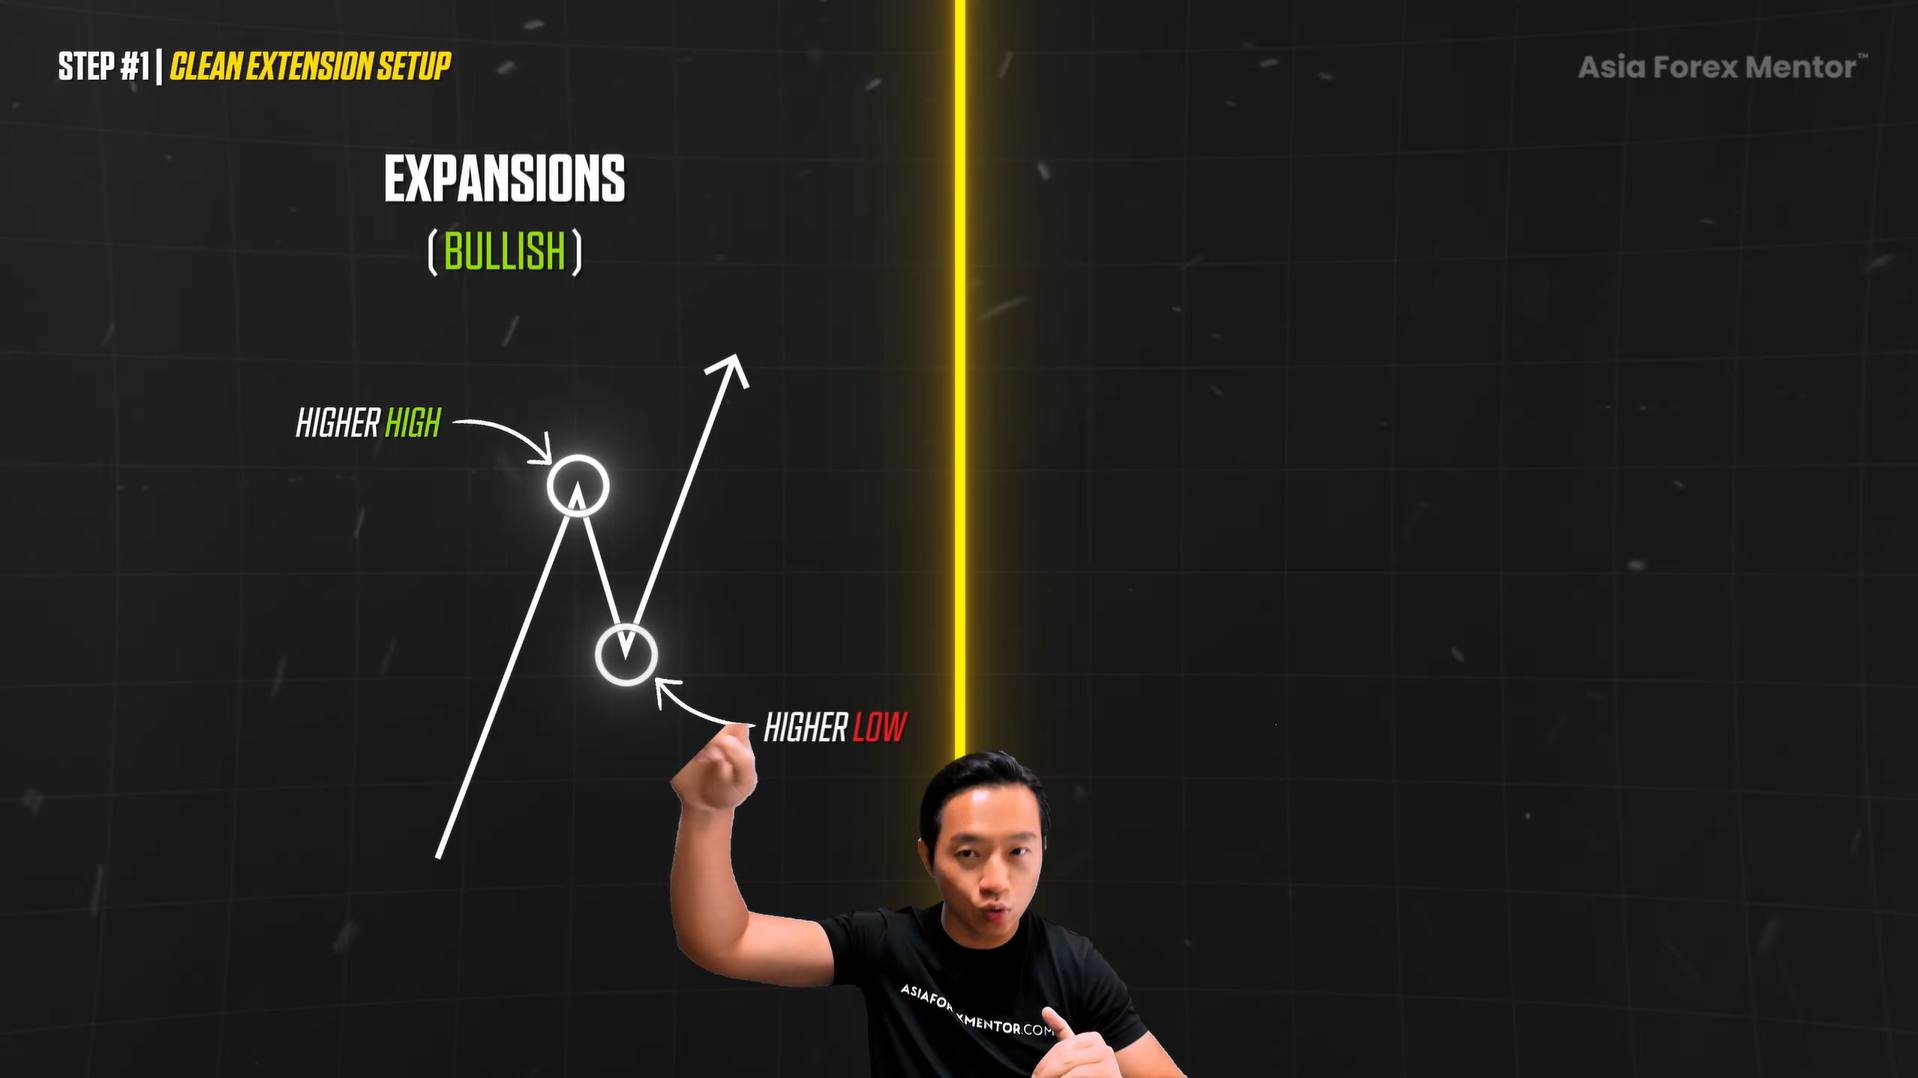
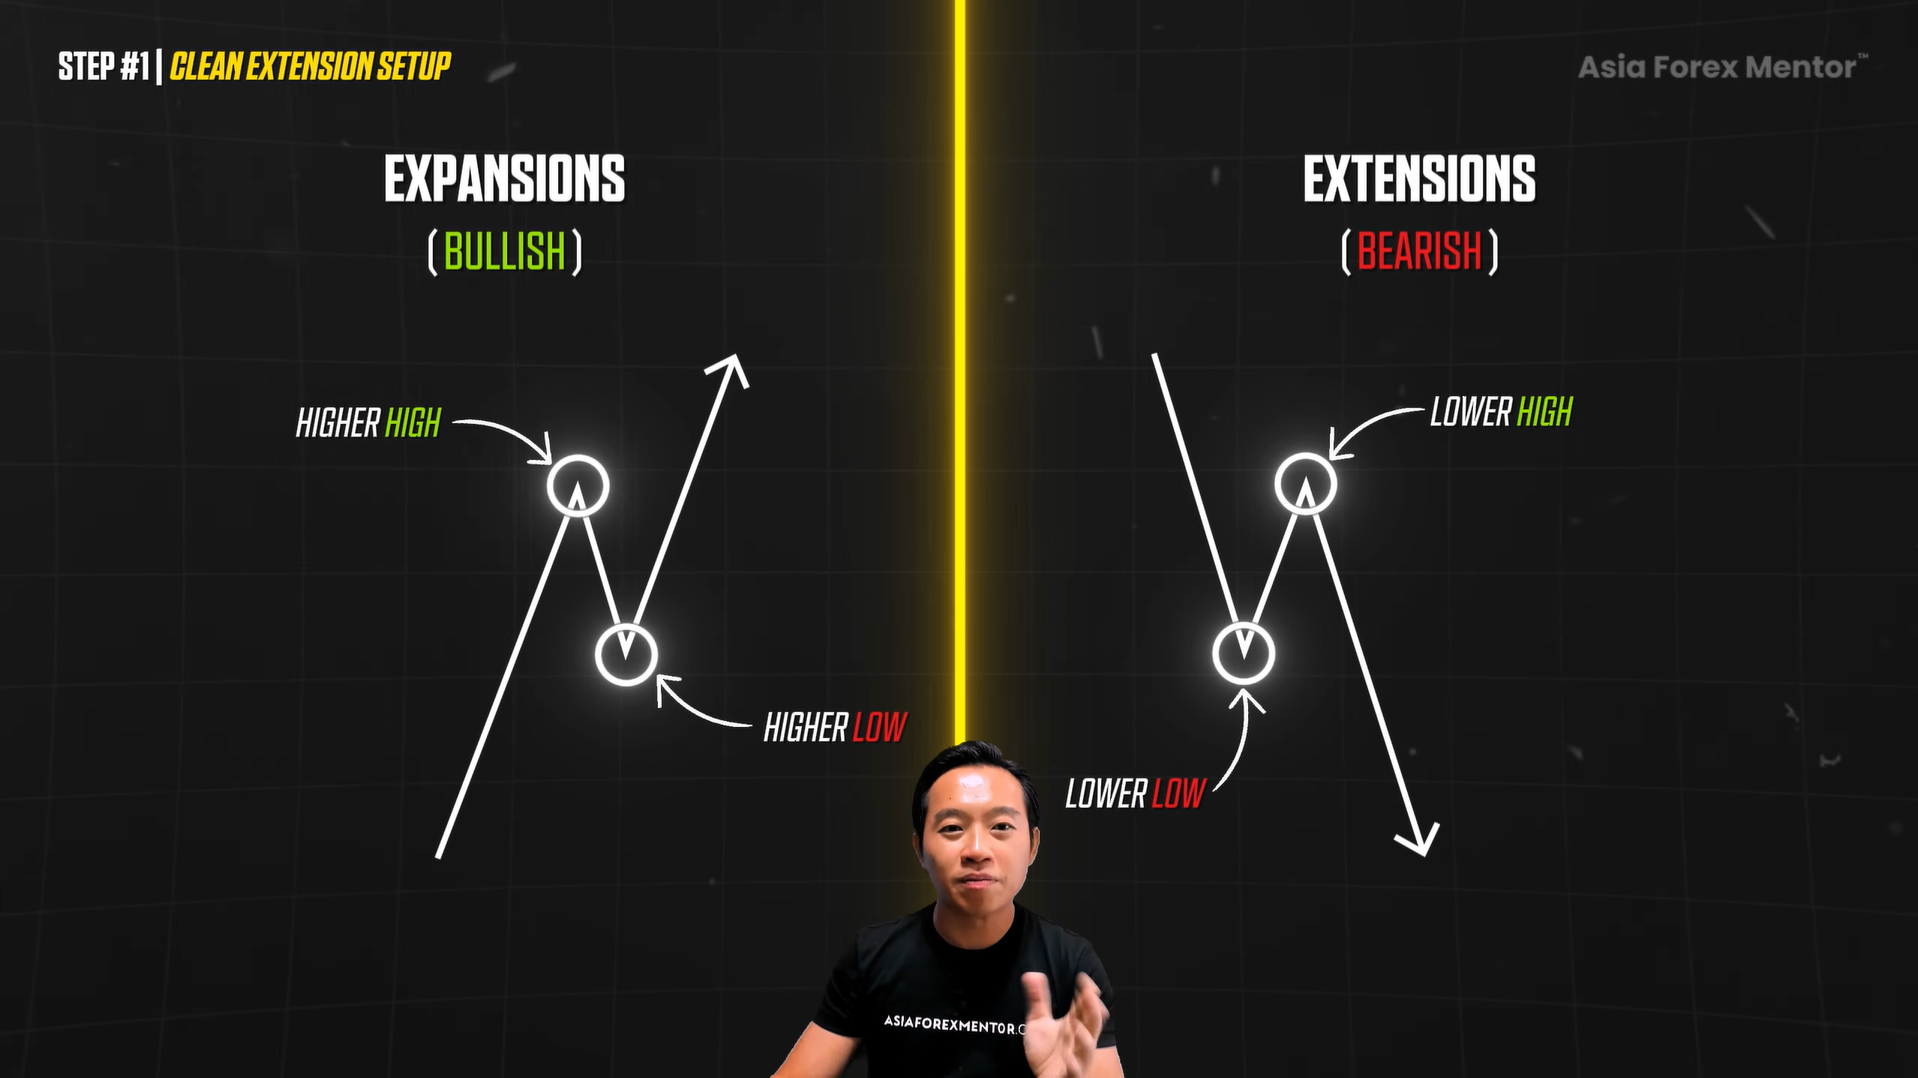
In a bullish market, price forms higher highs and higher lows.
In a bearish market, it is the reverse. Lower highs and lower lows.
When you spot the impulse, it is time to anchor in your Fibonacci.
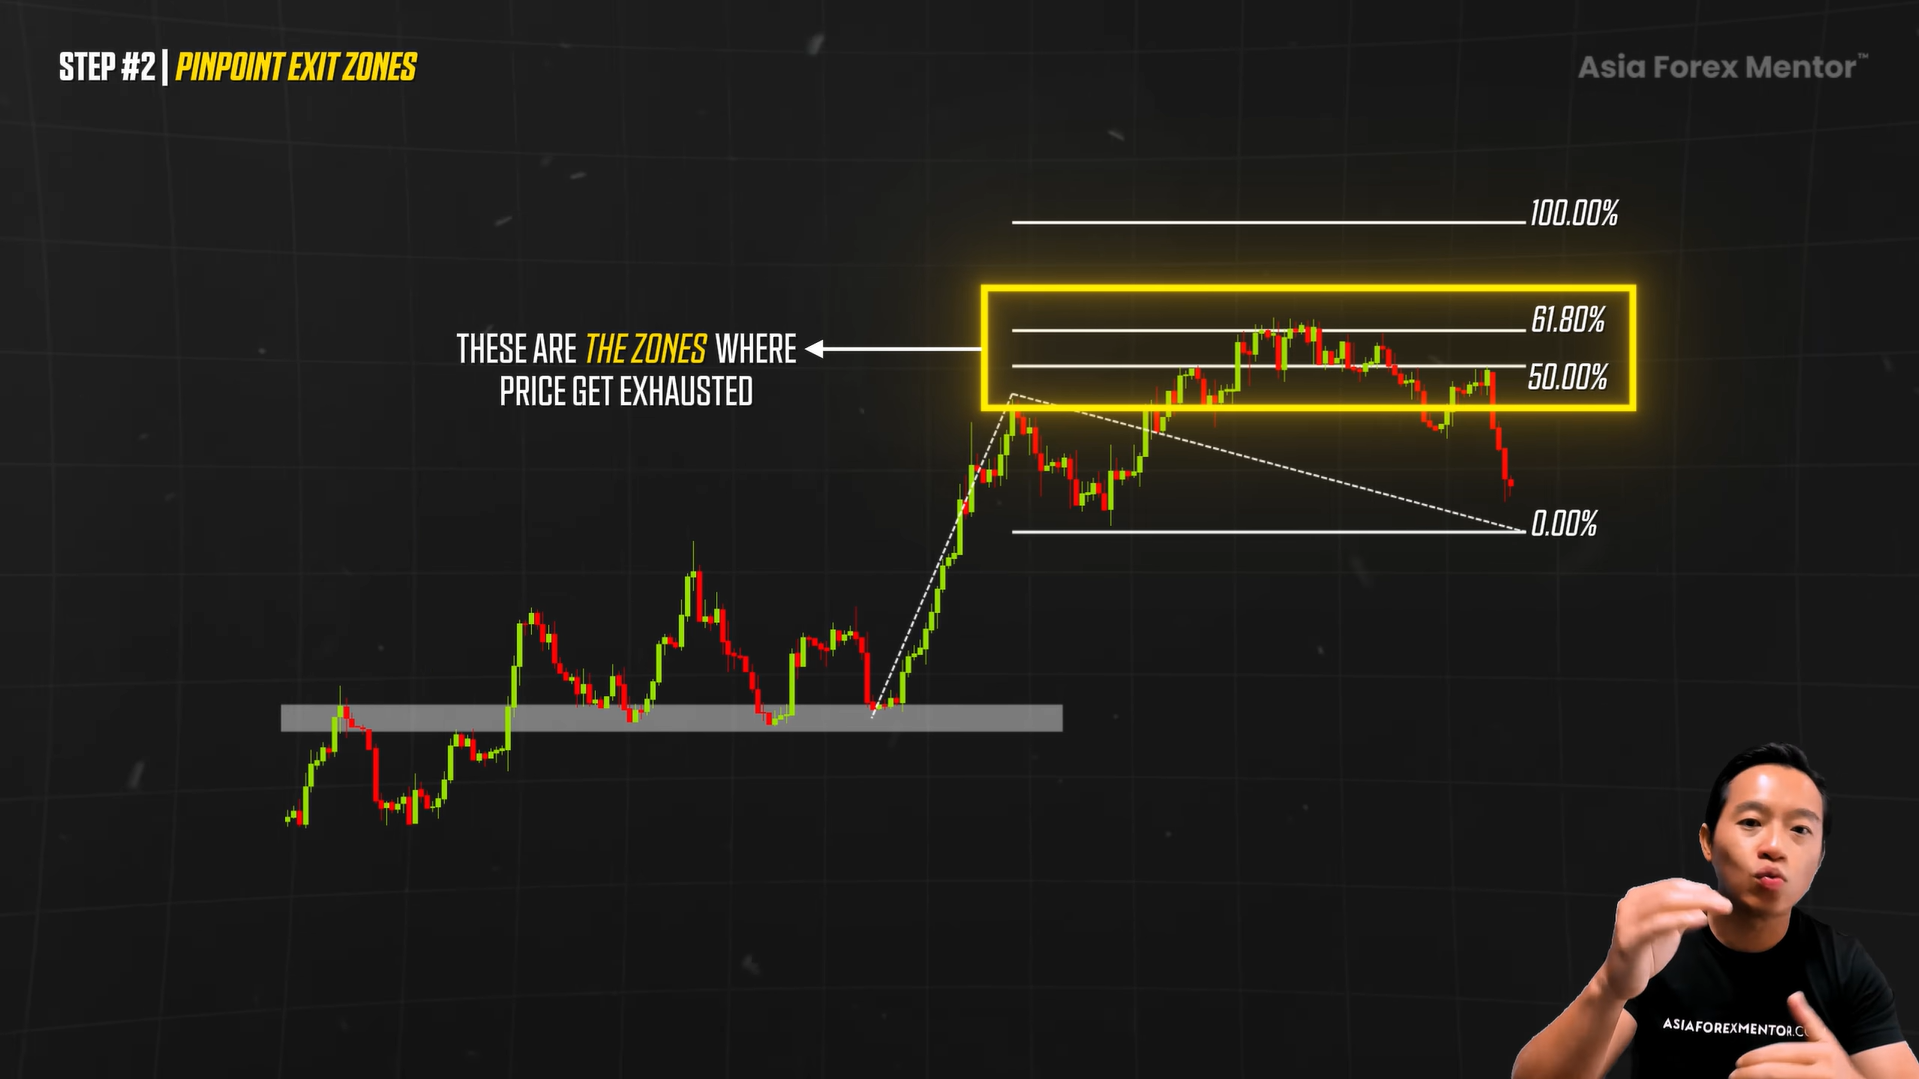
Start with point A, which is the beginning of the impulsive move. This is where the original movement, the origin of where the momentum first starts.
Then place point B at the end of that impulse, the peak, before price pauses.
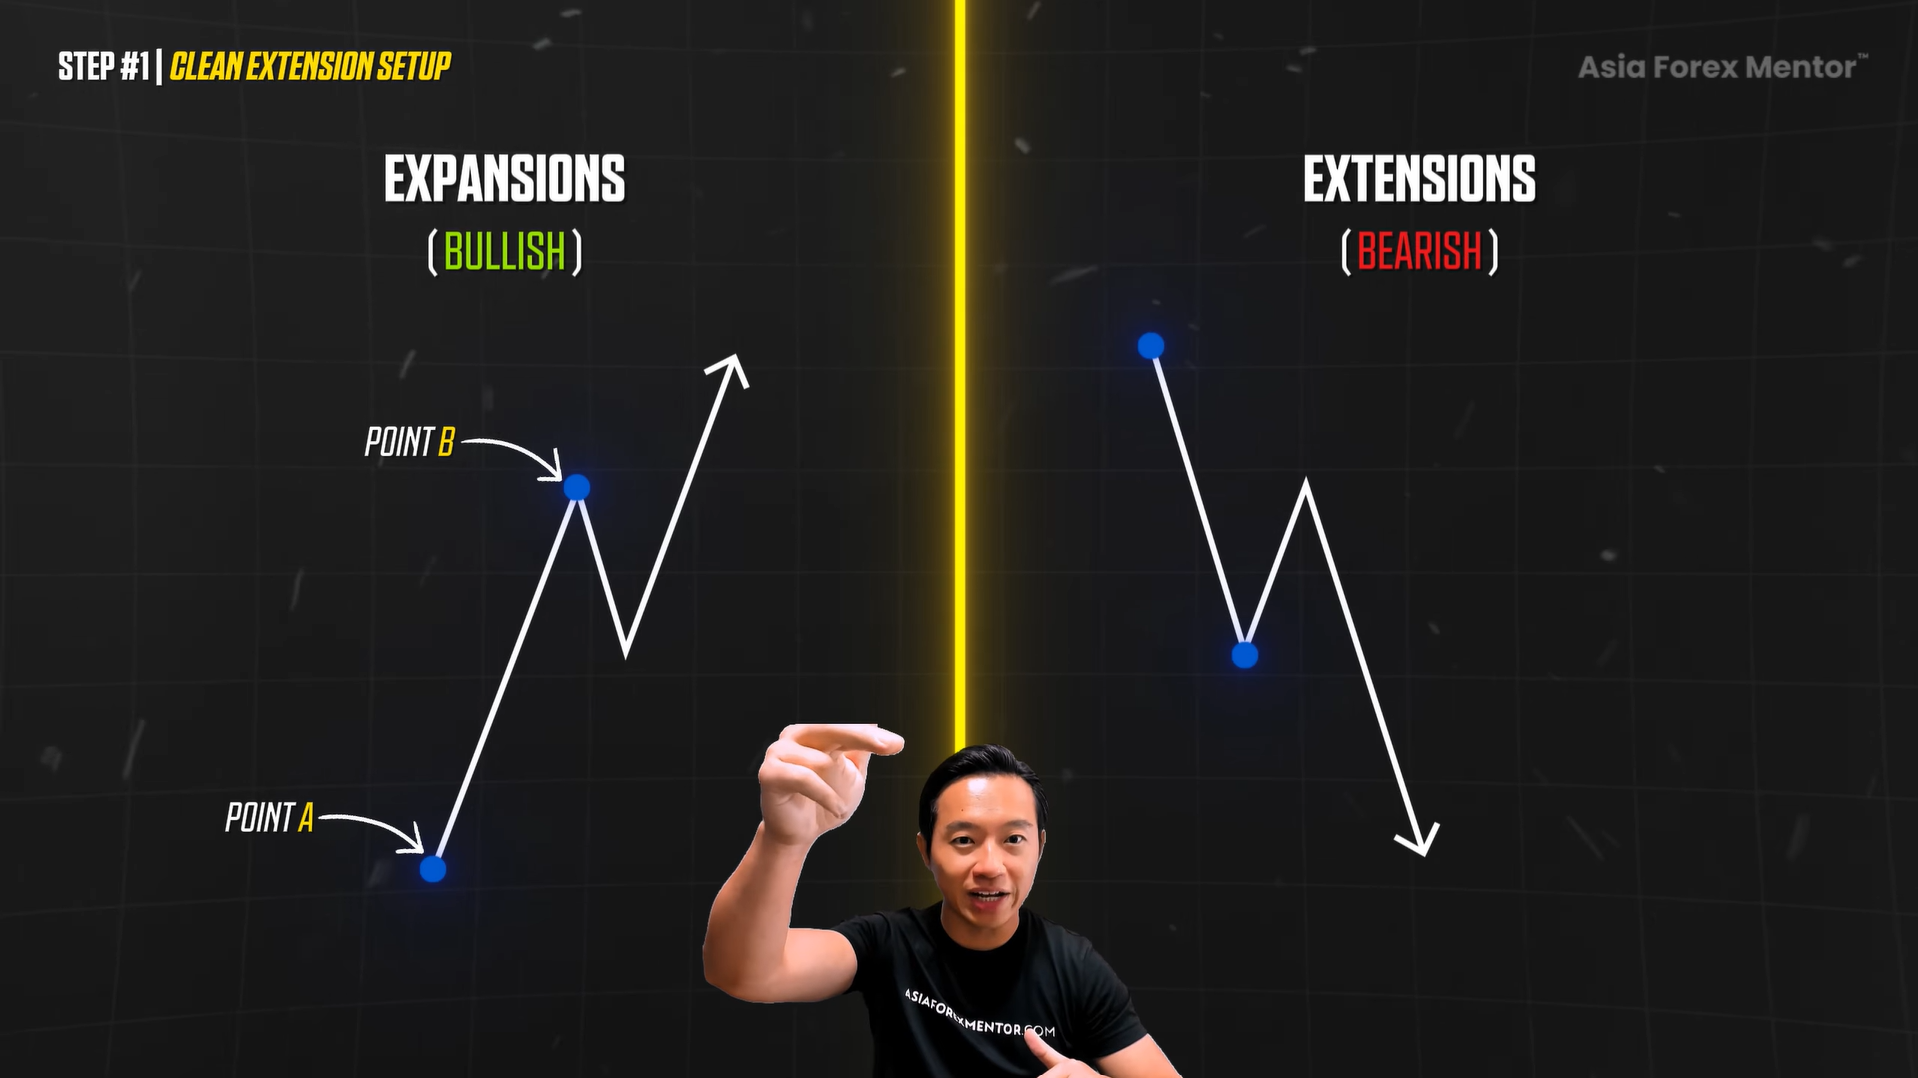
Then the next point is point C. Unlike expansions where you can snap back to previous highs or lows, for extensions, you anchor point C at the end of the corrective wave, the bottom of that pullback in a bullish move or the top of a bearish one.
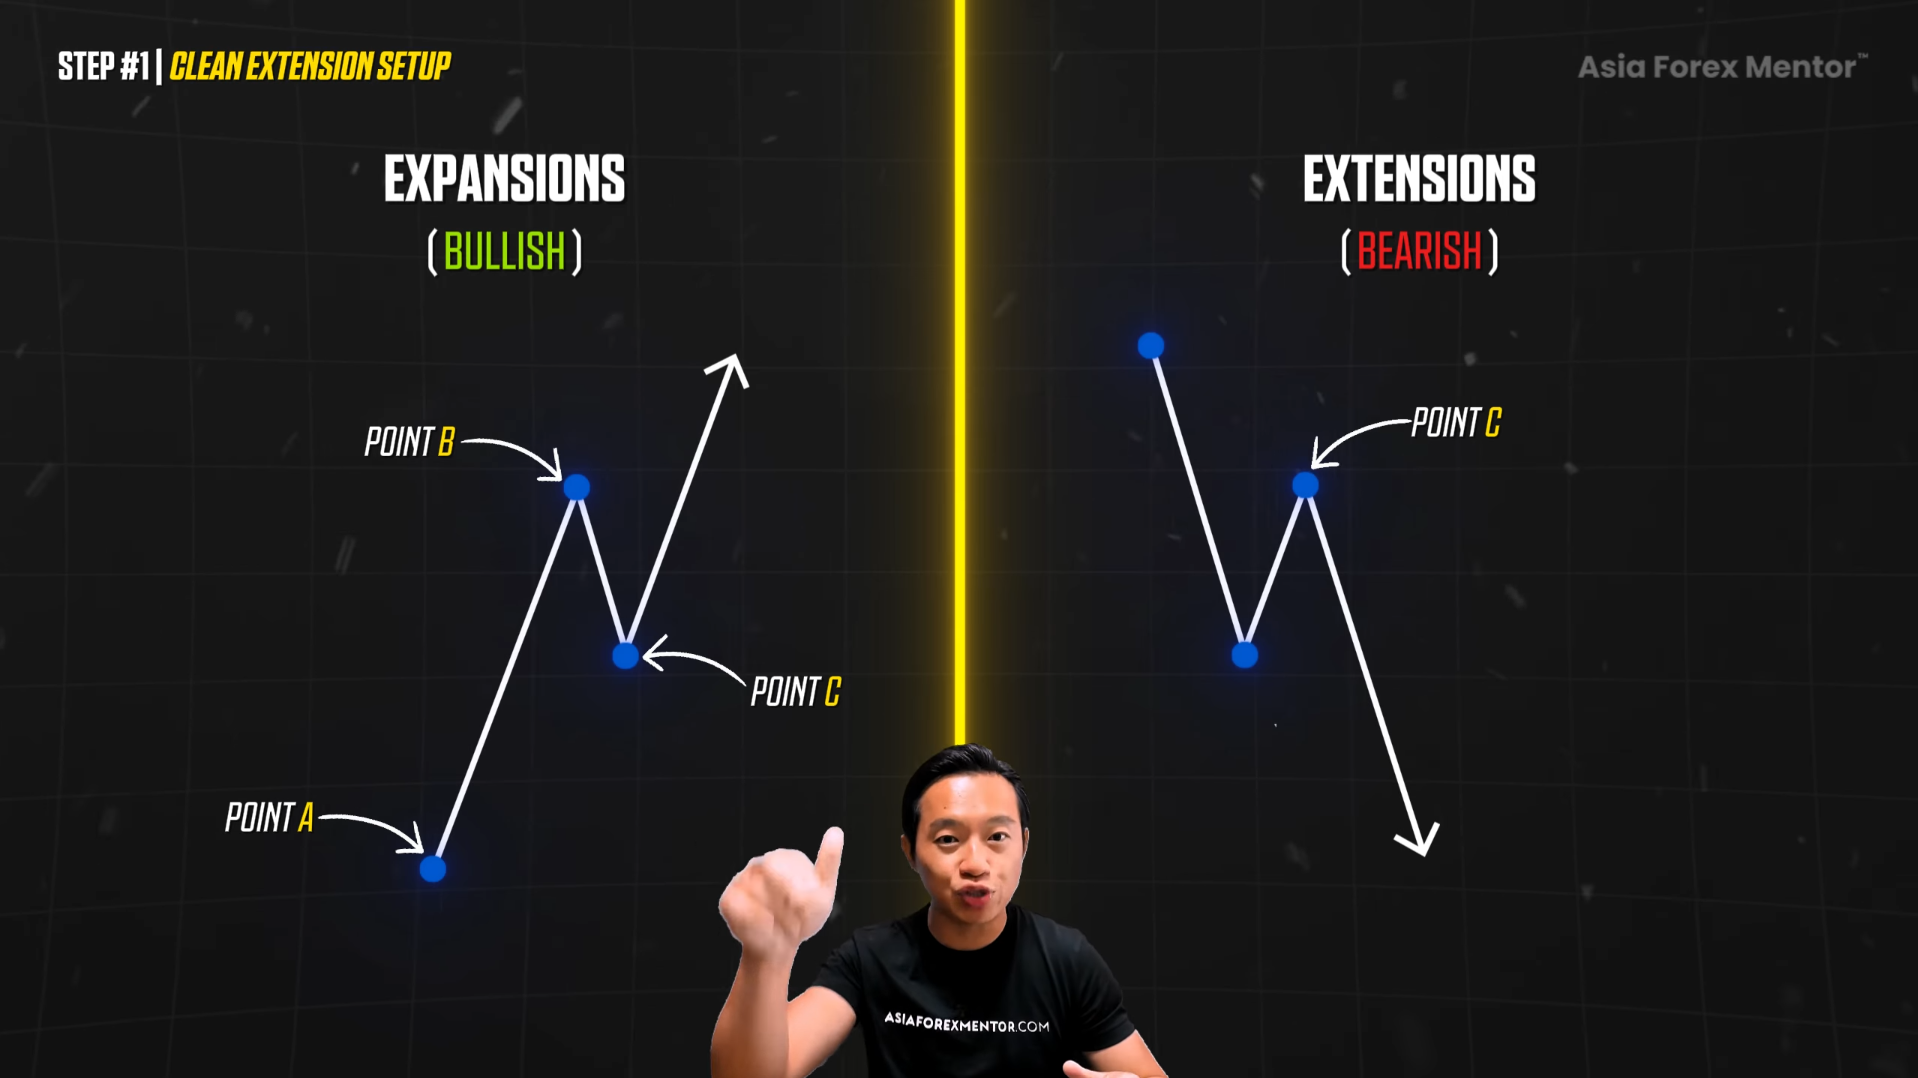
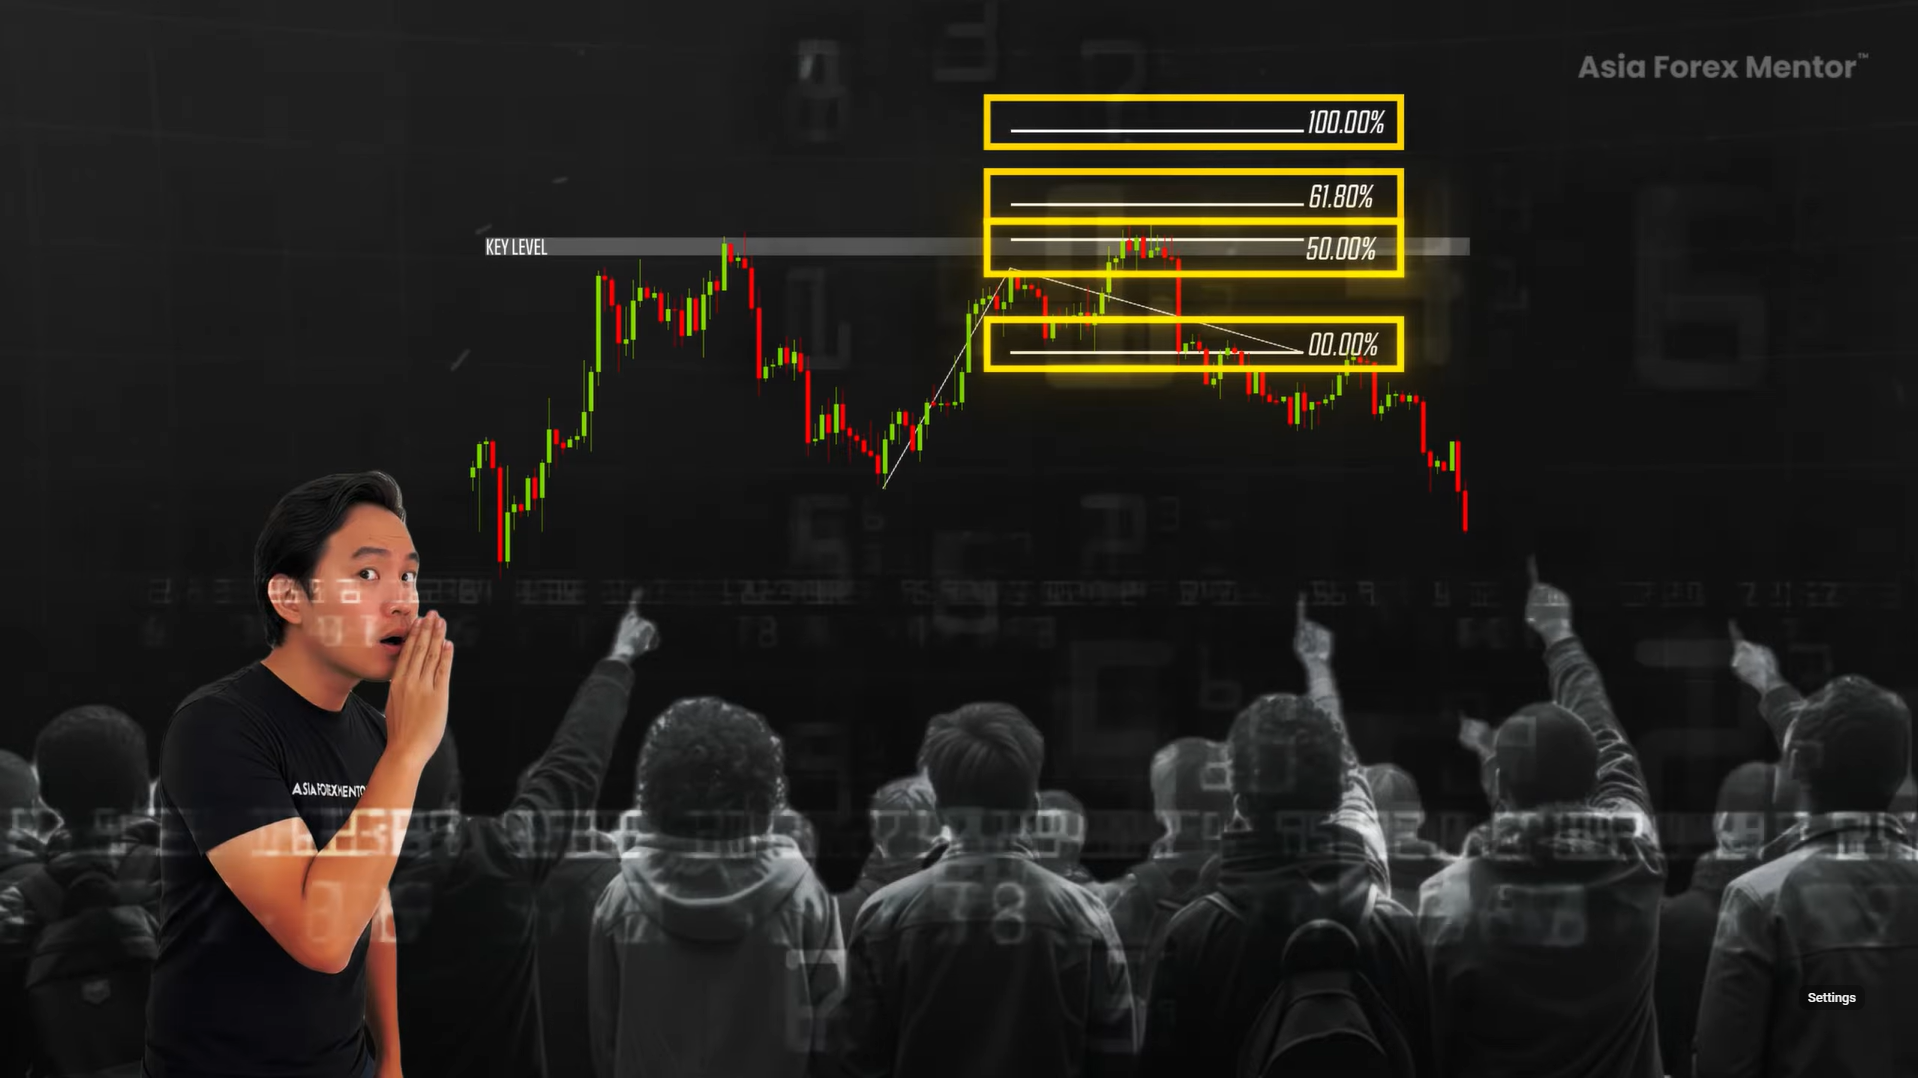
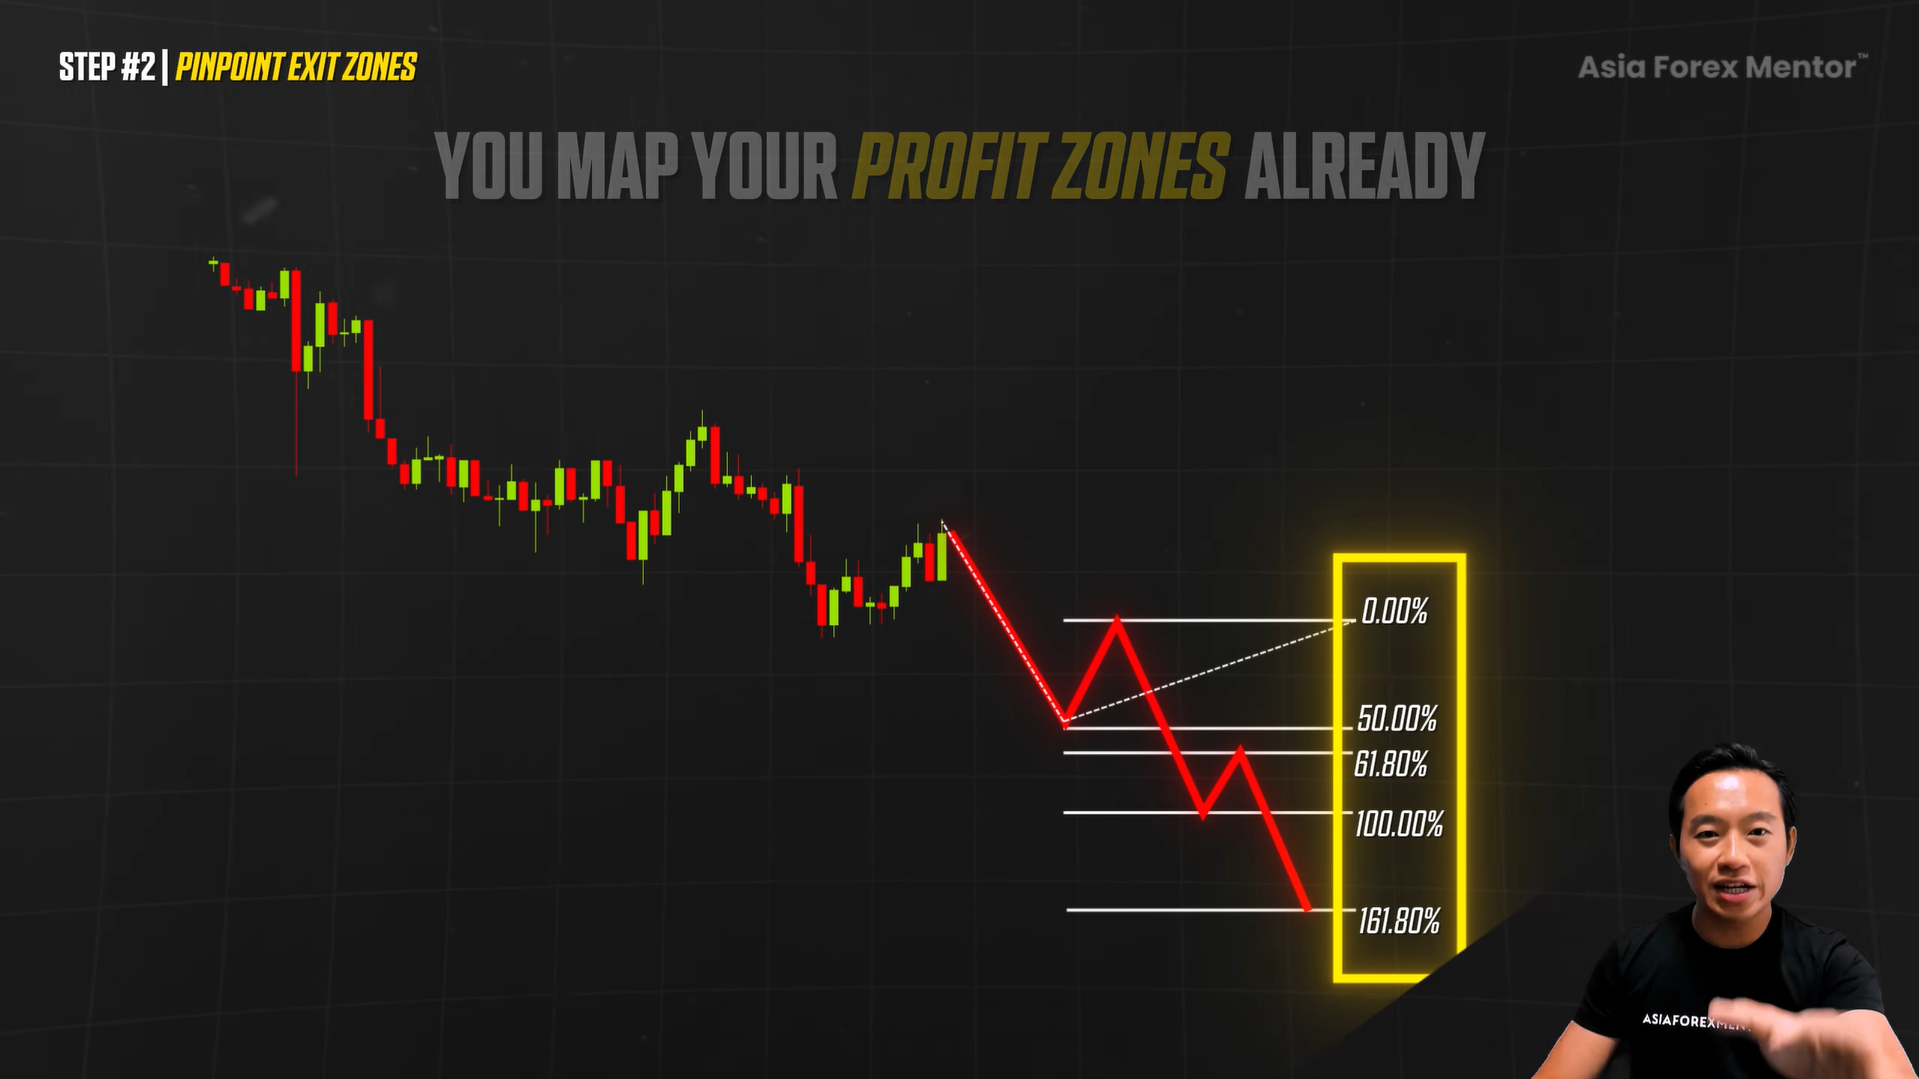
Now that these are drawn correctly, the key zones are the 0%, the 50%, the 61.8%, and the 100%.
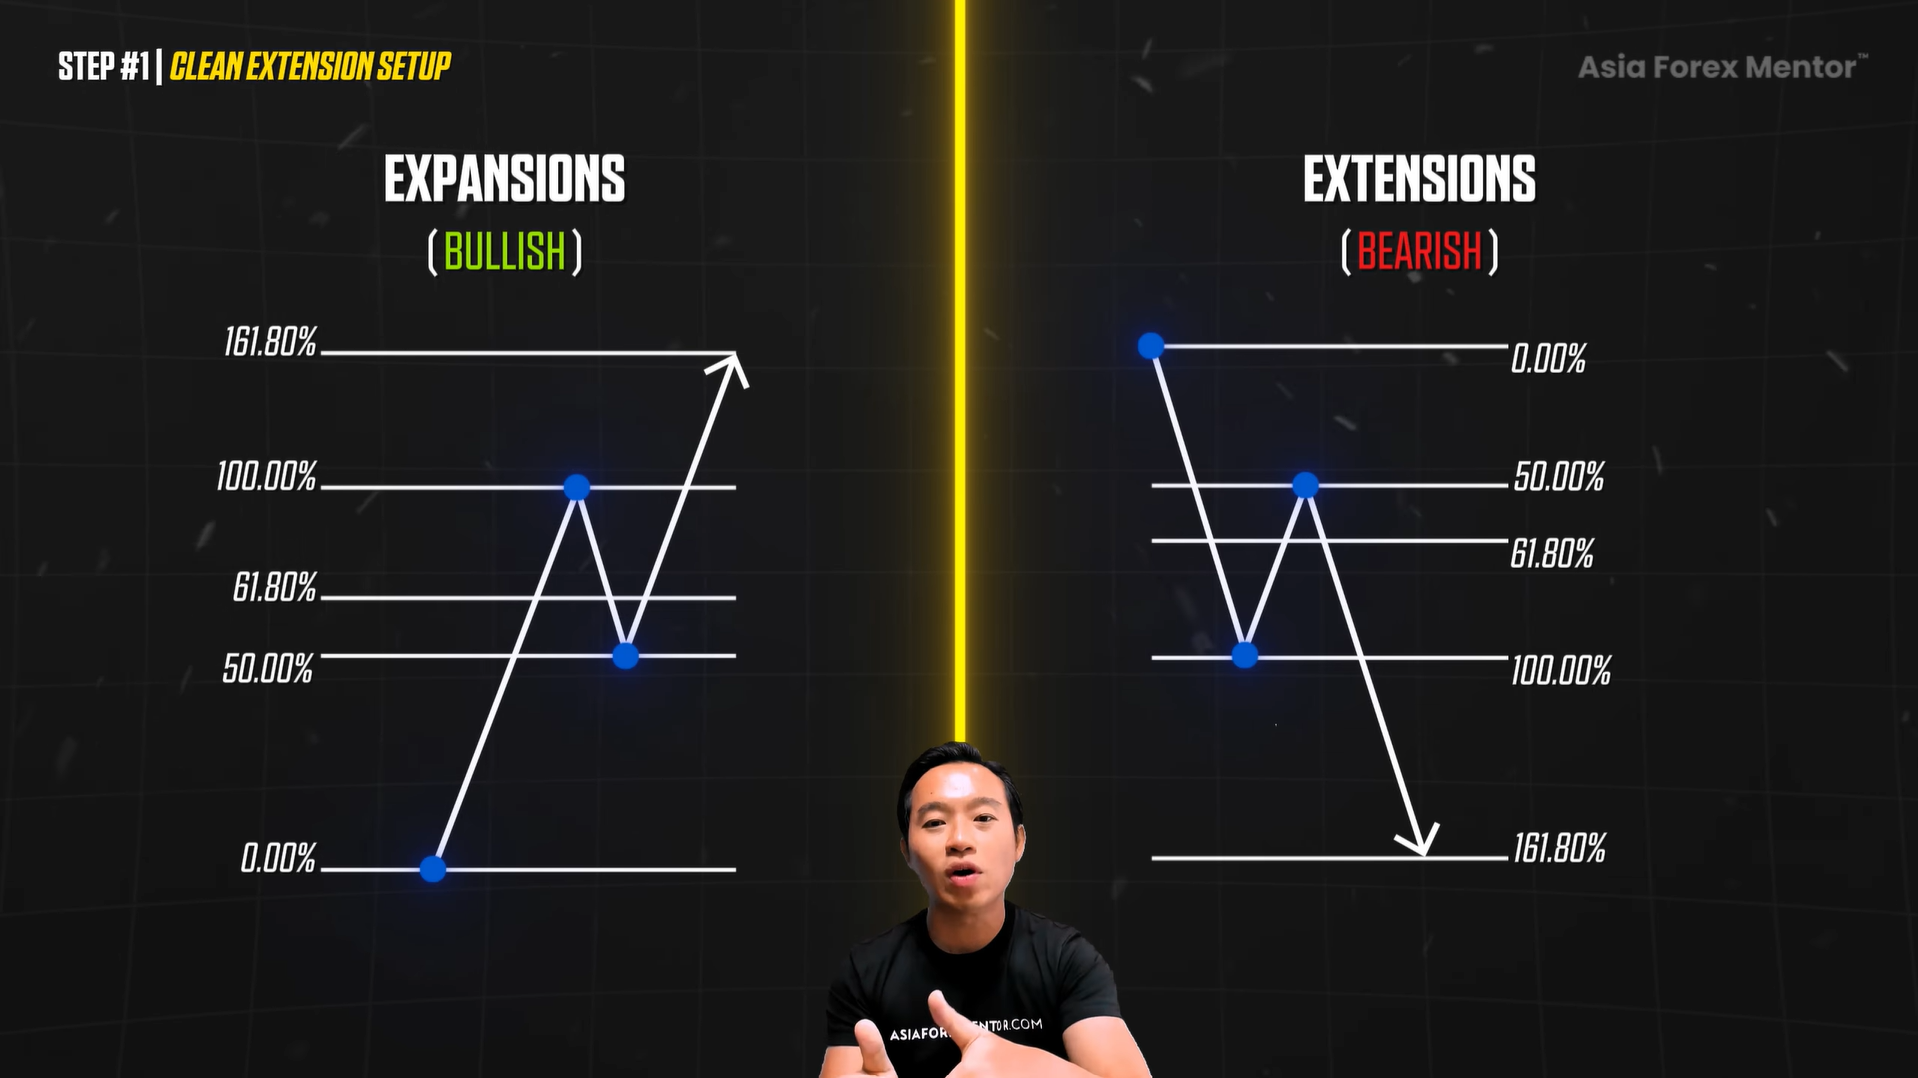
These turn all the random numbers you see on a chart into logical price targets.
These are the zones where professionals expect reactions. They may take partial profits there, prepare for a reversal, or expect price action to react.
Institutional traders plot levels. They plot targets. They plot reaction zones.
STEP 2
After setting it up, this is how it looks on the chart.
You see the uptrend, the impulsive wave, the strong push forward, and the correction after. Once you spot that move, you grab the Fibonacci extension tool and plot it the way I showed you.
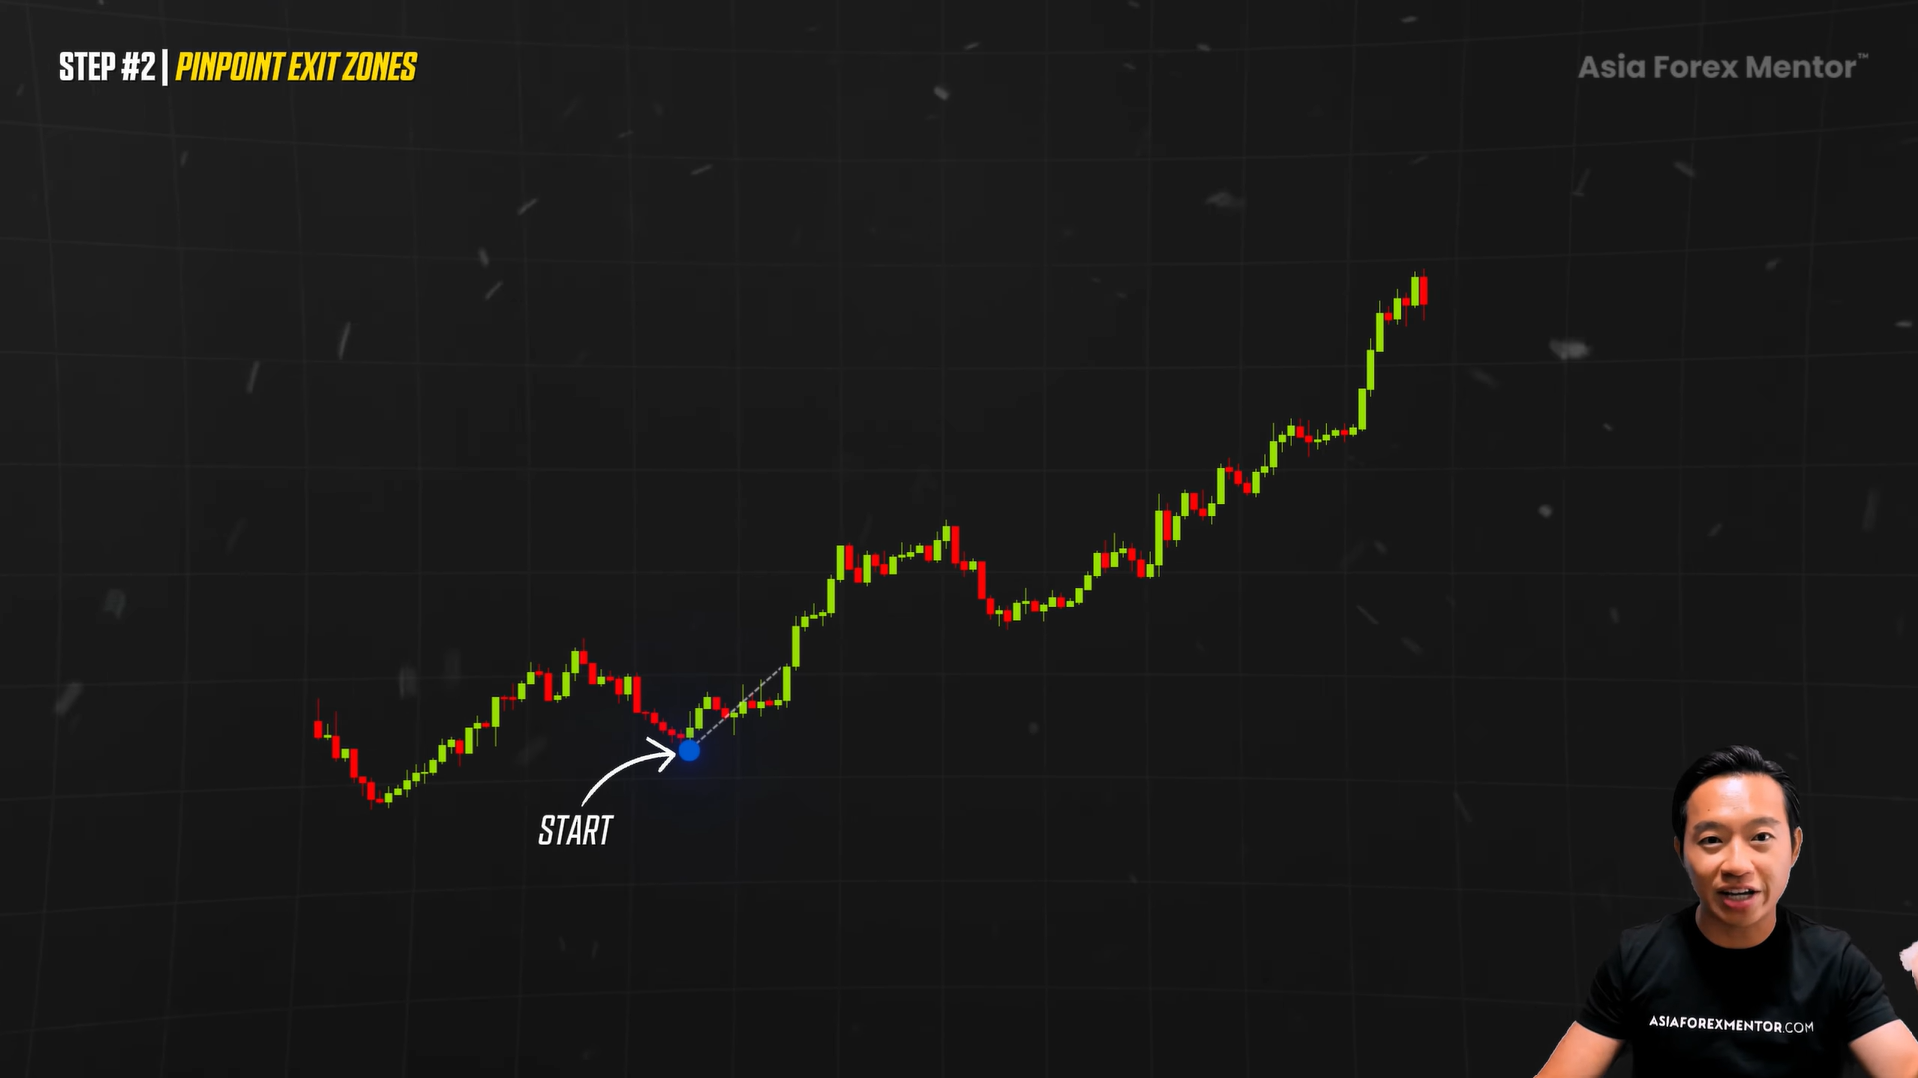
Now you already have your projection. You already have your forward map where price might complete its run.
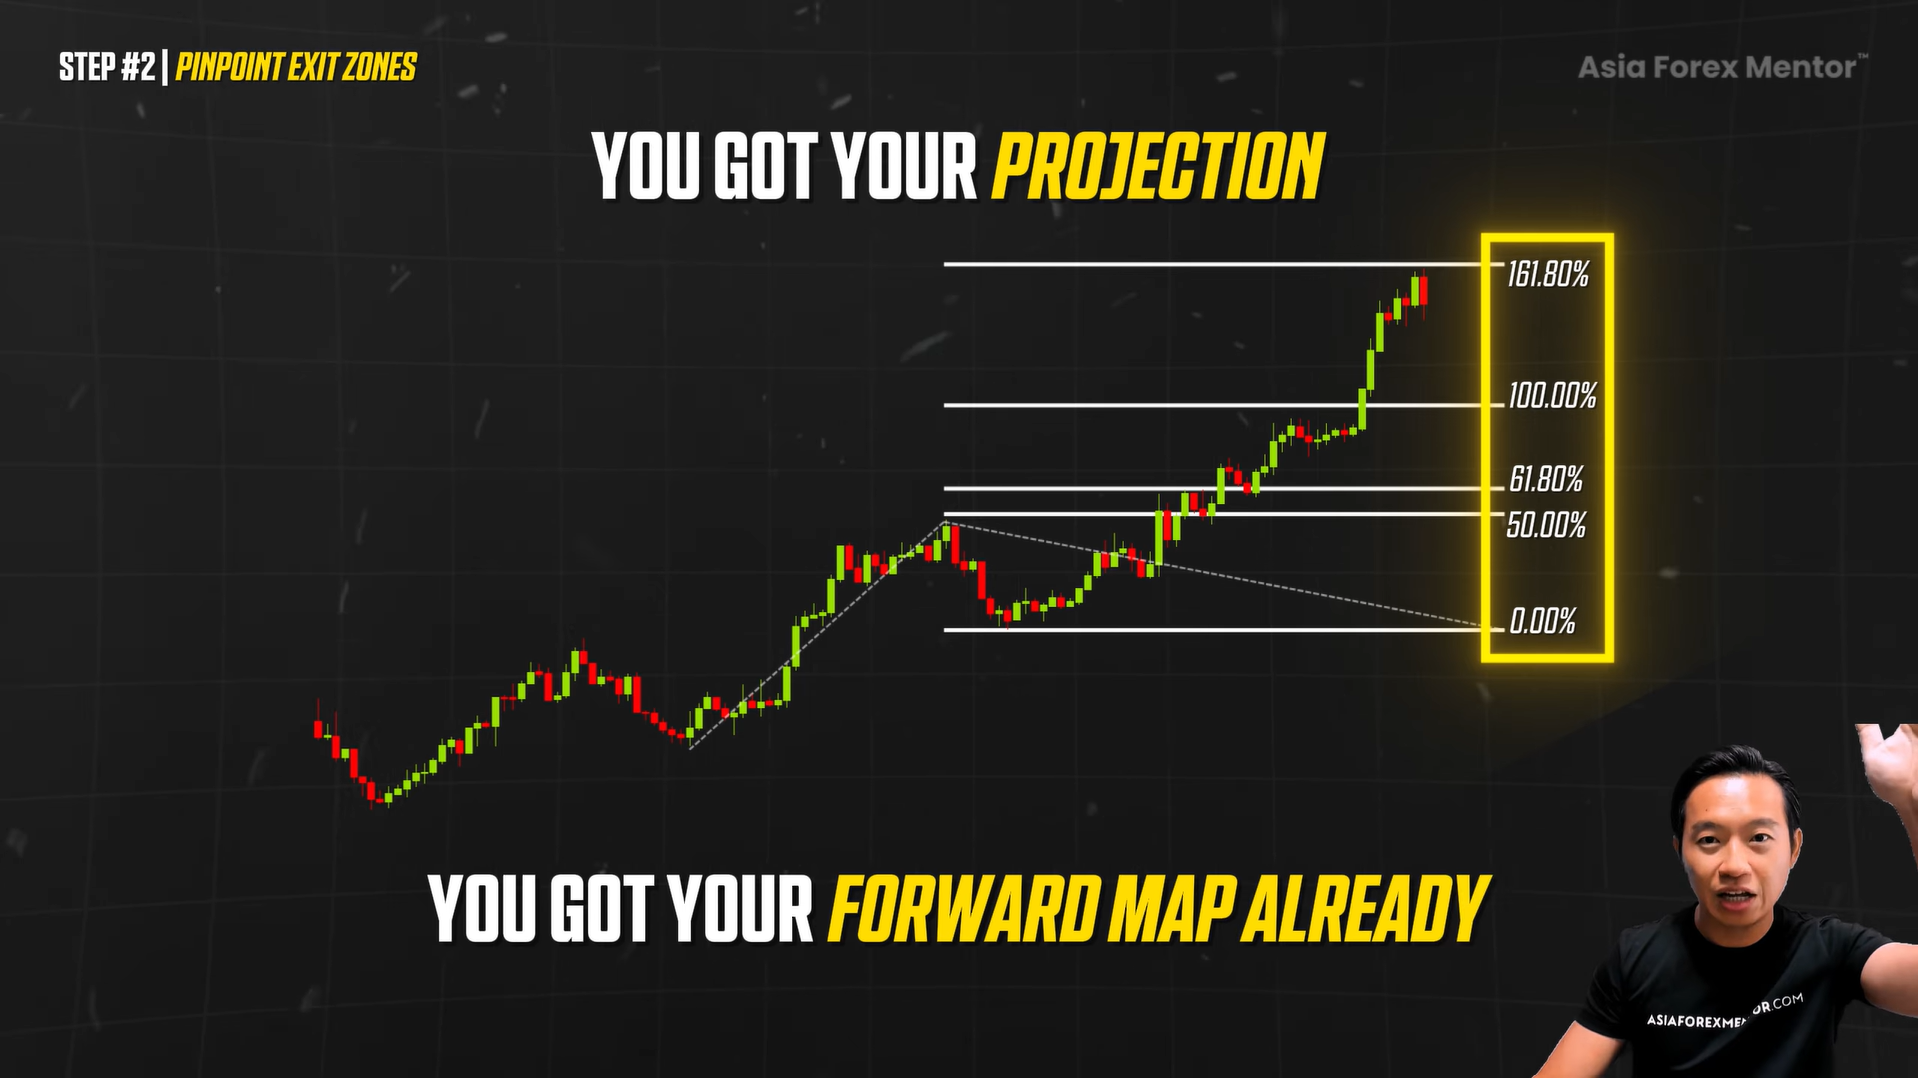
If it is a downtrend, you just flip it. You drag it to the bottom, click at the start of the pullback, and extend it forward.
This is where precision matters.
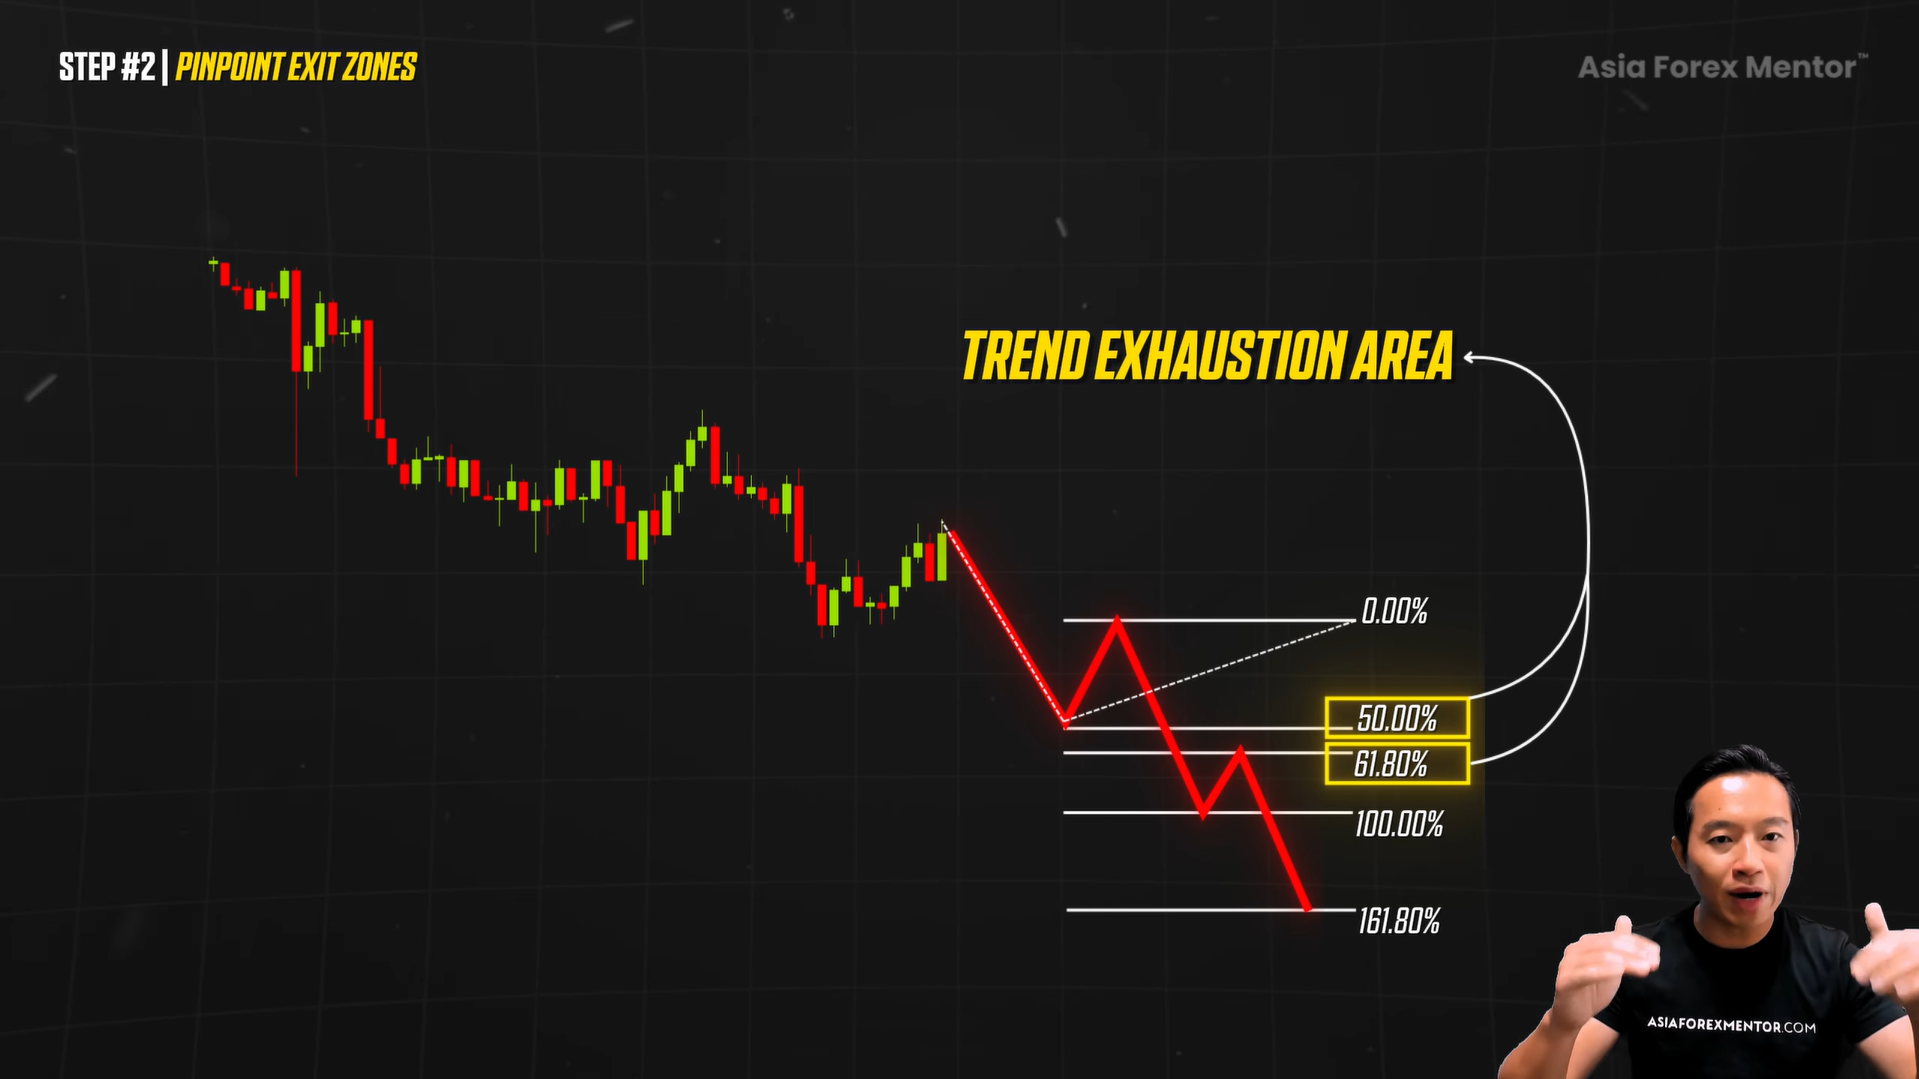
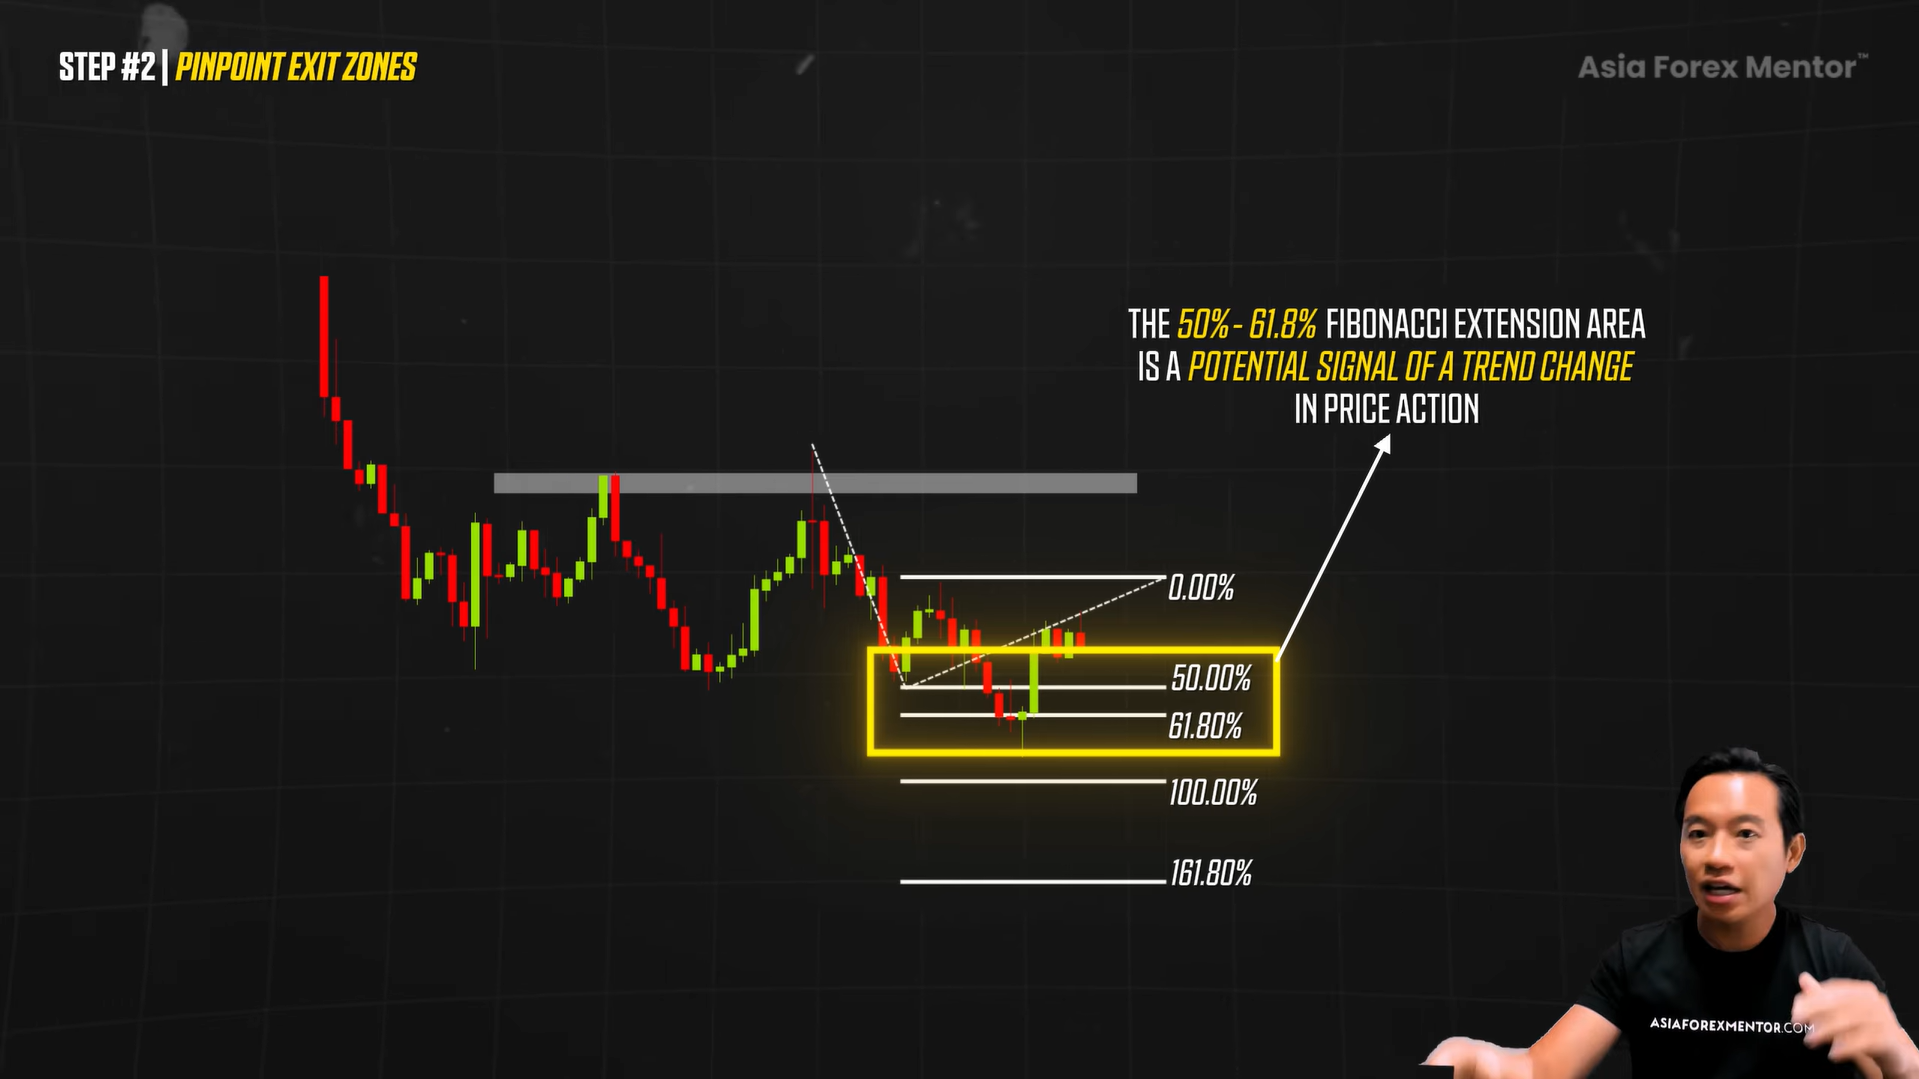
The 50% to 61.8% Fibonacci zone is your trend exhaustion area. It is where price often starts reacting. When price reaches that zone, we stop hoping and start observing.
We want to look for structure change. It could be sideways chop. It could be shrinking candles.
These are warning signs that the move is running out of fuel.
This does not mean every single time you exit at the 50% to 61.8% level. What it means is that these are the zones where after the extension, price cannot keep running nonstop.
Price may still continue, but this is where it often needs to rest before continuation or before fully exhausting and reversing.
So that is the area you want to watch.
If you see exhaustion kicking in, momentum slowing down, candles getting smaller, price moving sideways, or even a triangle forming that could break the other way, that is where you know the move is running out of fuel.

This is what separates a professional exit from a lucky one.
Not “I think I should get out now.”
No.
Because you already mapped the zone and you are already seeing a potential structure shift.
This is where you lock in profits. This is where you build your safety net.
If it does reverse, you already anticipated it. You got out before price fully reversed.
That is provided that it fits your overall system and your overall risk-to-reward ratio.
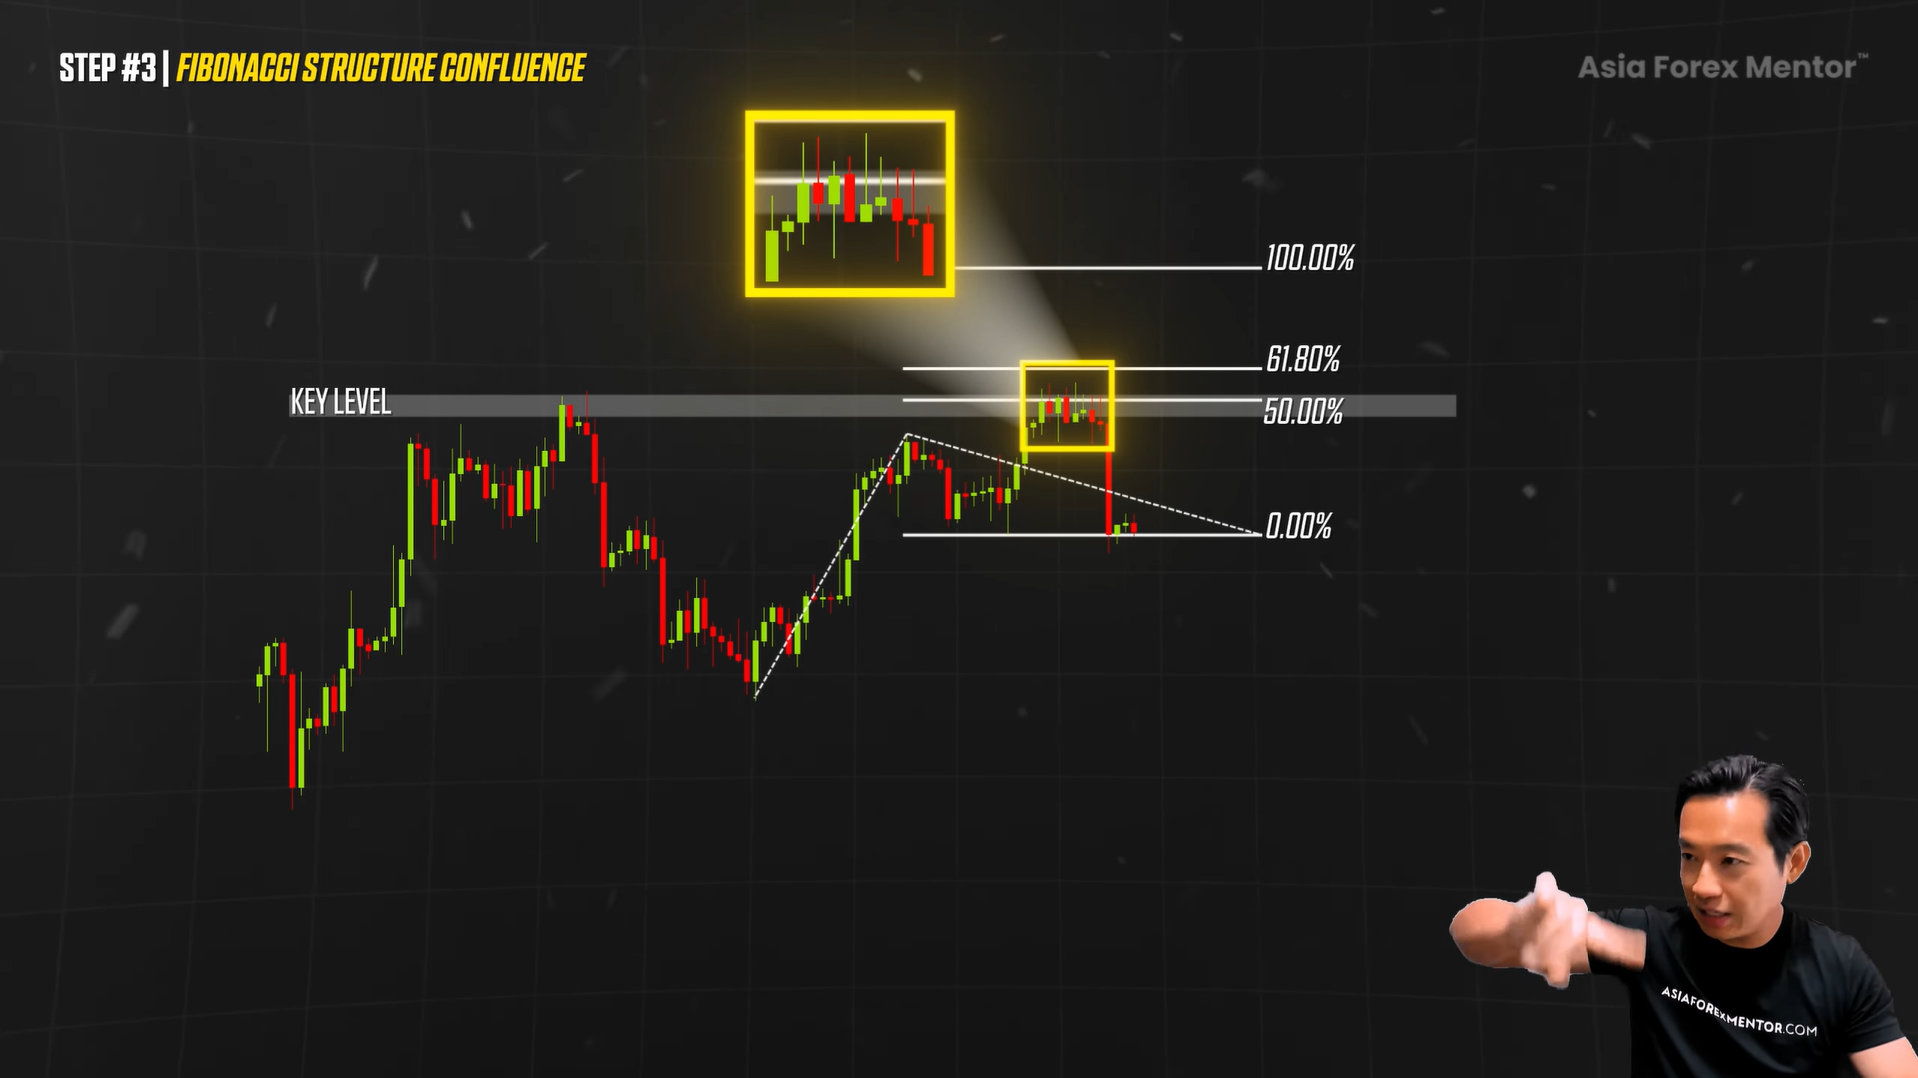
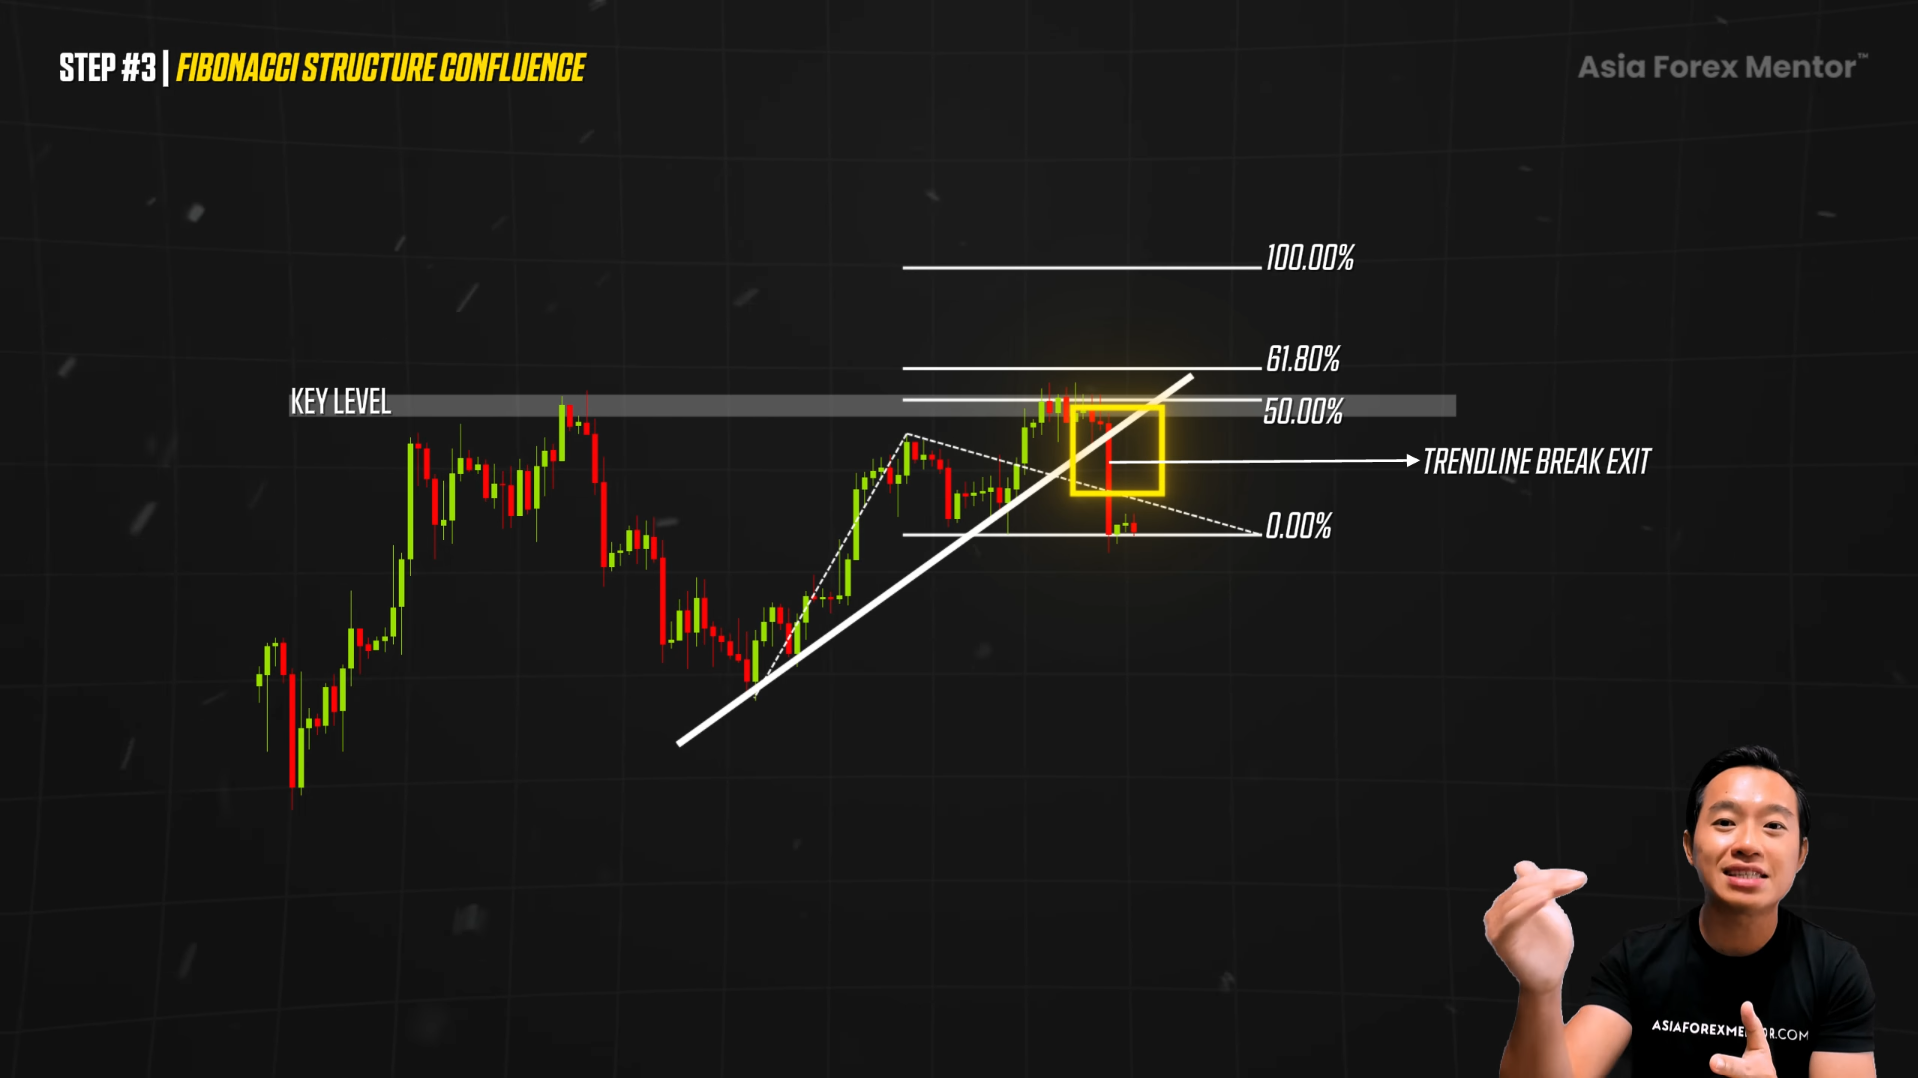
Now that you have identified the precise exit zones, the next step is to make them even stronger by layering them with structure and confluence.
STEP 3
This is where the chart starts telling a story.
You enter the trade on a clean breakout. Price surges upward. You saw that critical swing high everybody was talking about.
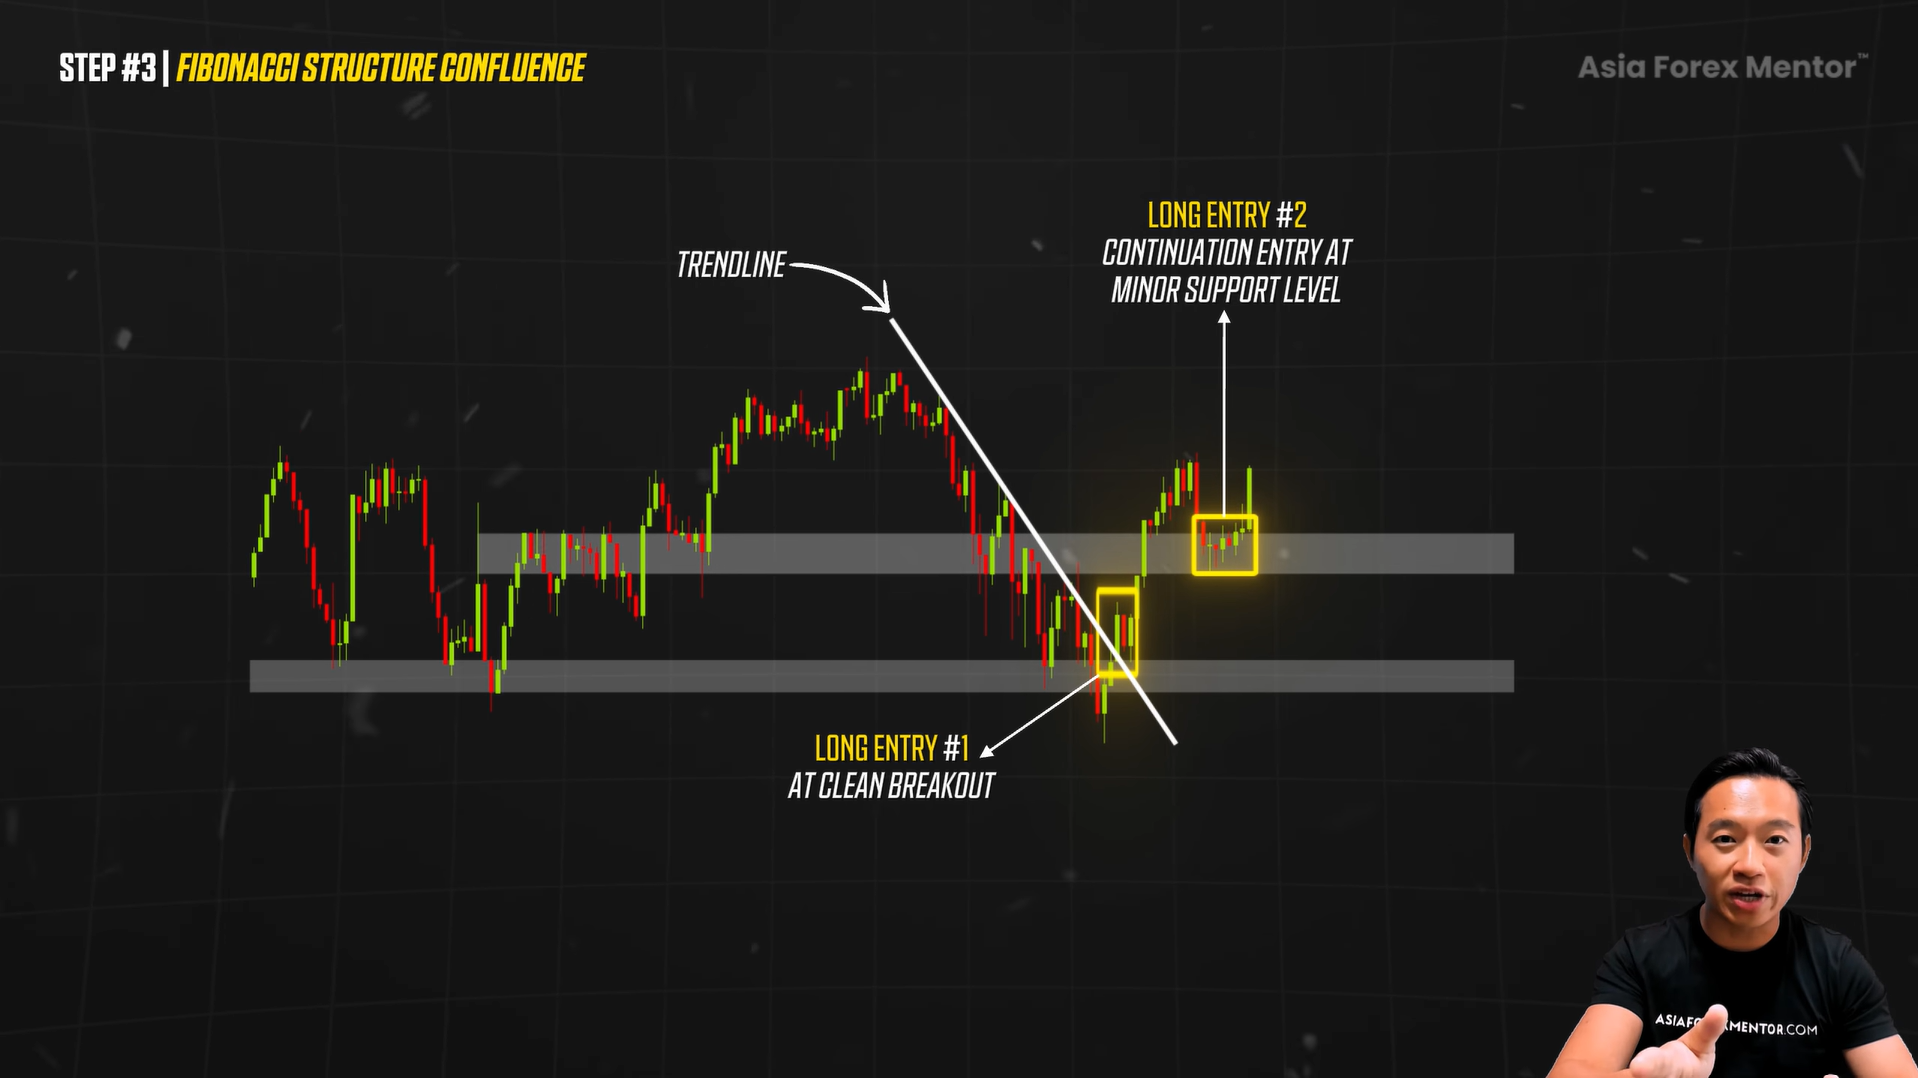
You pull out your Fibonacci extension tool.
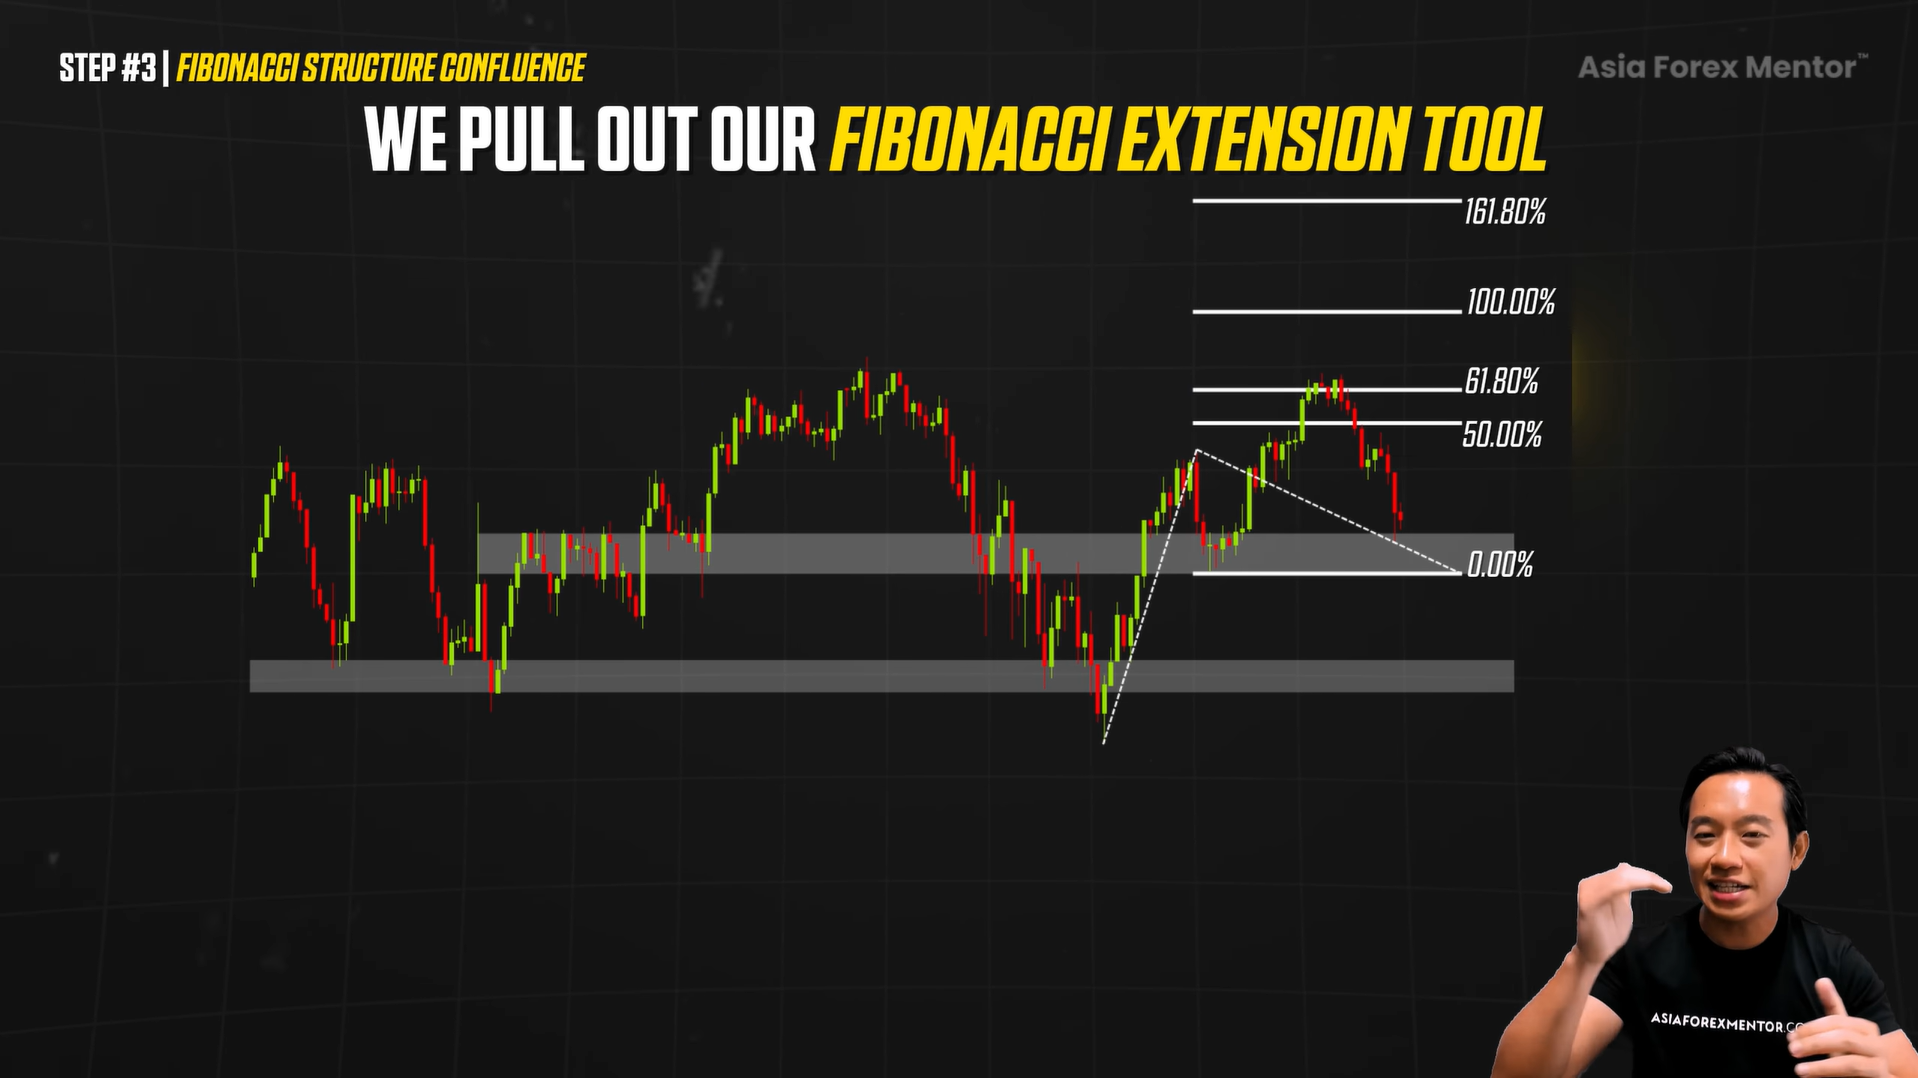
Then the 61.8% level lines up perfectly at a swing high.
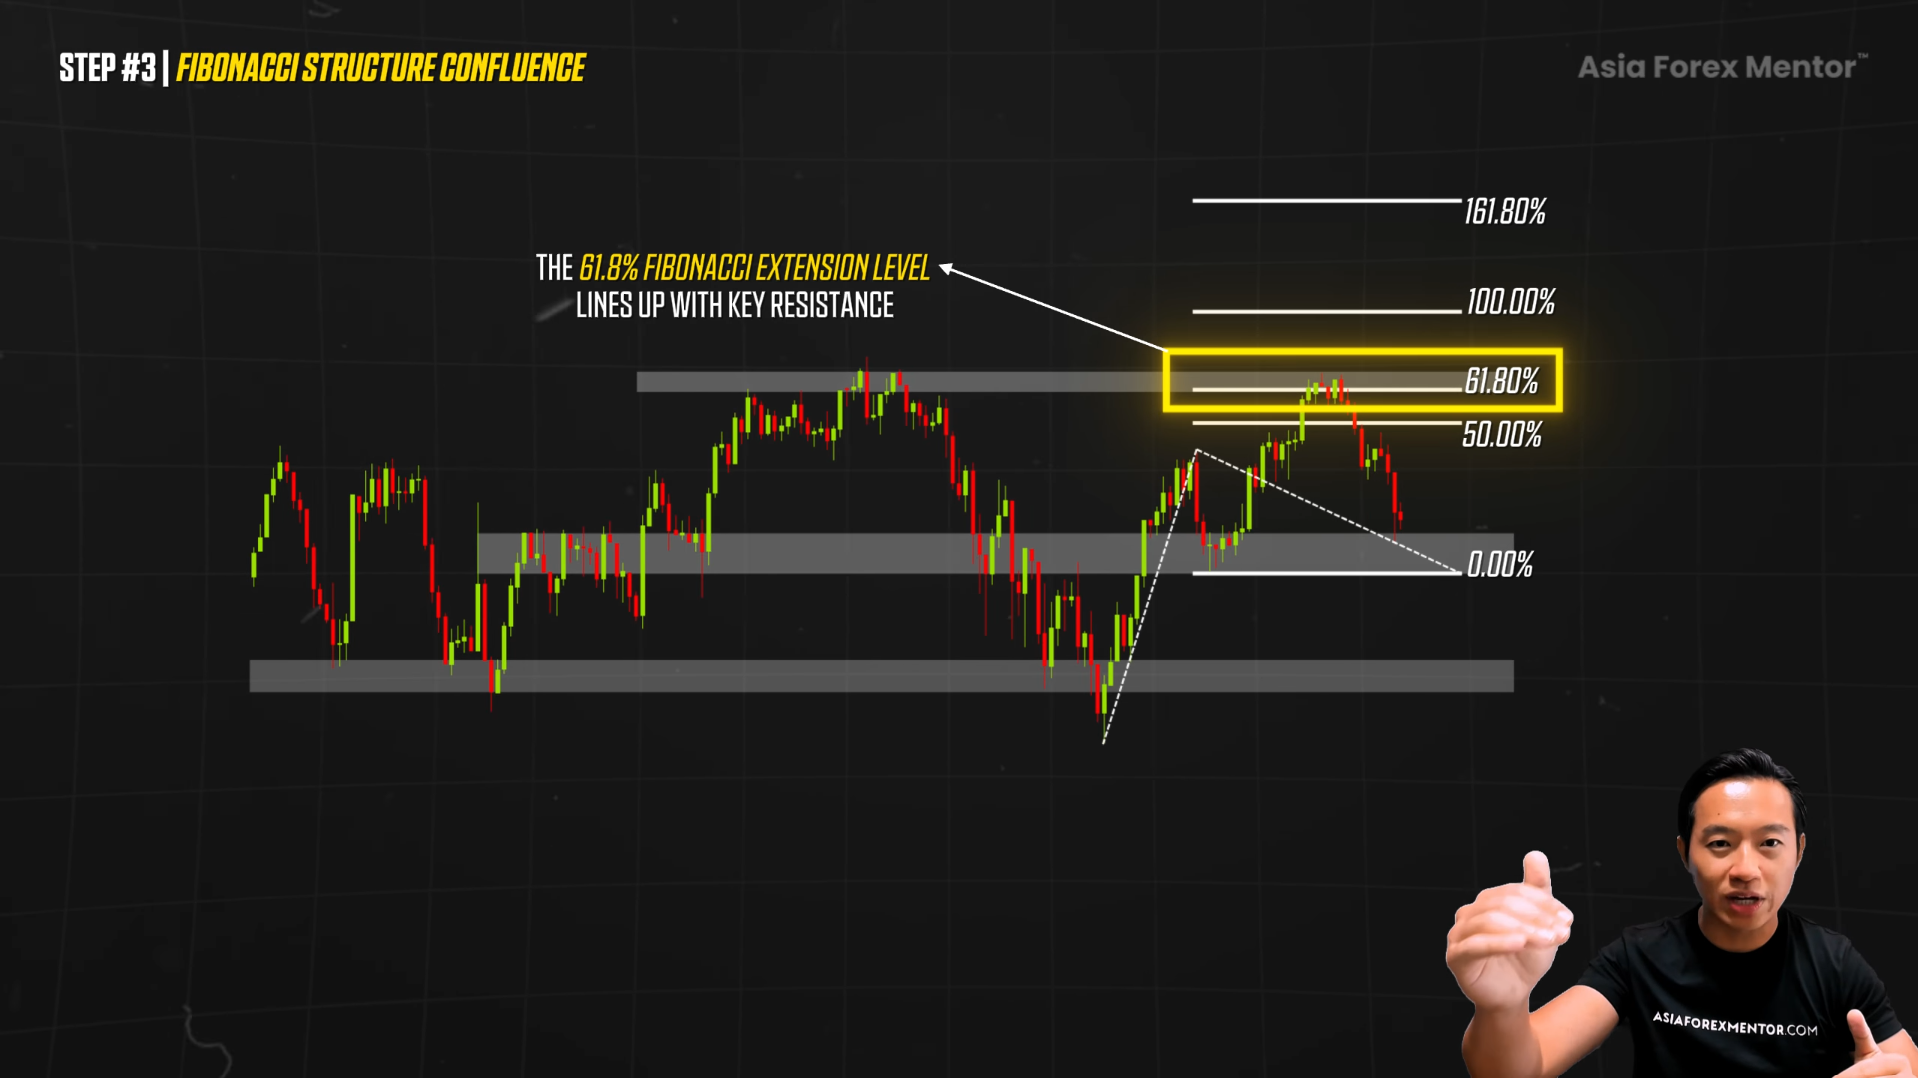
This becomes a golden moment.
Not because it looks good, but because the structure is screaming that it is time to act.
Now here is what you do next.
You zoom in.
That 61.8% zone may also overlap a recent resistance area. Or it could line up with a diagonal trendline.
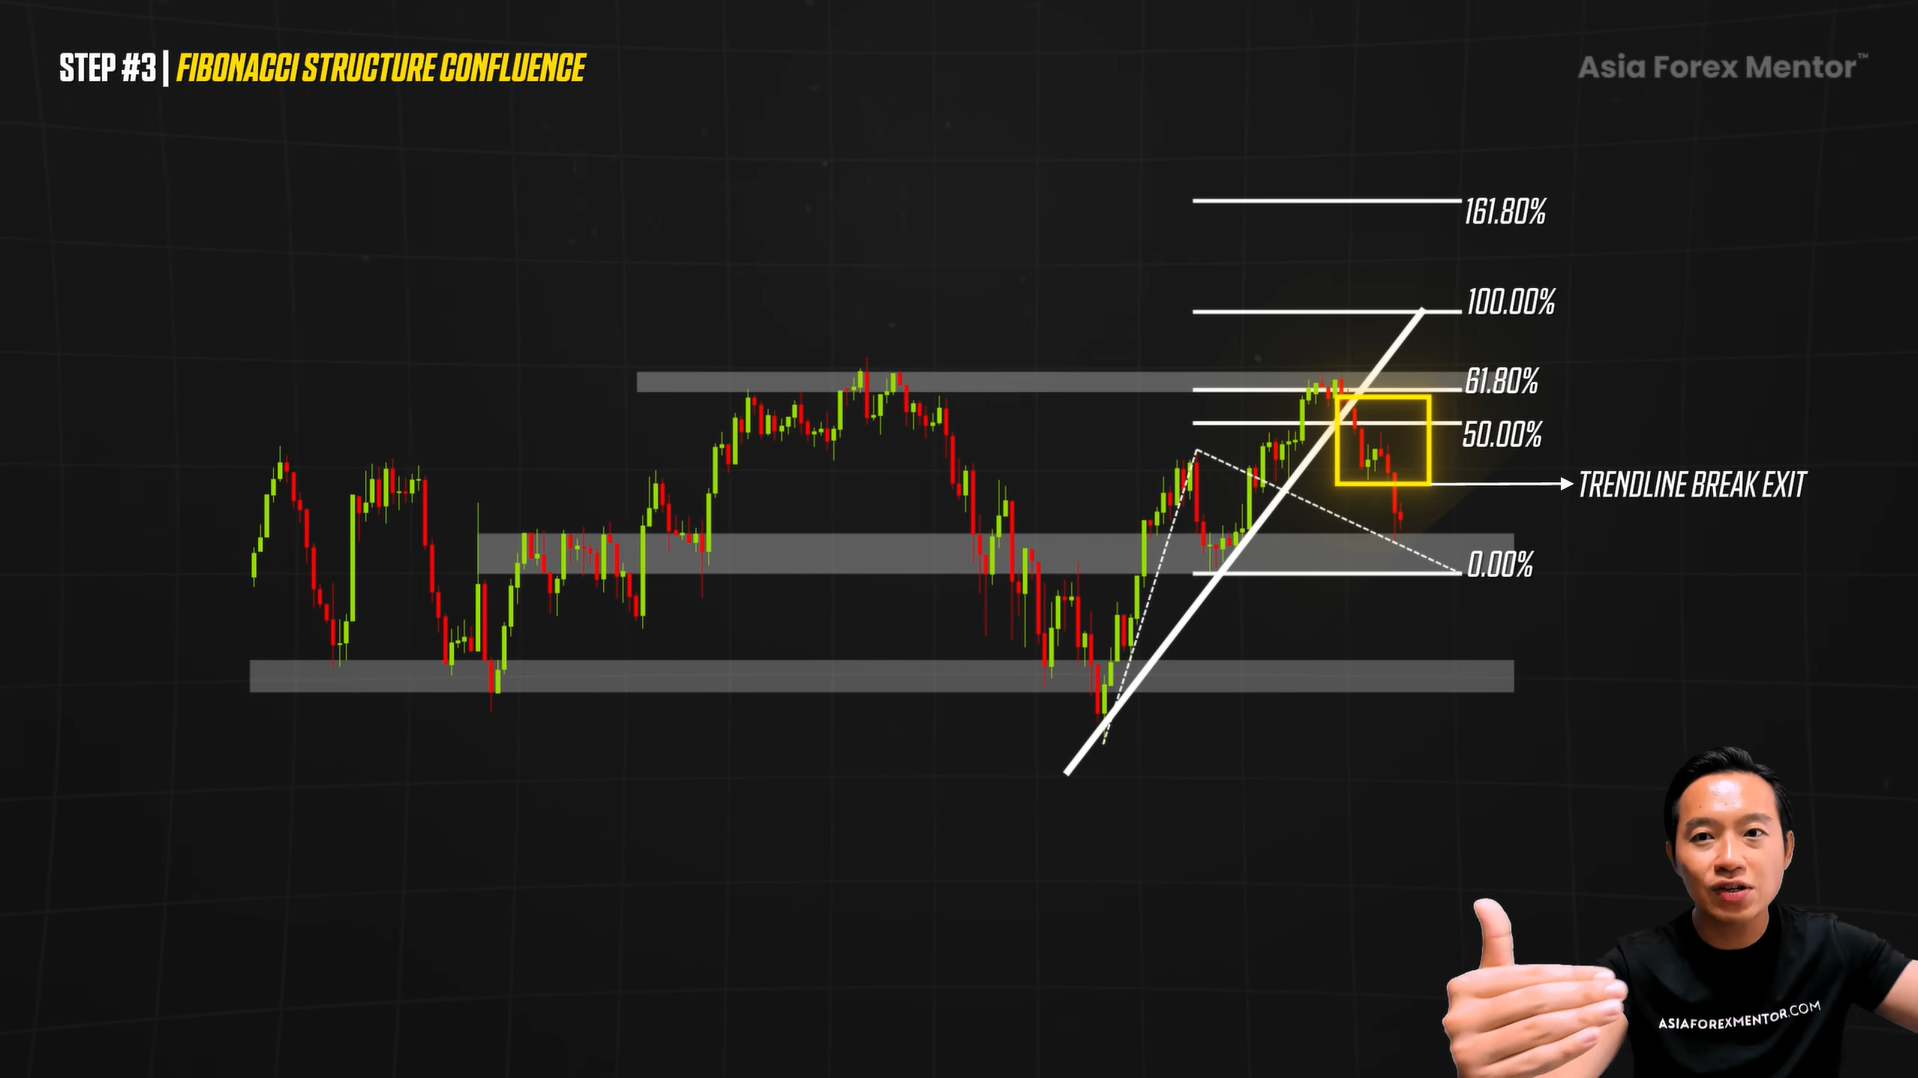
Now you are stacking confluence.
This tightens your target zone.
When price reaches that pocket, you watch for a structure shift. Maybe it is a small trendline break in the opposite direction. And maybe it is a small lower high. Maybe it is a structural break.
This is the precise move that tells you the extension is complete and the move is complete.
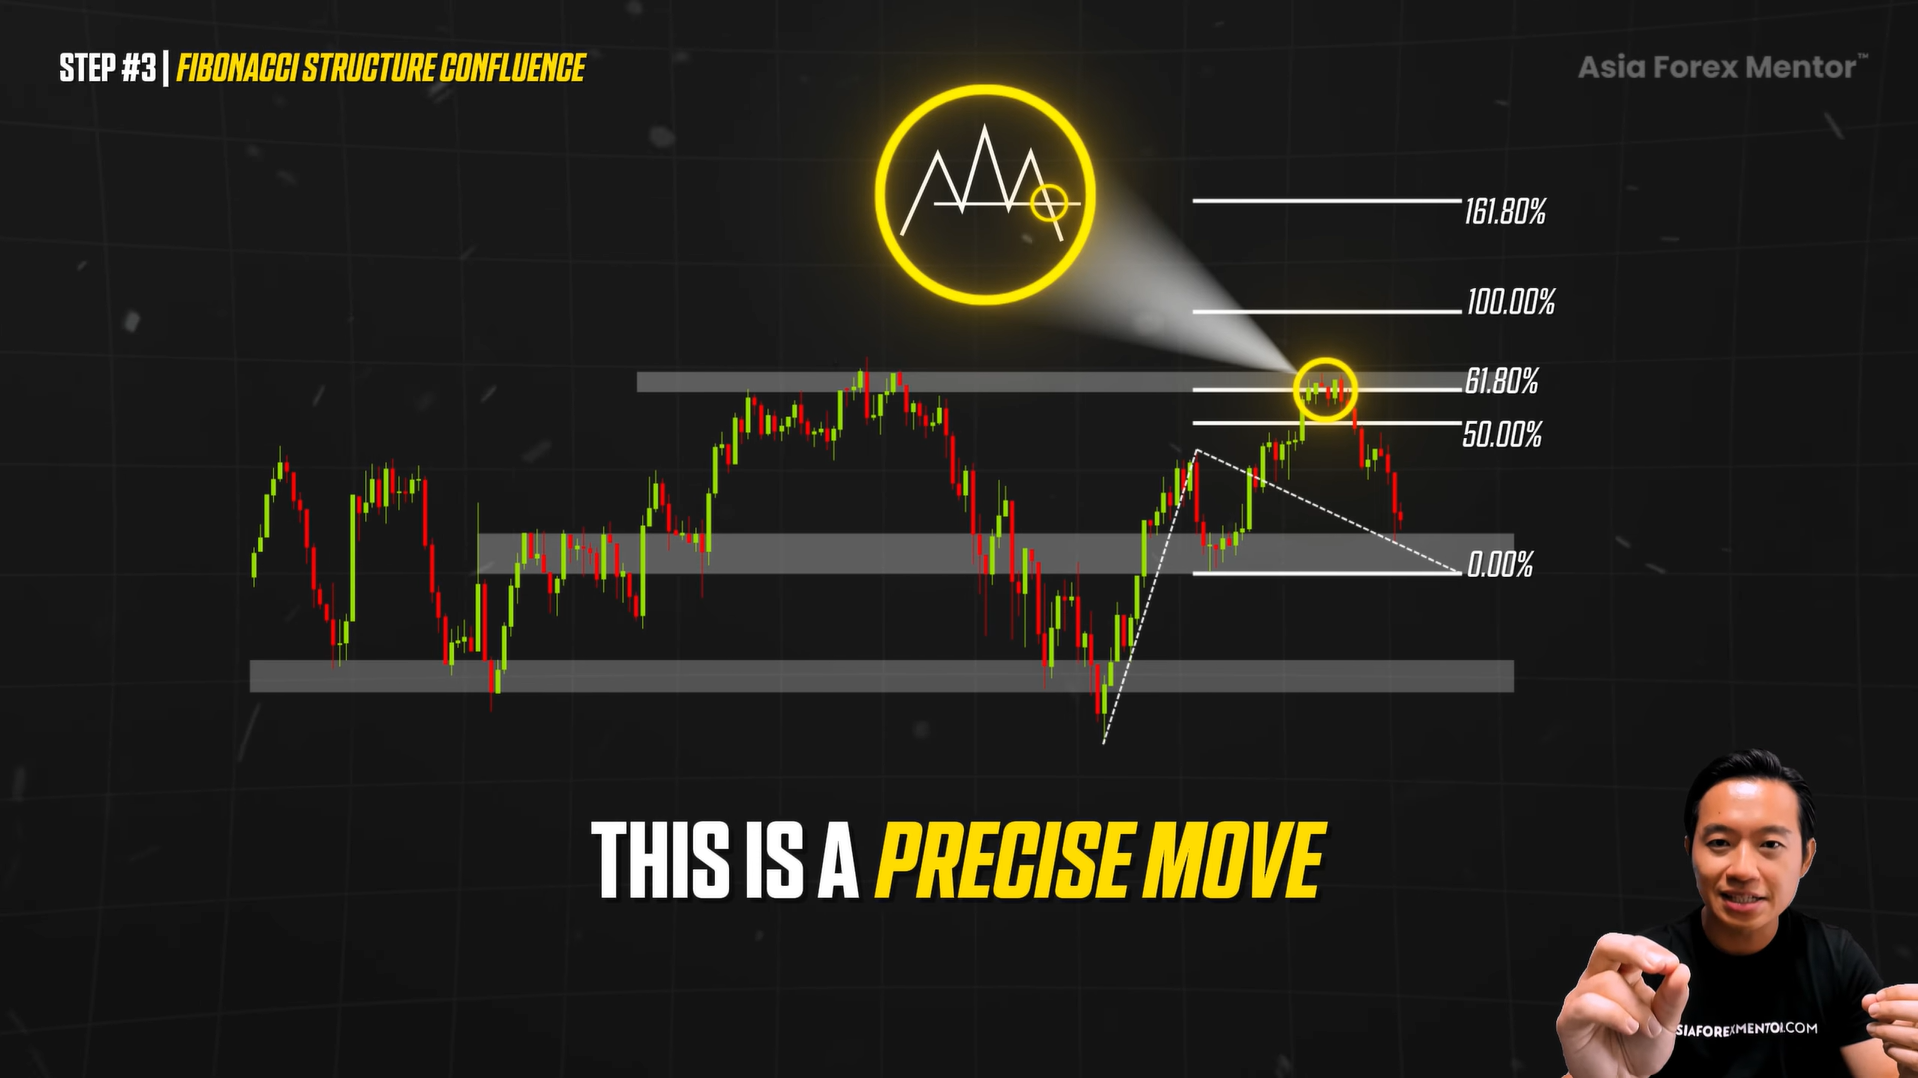
That is when it is time to get out.
Here is another example.
A long position is triggered off a head and shoulders continuation. Price rallies, and the 50% Fibonacci extension lines up with a previous swing high.
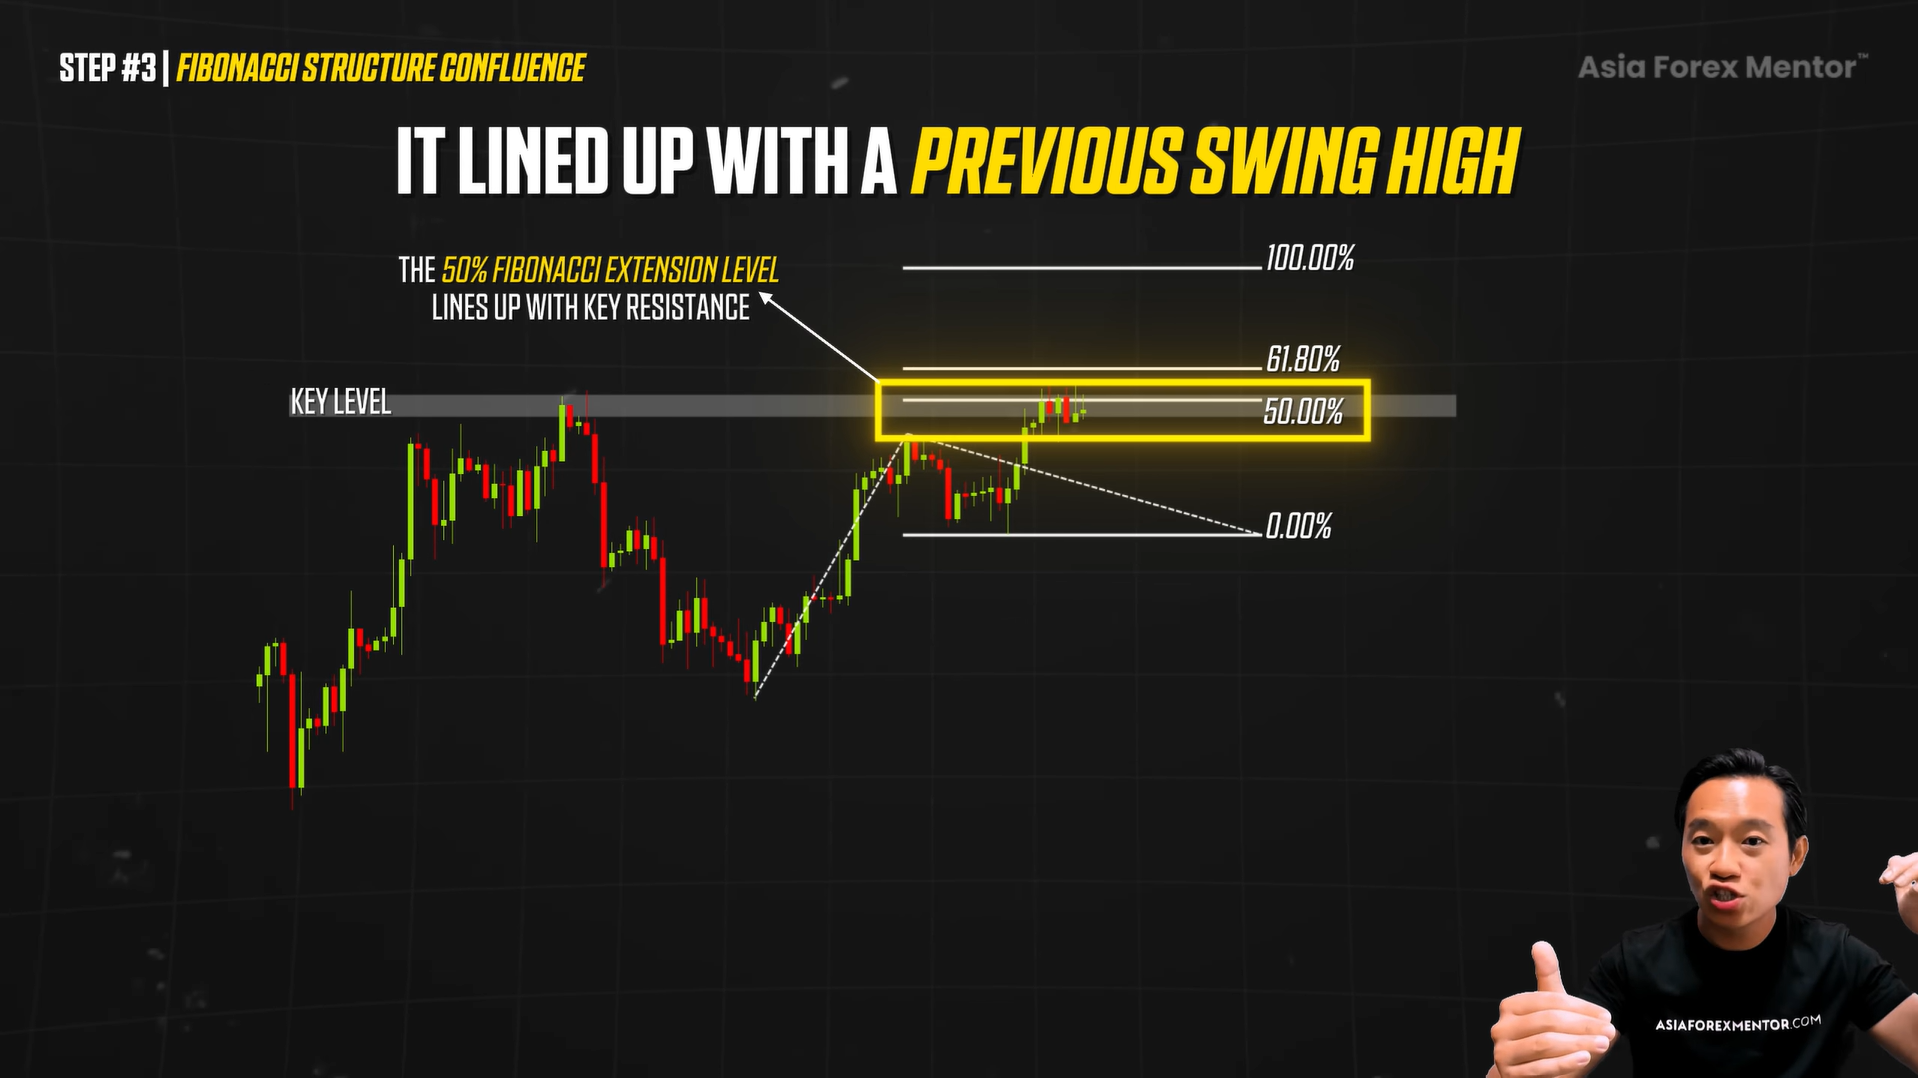
The market reacts like clockwork.
If you only plot the Fibonacci extension, it is just a 50% line. But do you know exactly it will stop there? Maybe not.
Because it can keep going.
But when that same Fibonacci extension lines up with a previous swing high, now you have a strong zone.
Then what happens?
You start to see multiple long wicks.
Price taps the same zone. Structure tightens. The market loses momentum. Sellers start stepping in.
That becomes your exit cue.
Momentum is exhausted. It is probably time to get out.
That is how you capture the full move if it does reverse, but if it still continues, you are still in the trade.
Summary
We began with the foundation.
We talked about setting up the Fibonacci extension properly. Making it clean. Setting it once and setting it right, so it is clutter-free and easy to trade with confidence.
Then we talked about the key levels, the 50%, the 61.8%, and the 100%. These become precise areas where you project exhaustion and watch how price reacts.
This is where the math starts meeting market structure.
Every level begins to make sense. You start to see momentum changes and you are no longer just plotting lines anymore.
You are reacting to projected exhaustion zones.
These are now precise exit points.
You now have a good target area to either take profits at a strong risk-to-reward ratio or secure your profits with a trailing stop loss and potentially let it run.
The Fibonacci extension tool is an important tool for any trader to add into the trading arsenal.
What To Do Next
I’ve put together a free training that walks you through the exact three-step system I use to find:
- high-probability trades
- sniper-level entries
- real risk control
- zero guesswork
This is the same system I use myself and the same one that has helped thousands of traders move from frustration to consistency.
I’m giving it to you for free.
No fluff. No filler. Just pure strategy.
Click the link and I’ll see you inside the training.
👉 FREE 3-Step Training: The Setup I Use Before Every Trade
FAQs
What is a Fibonacci extension used for in trading?
A Fibonacci extension is used to project where price may move next beyond a completed impulse and correction. It helps traders map potential profit targets and reaction zones.
What is the difference between Fibonacci retracement and Fibonacci extension?
Fibonacci retracement looks backward to find where price may pull back. Fibonacci extension looks forward to project where price may continue and potentially exhaust.
Which Fibonacci extension levels matter the most?
The 50%, 61.8%, and 100% levels are important because they often act as projected target zones where price may react, slow down, or reverse.