So everything that you have been taught about supply and demand is actually making you lose money. I know it's a bold thing to say. But after 20 over years of trading and personally mentoring thousands of traders out there, I can tell you something with absolute clarity. It's that most traders, they are drawing those zones completely wrong. Wrong zones equals wrong entries, equals wrong stops.
By the end of this video, all three are fixed. And that shift alone could change your next 10 trades.
You're going to learn:
- How to tell a strong supply and demand zone from a weak one using momentum candles
- Where to draw your zone correctly, the origin of the move, and why wicks matter
- The three rule-based entry models: the fair value gap, the mitigation block, and the breaker block
Once you get these three things right, you eliminate the biggest reason most supply and demand traders lose.
📺 Watch the full breakdown in the video:
What Separates a Strong Zone From a Weak One
Here's the thing that most traders don't want to hear. The zone is not wrong. The way that you are drawing it is. They drew a weak zone in the first place. So let me show you exactly what separates a strong zone from a weak one.
The first thing that you need to understand is that strong zones are not created by slow sideways movement. They are created by impulsive price movements, aggressive, decisive candles that show a clear imbalance between the buyers and the sellers. If the move looks hesitant, the zone is weak. It's as simple as that.
The rule that I use to keep this very objective. For a valid demand zone, what you want to see is at least three consecutive green momentum candles with large bodies, with a good strong distance that it has pushed up to. The same rules would apply for a supply zone. You want to see three consecutive candles, large bodies, you want to see strong push. So if you don't see that kind of aggression in the move itself, don't draw the zone. When that happens, you are now setting yourself up for a losing trade before you even enter.
Where to Draw the Zone
Once you have confirmed that the move is strong enough, the next question is where do you exactly draw the zone? There are a couple of ways to identify this correctly. The first way is to mark the candle that initiated the bullish move.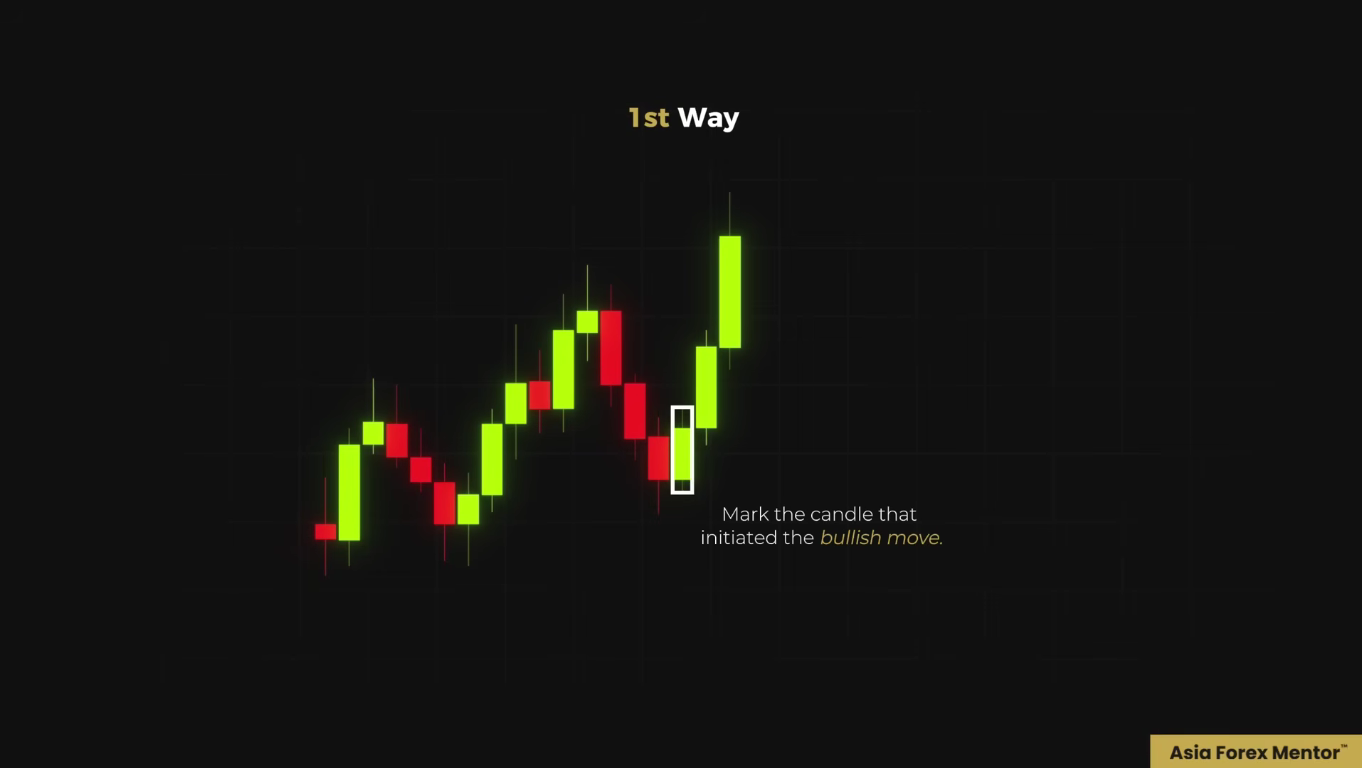 That green candle represents where the buyers made their decision. When price comes back to that area, this is where we expect a reaction at that area.
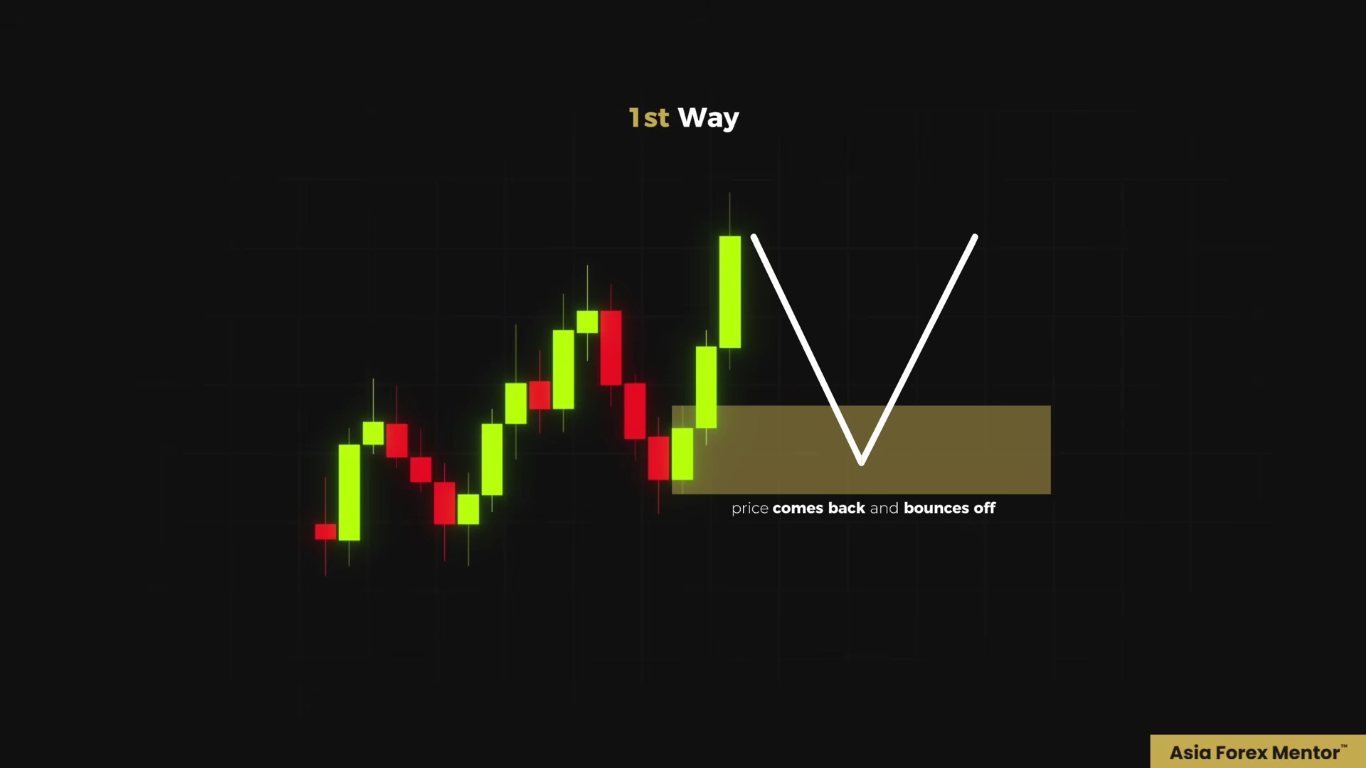 The second way is you mark the last red candle before the bullish move began, because that candle represents the last moment of selling pressure before the buyers took over.
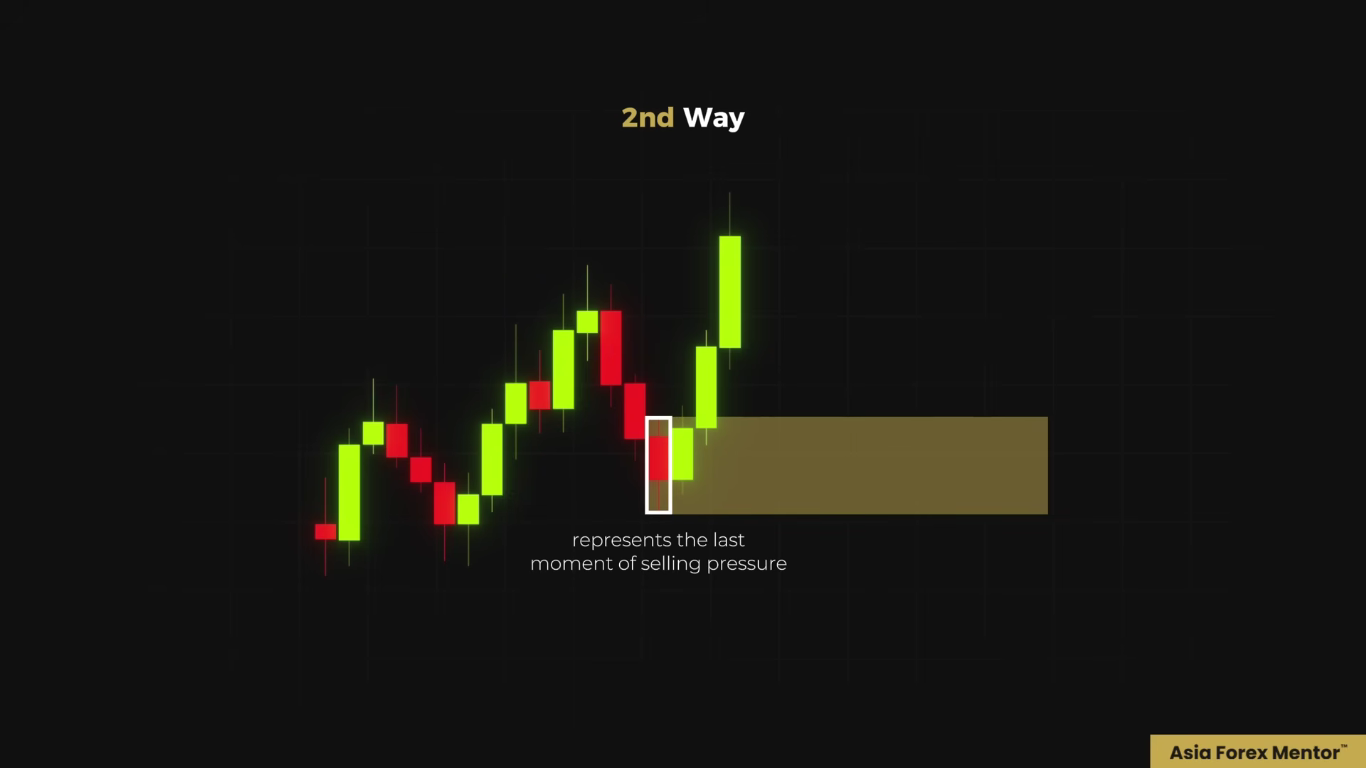 Both approaches that I've given you, they are valid, and in many cases, they point roughly to the same area itself.
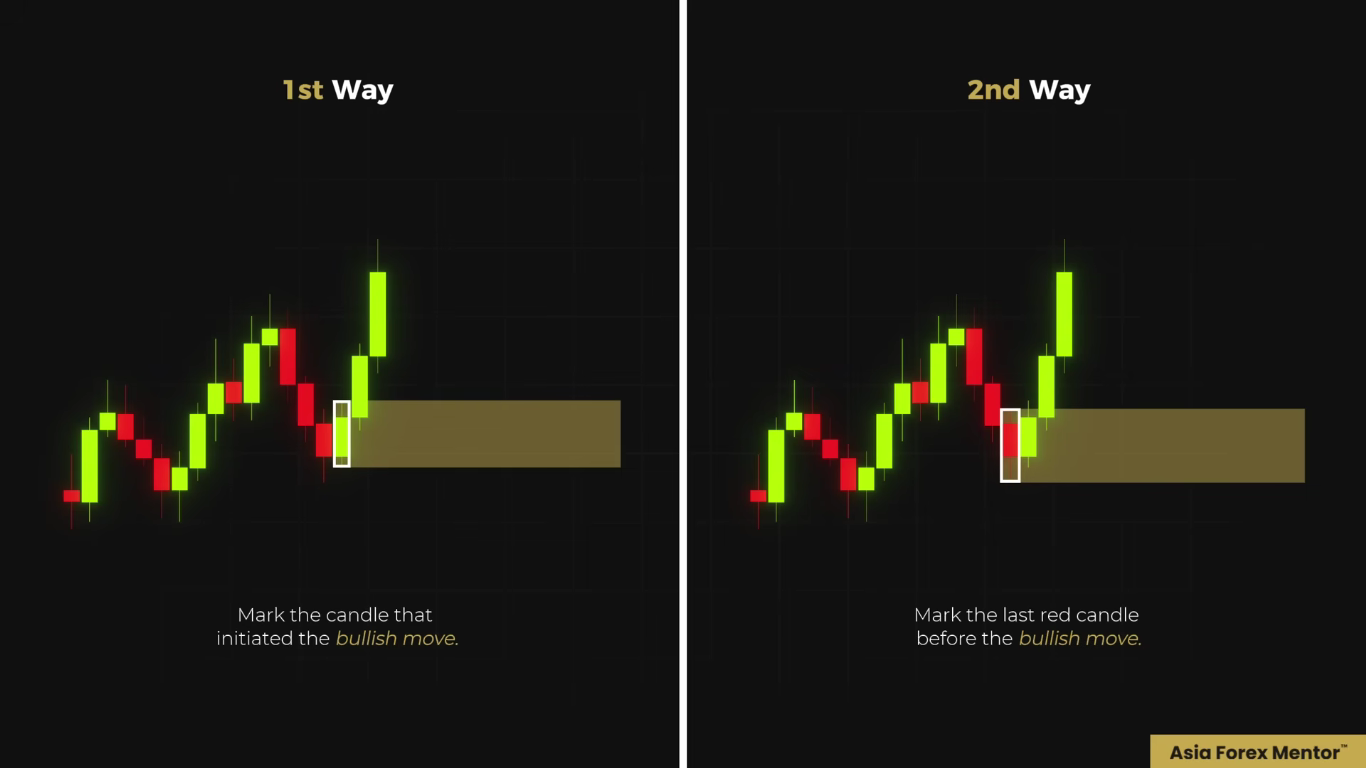
But here's where it gets important. Listen up. There are situations where the candle formation will tell you which of the two methods is better. For example, if marking the first red candle of a bearish move gives you a zone that is very small and very tight, then that zone is not reliable.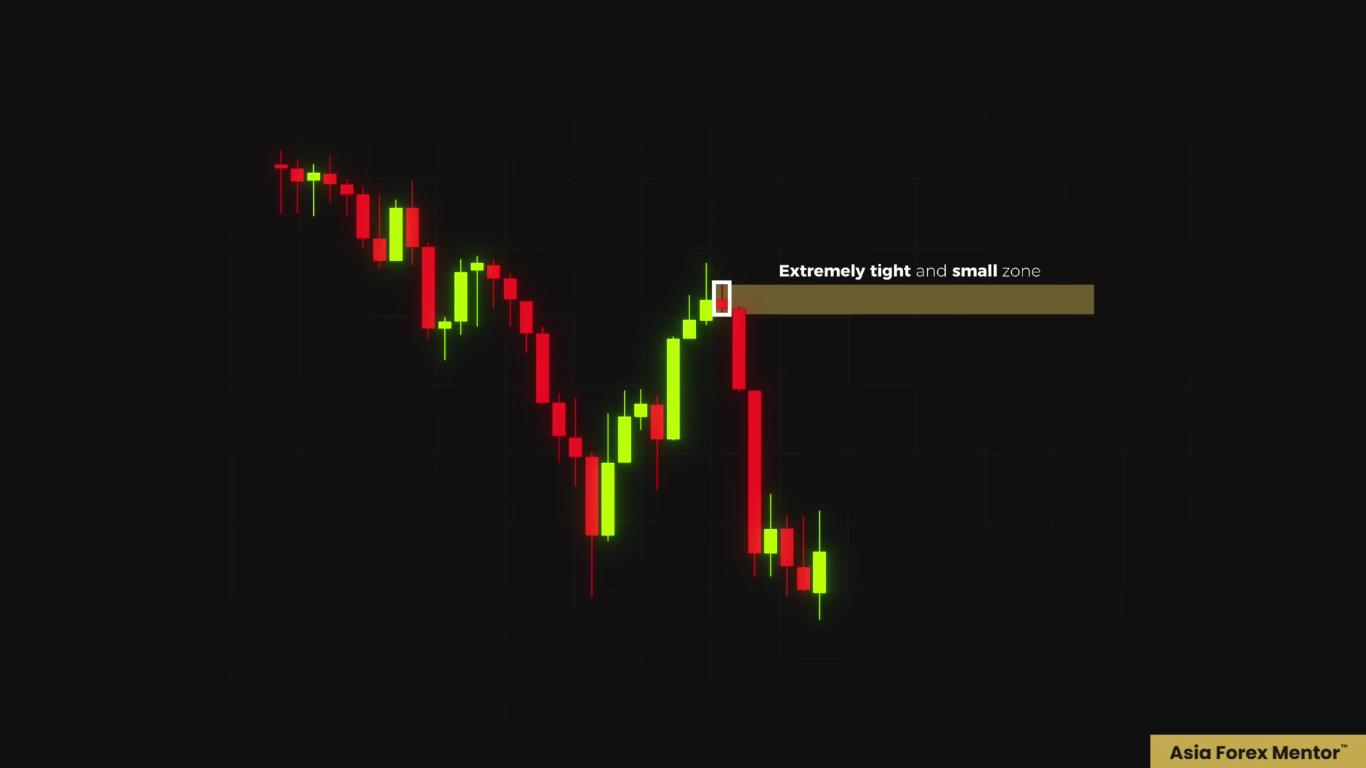 In that case, you want to mark the last green candle before the drop, that gives you a wider, a more valid supply zone itself.
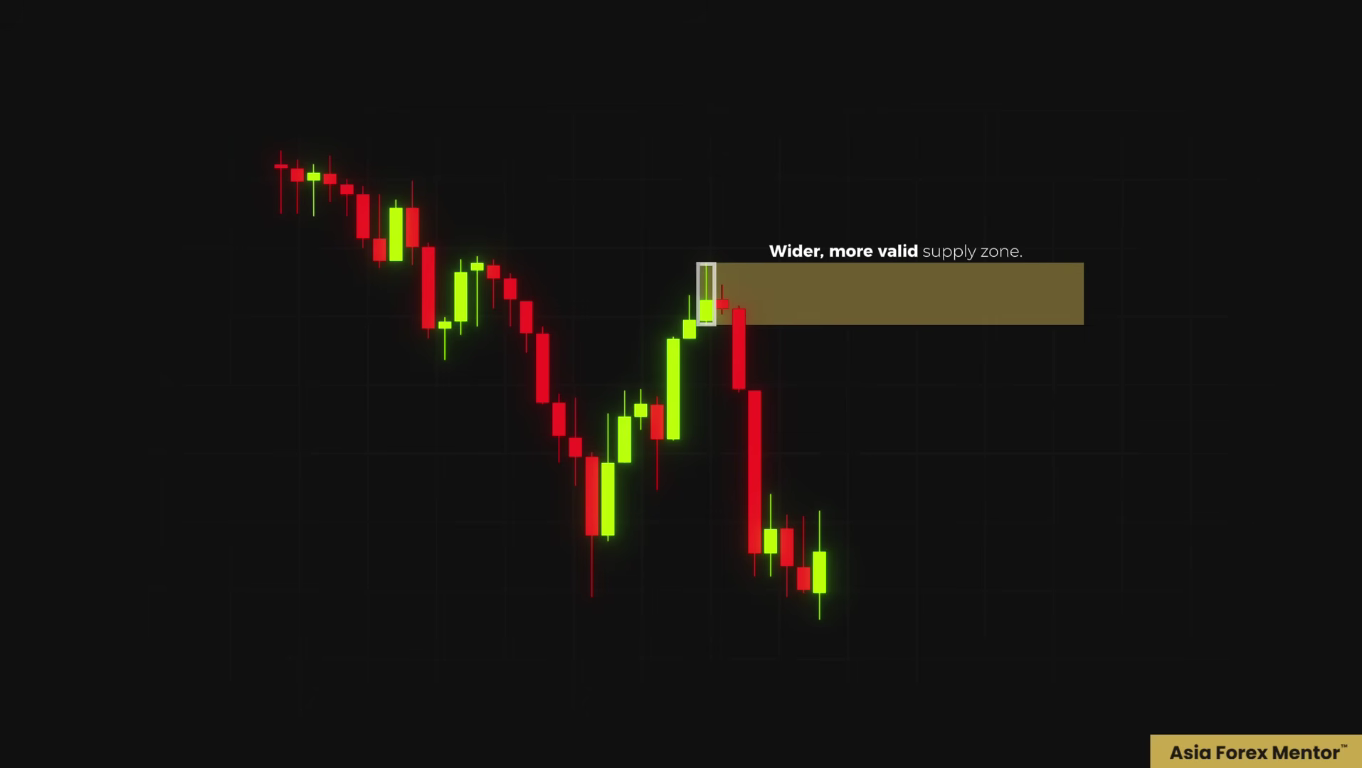 So the zone needs to have enough body to be meaningful. A zone that is too thin is going to get sliced through too easily before the market can even react at the area itself.
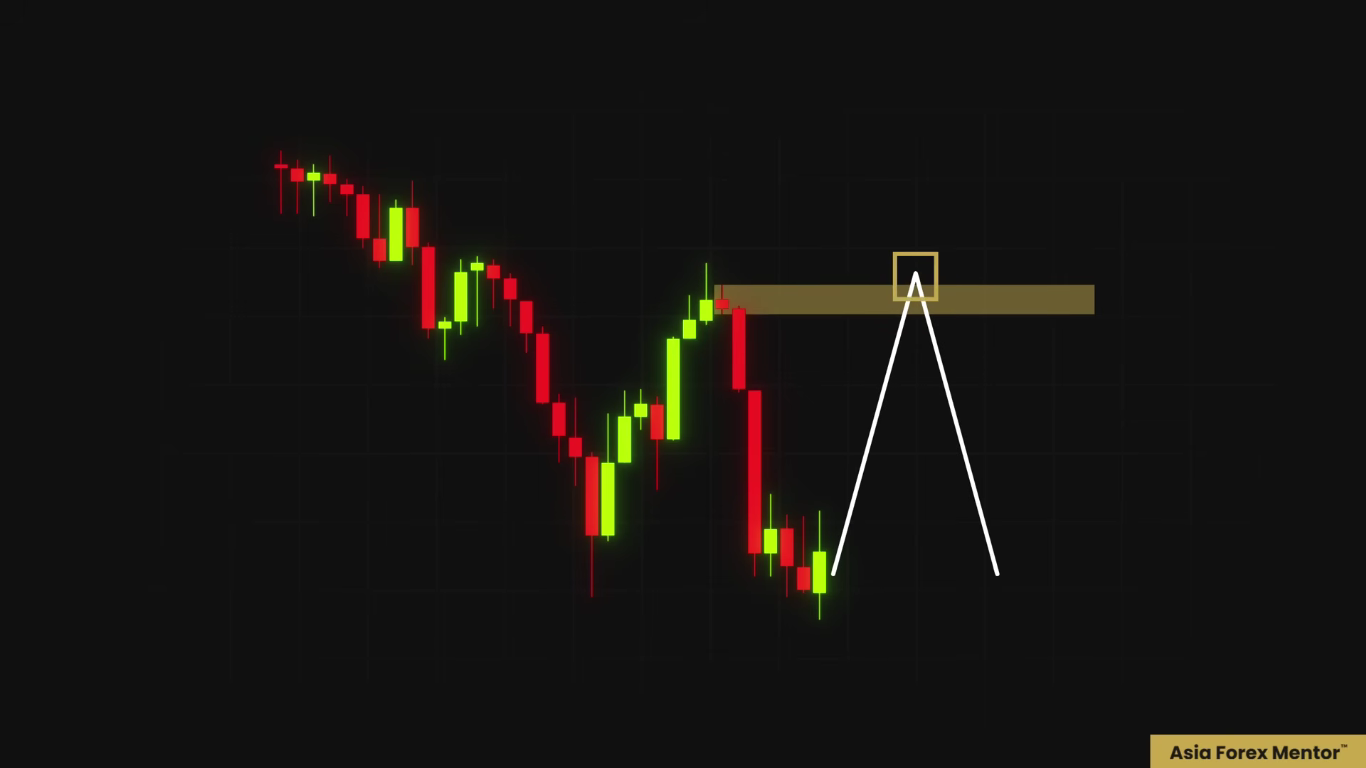
Don't Ignore the Wicks
So now, this is one part that most traders completely miss. Wicks. Sometimes the move doesn't start from the first green candle or the previous red candle. It starts from the bottom of the wick. That wick is telling you exactly where price was rejected. This is where the strong opposing pressure entered the market itself. So your zone should be drawn from the tip of that wick, not from the entire candle body itself.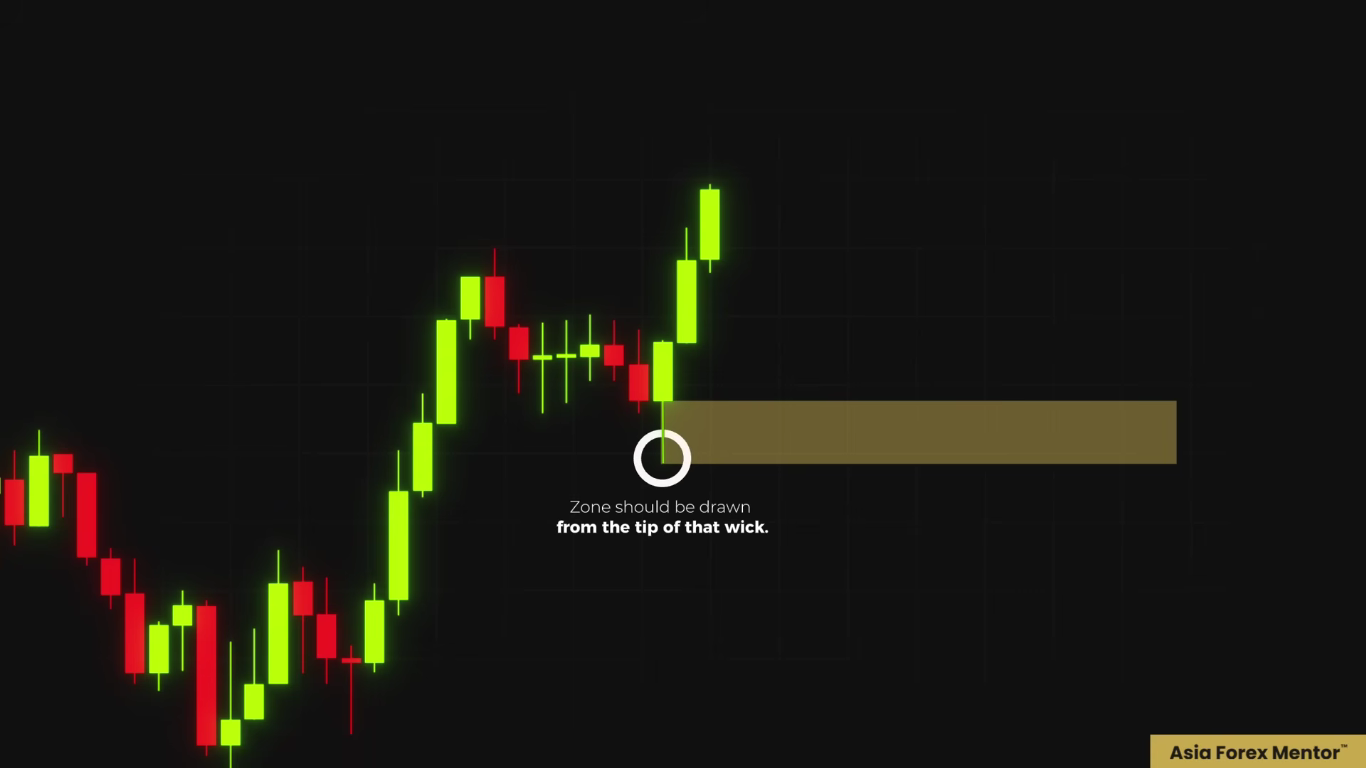 If you are ignoring wicks and you are drawing your zones without the wicks itself, you are drawing them from the wrong starting point every single time.
Wicks are one of the most powerful price action signals on the chart. They show you where price tried to go, and then they got pushed back hard. When price revisits that level, the same reaction is likely going to happen again. And that is the zone that you want to be trading from.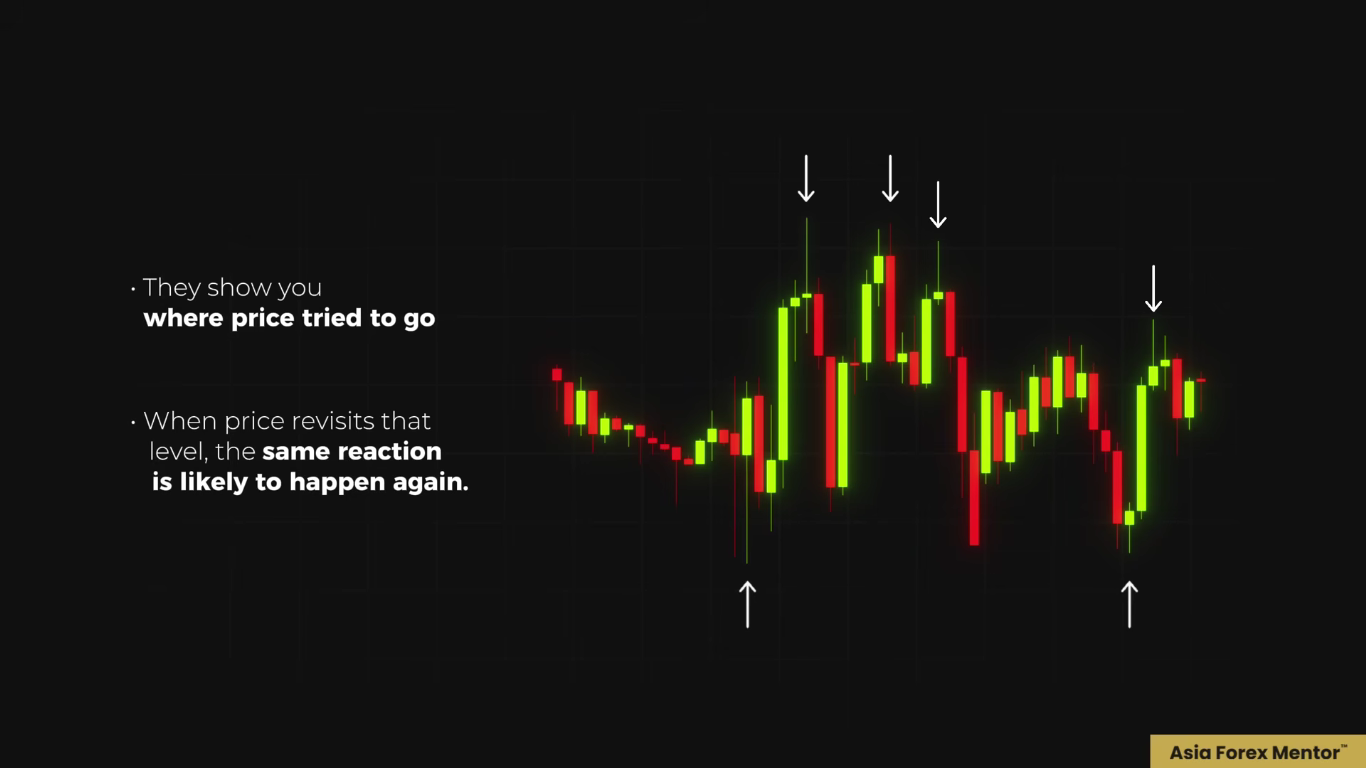
Now, if you get these three things right, you have already eliminated the biggest reason that most supply and demand traders lose.
How to Enter These Zones
Now that you have drawn your zone correctly, let me show you exactly how I enter these zones. There are three specific models and each one of them is built around one core principle. You wait for the lower timeframe to confirm before you pull the trigger.
Here's how the framework works. On your higher timeframe, whether it is the 1 hour or 4 hour, depending on what is your higher timeframe, your job is to identify the trend, what trend it is. Is it the uptrend or the downtrend? And then you mark the supply or demand zone,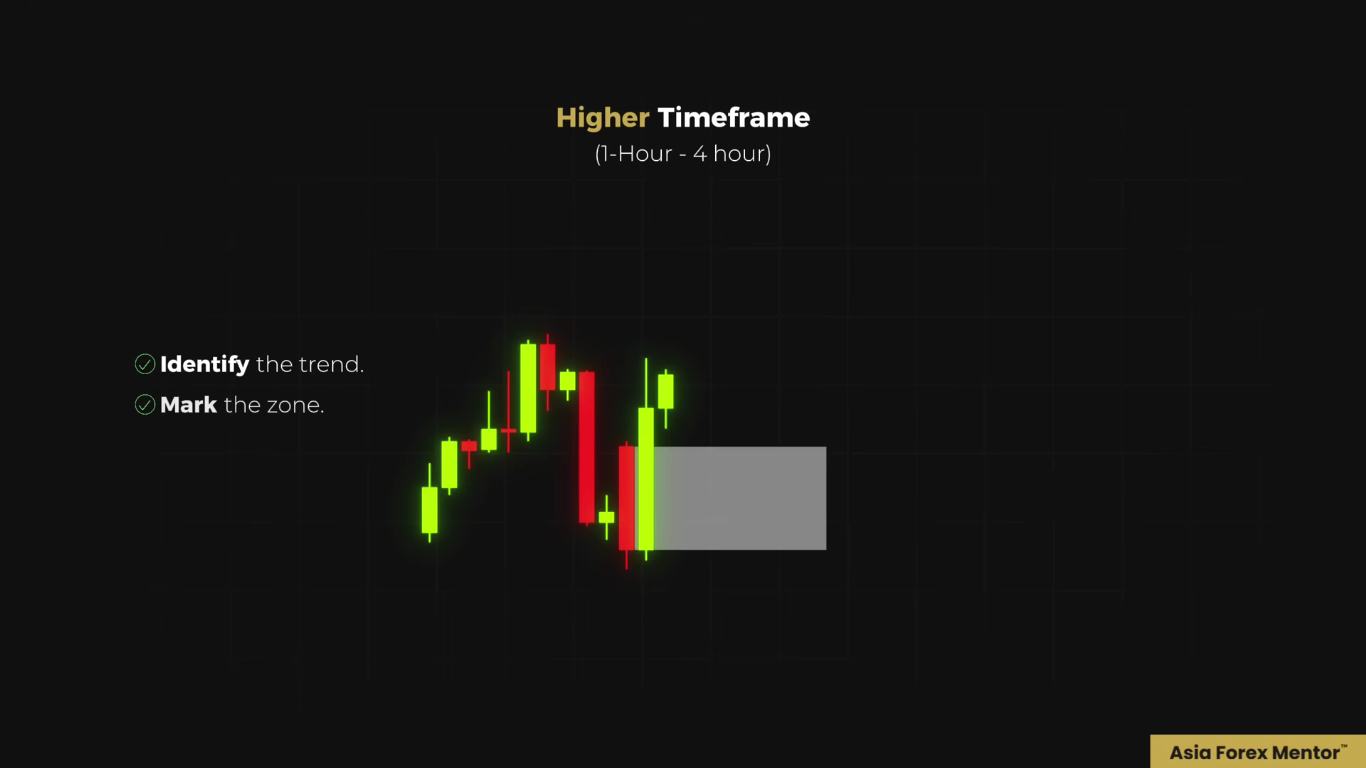 which is how you have learned already. The 1 hour and 4 hour zones are the most reliable zones. Price respects them more consistently than anything below this timeframe, the 1 hour and 4 hour. So once you've got your zones marked, you wait. You do nothing until price comes back towards it.
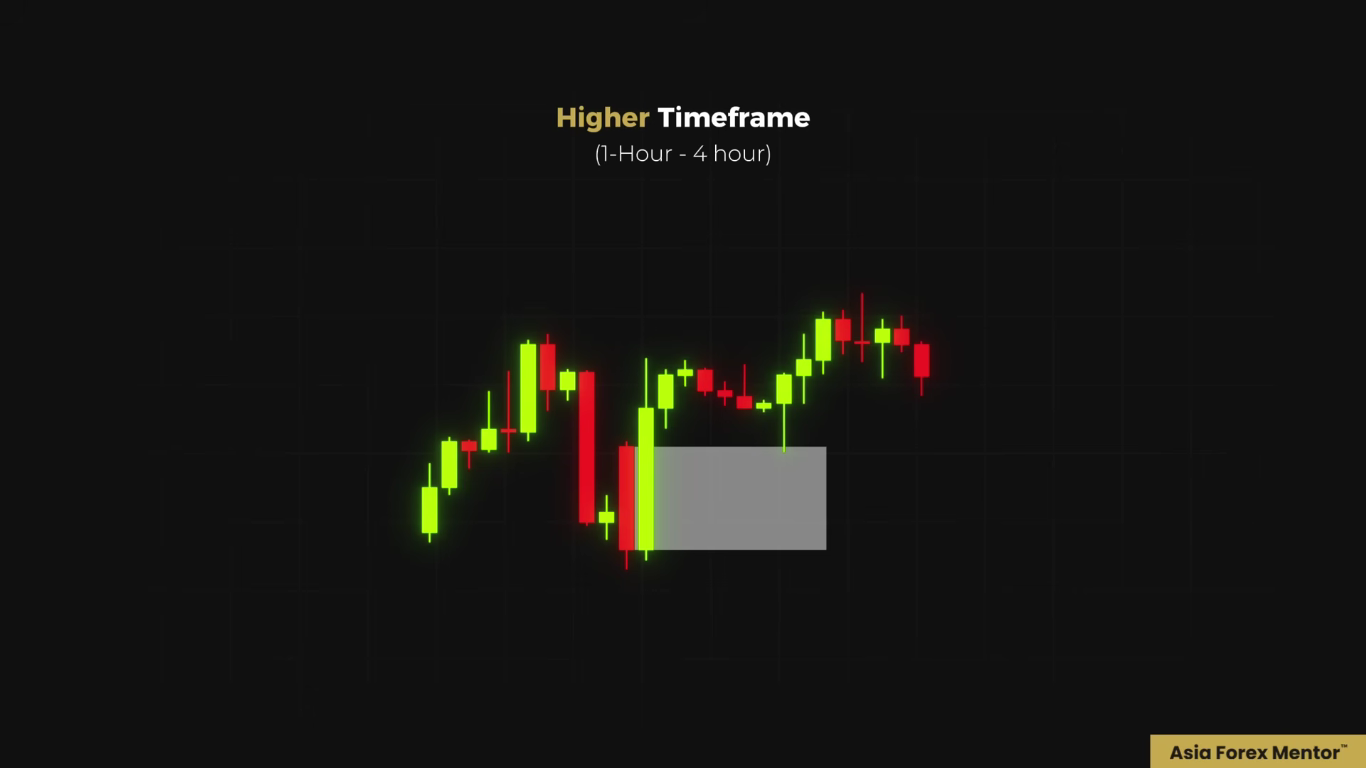
When price taps into that zone that you have drawn, this is your signal now to go down to the lower timeframe. Let's say the 15 minute chart or the five minute chart, depending on your setup itself. Your higher timeframe should always be at least two levels above your entry timeframe.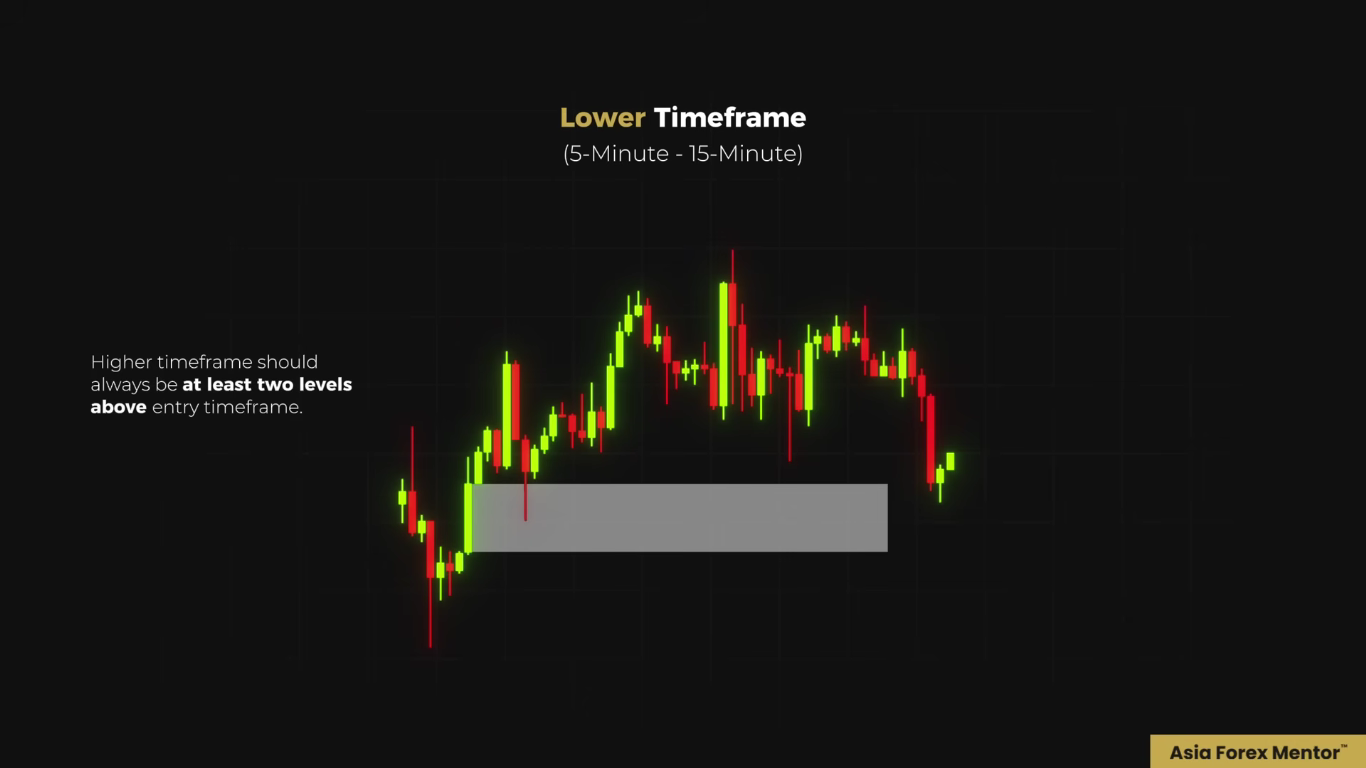 So if you're analyzing the 1 hour, you drop to the 15 minute to execute your trade. This is rule-based. This is non-negotiable. The higher timeframe gives you the context. The lower timeframe, it now gives you the precision.
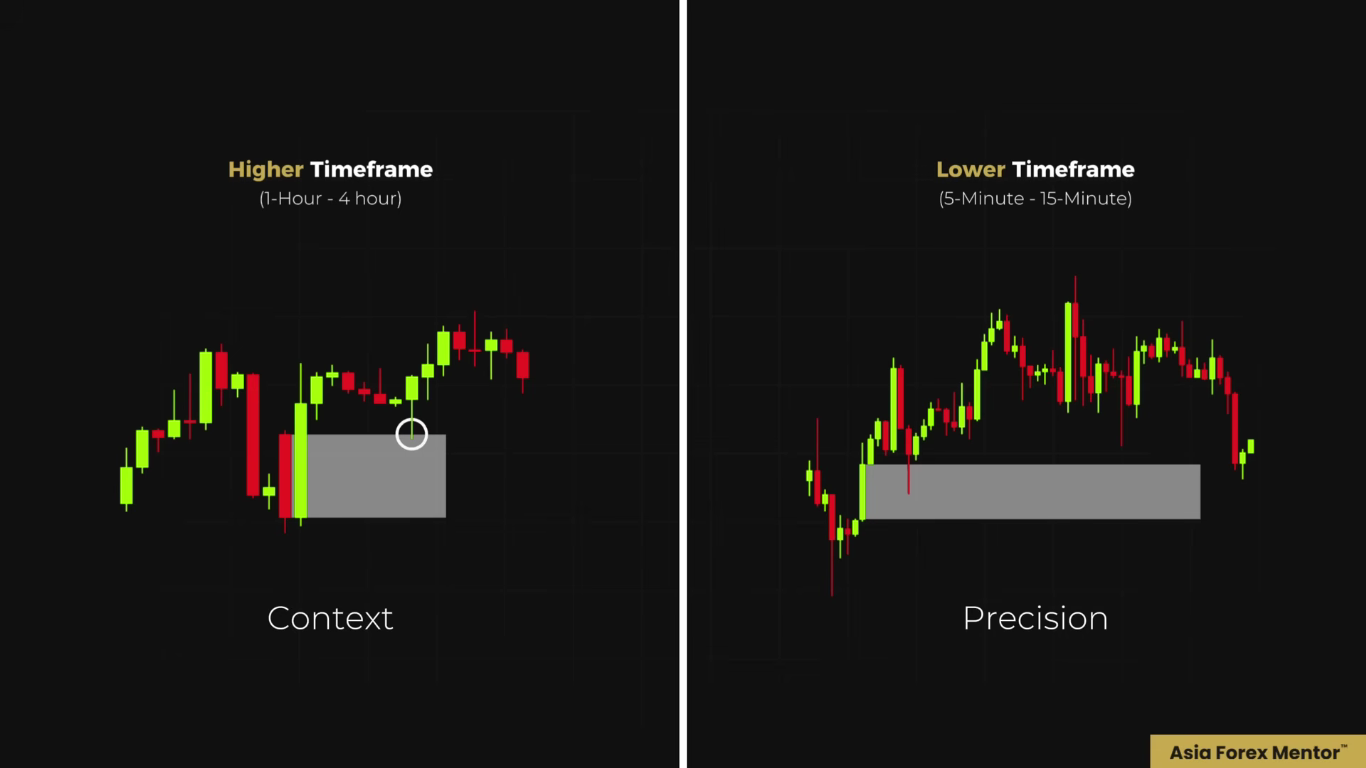
Entry Model 1: The Fair Value Gap
Once that market shift forms, this is where the three entry models come in, starting with the fair value gap. After price taps into the higher timeframe zone, and then it forms a market structure shift in the lower timeframe, what you want to look for now is a fair value gap that forms within that market structure shift itself.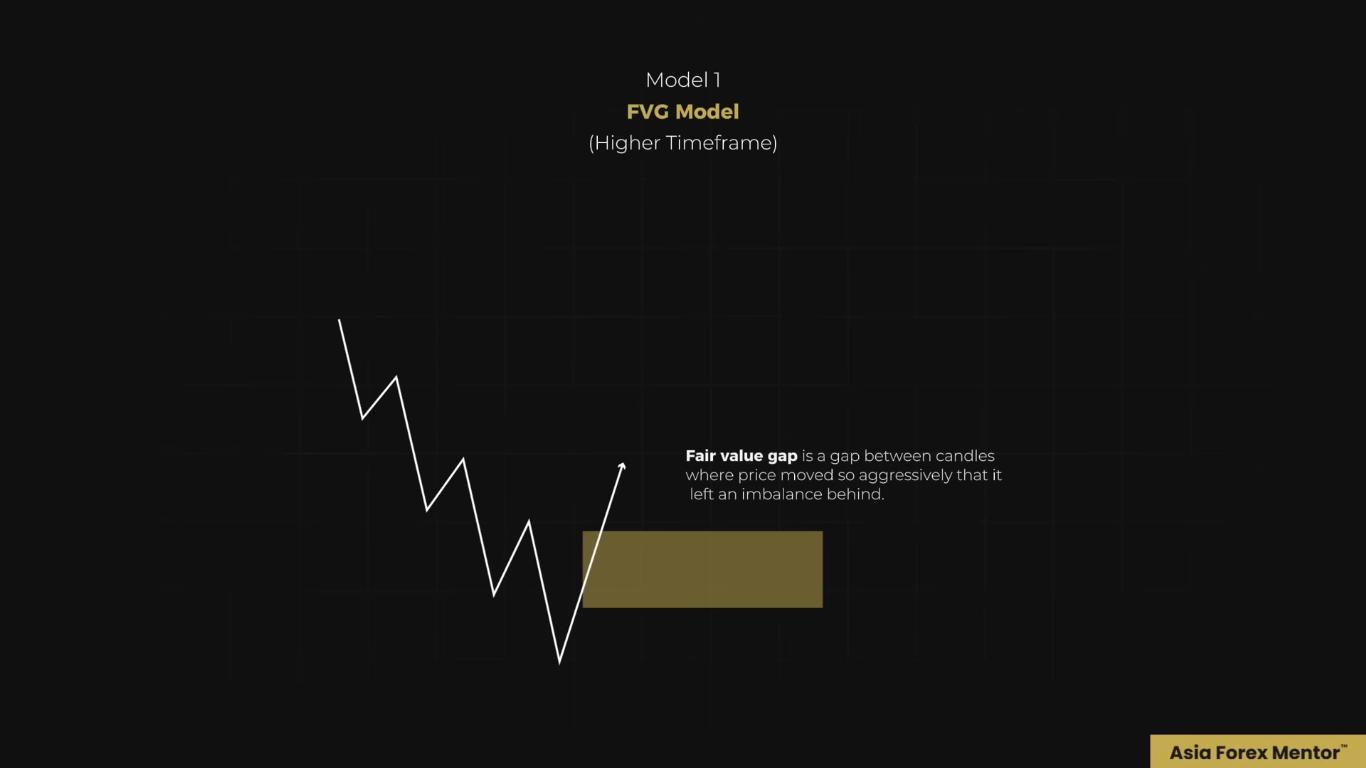 A fair value gap is a gap between the candles where price moves so aggressively that it left an imbalance behind. This is an area that wasn't properly traded through. So this imbalance is going to act as a magnet.
 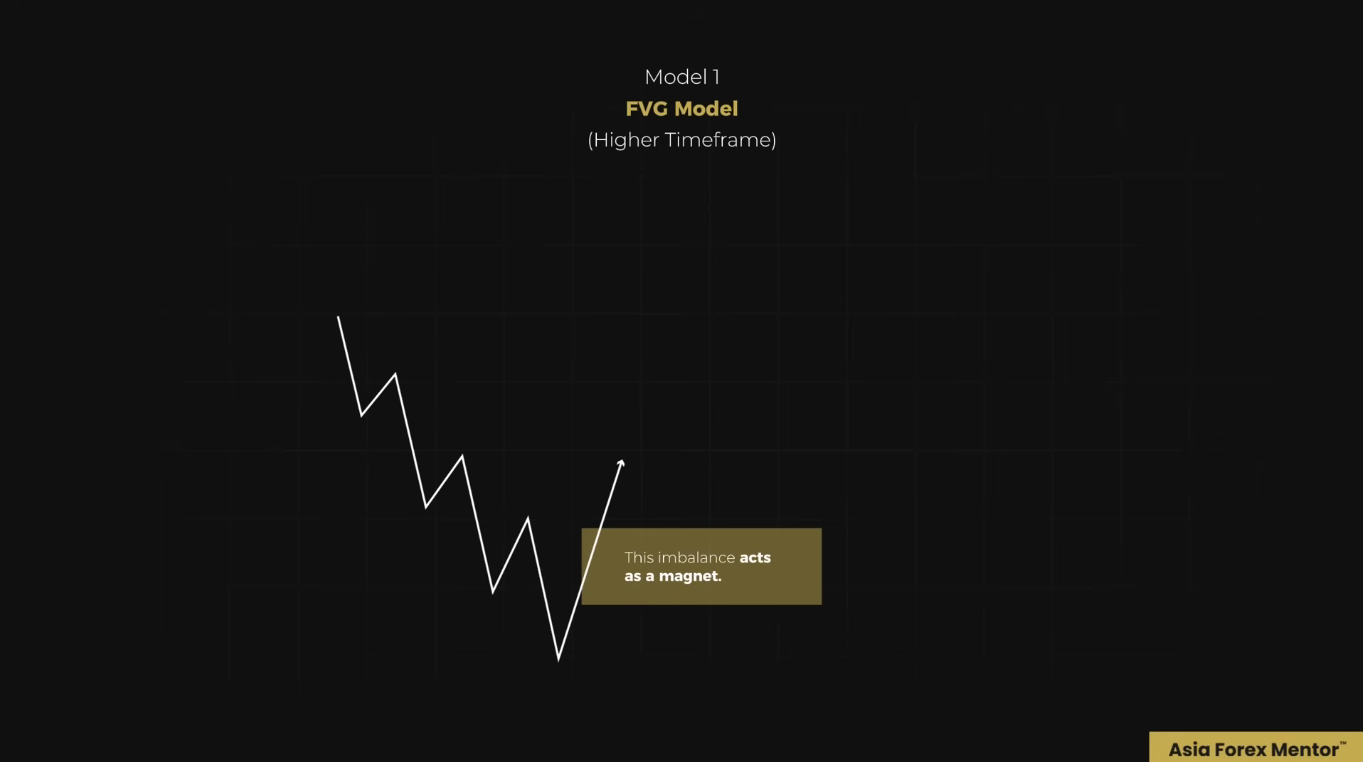 Price often retraces back into it before continuing into the direction of the higher timeframe trend itself.
So this is your entry point. You can place a limit order inside that fair value gap. You wait for price to go towards it and activate it. Now, for your take profit target, you would aim for the nearest liquidity pool in the lower timeframe.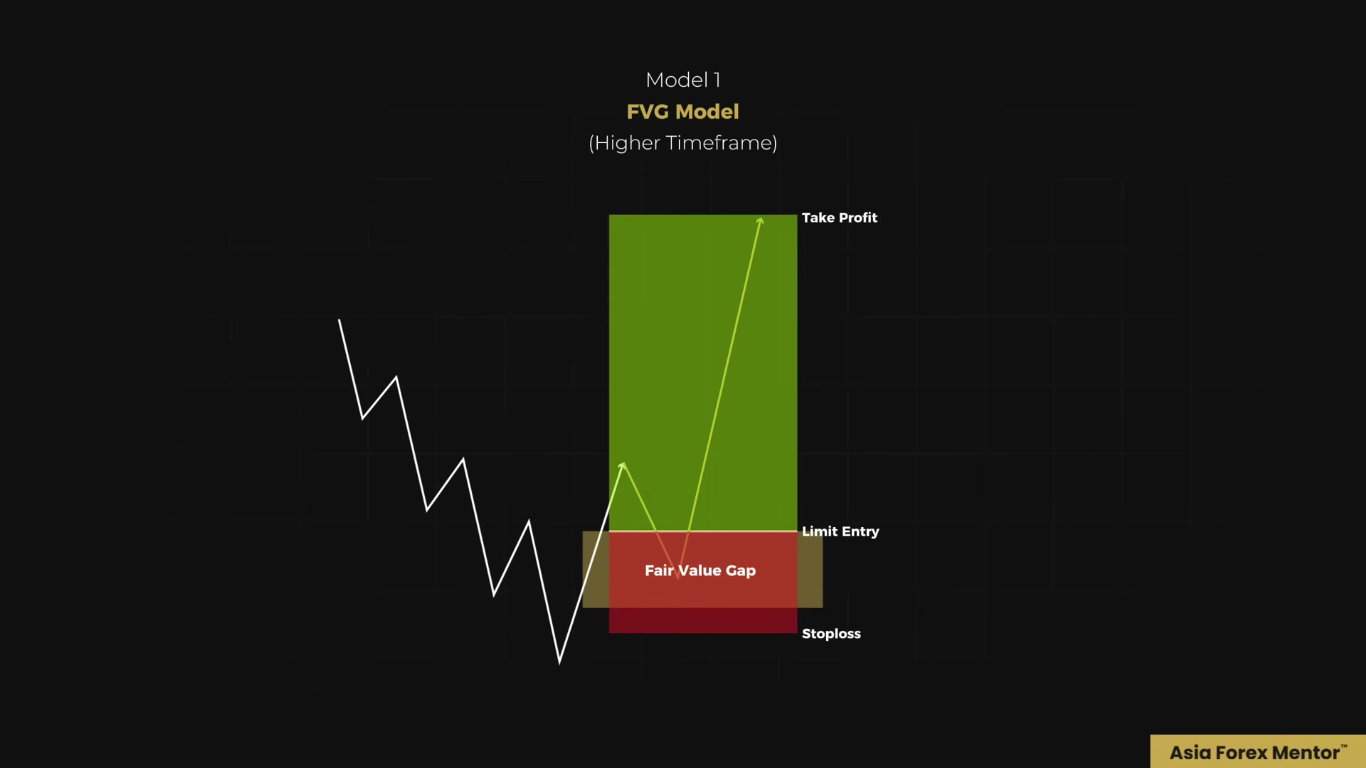 Or let's say you want to go for the bigger move, you can aim for the next key level on the higher timeframe itself. Both work depending on what setup, what strategy you want to use.
Entry Model 2: The Mitigation Block
The second entry model is called the mitigation block. Here's the sequence that you need to see in the lower timeframe. After price taps the higher timeframe zone that you have marked, price creates a swing low, and then a swing high, and then after which a higher low itself. 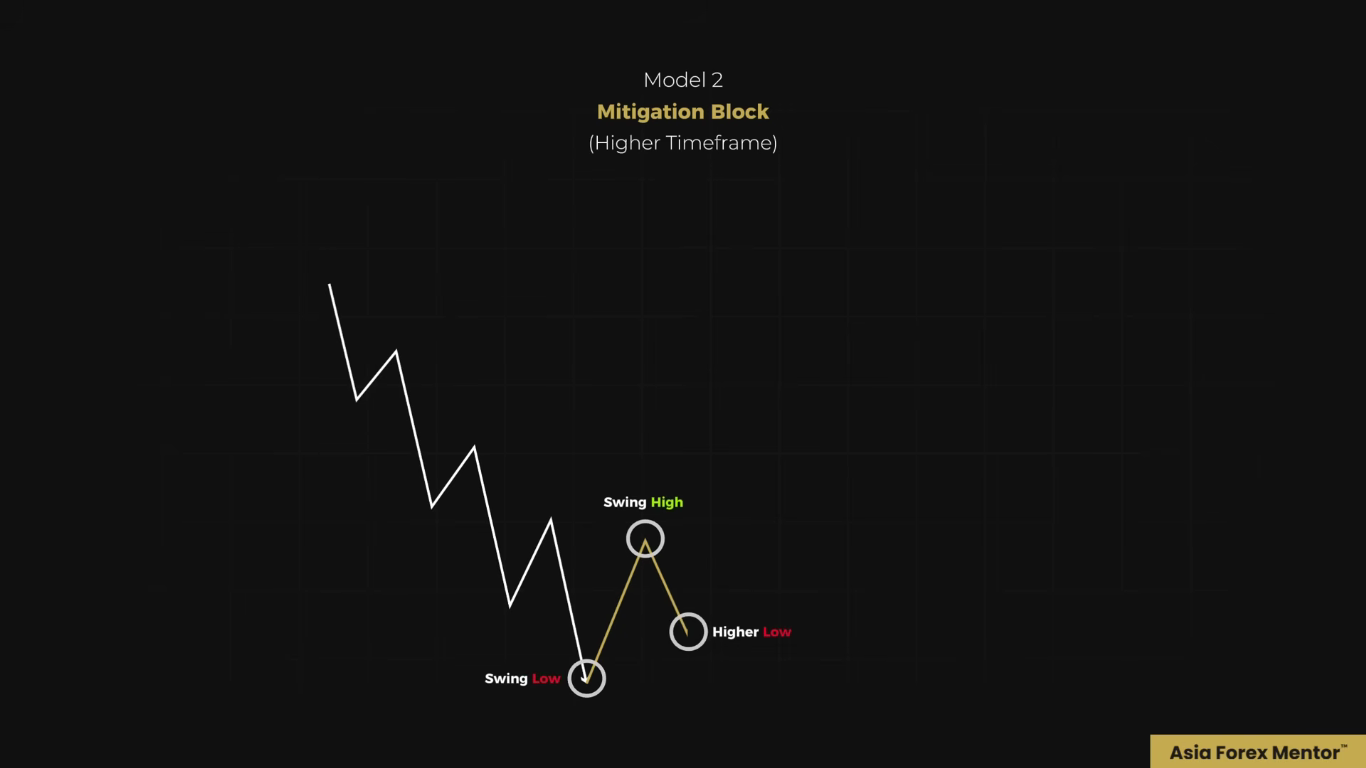 After that, you want to see the market structure shift, with a strong bullish displacement candle that closes above that swing high. When that happens, the up-close candle, or a series of candles that close between the first low and first high, this is your mitigation block. So now you can place a limit order at the highest point of that mitigation block. And then you wait for price to come back and activate it. The key distinction here is that the mitigation block forms on a higher low. So if you see a lower low instead, this is a different setup entirely. It's not this entry model itself. And that brings us to the third model.
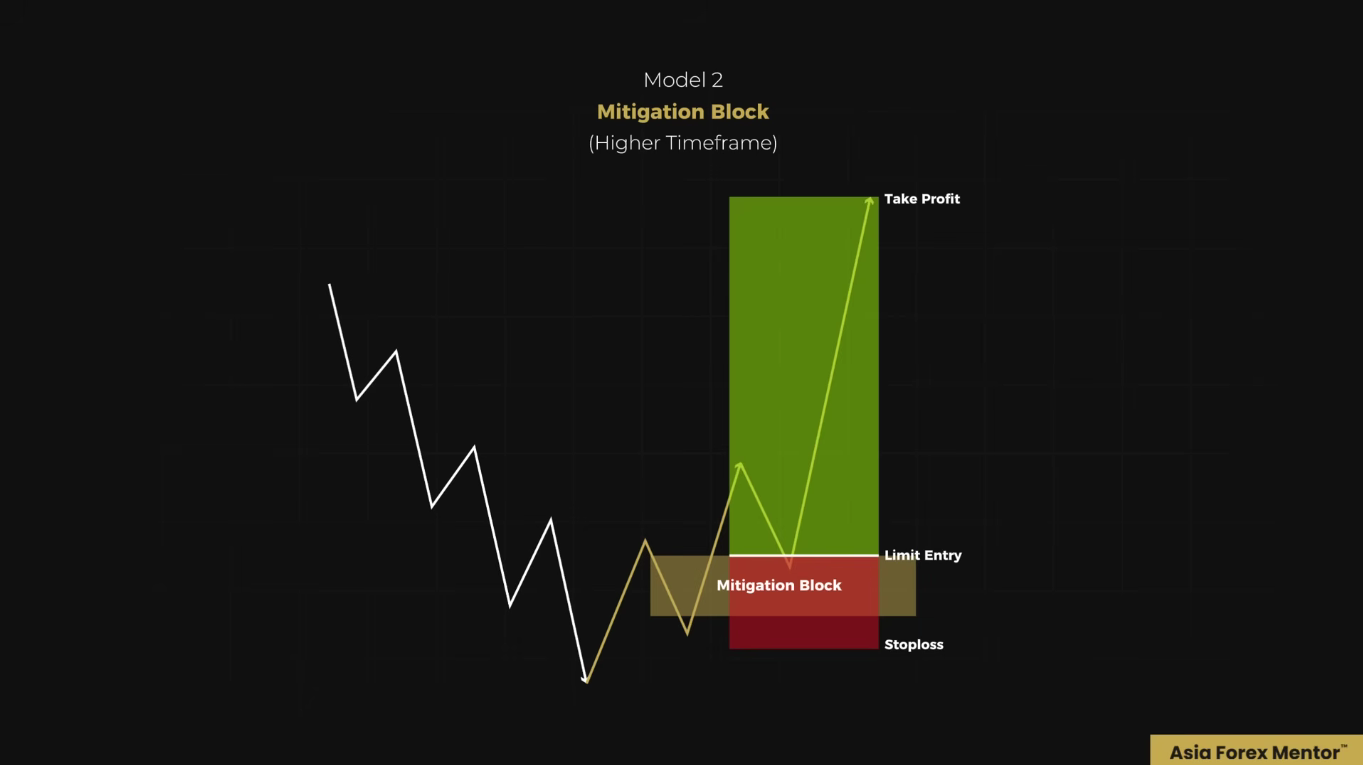
Entry Model 3: The Breaker Block
For the third entry model, which is where we're going to cover all the scenarios out there, this is the breaker block. This follows a very specific sequence. On the lower timeframe, price creates a swing low and then a swing high. So then this is what separates it from the mitigation block, a lower low. After that lower low itself, you need to see an immediate expansion move in the opposite direction. This produces the market structure shift itself. Now the up-close candle forms between the first swing low and the swing high. That area now becomes your breaker block zone. This is where you place your long entry.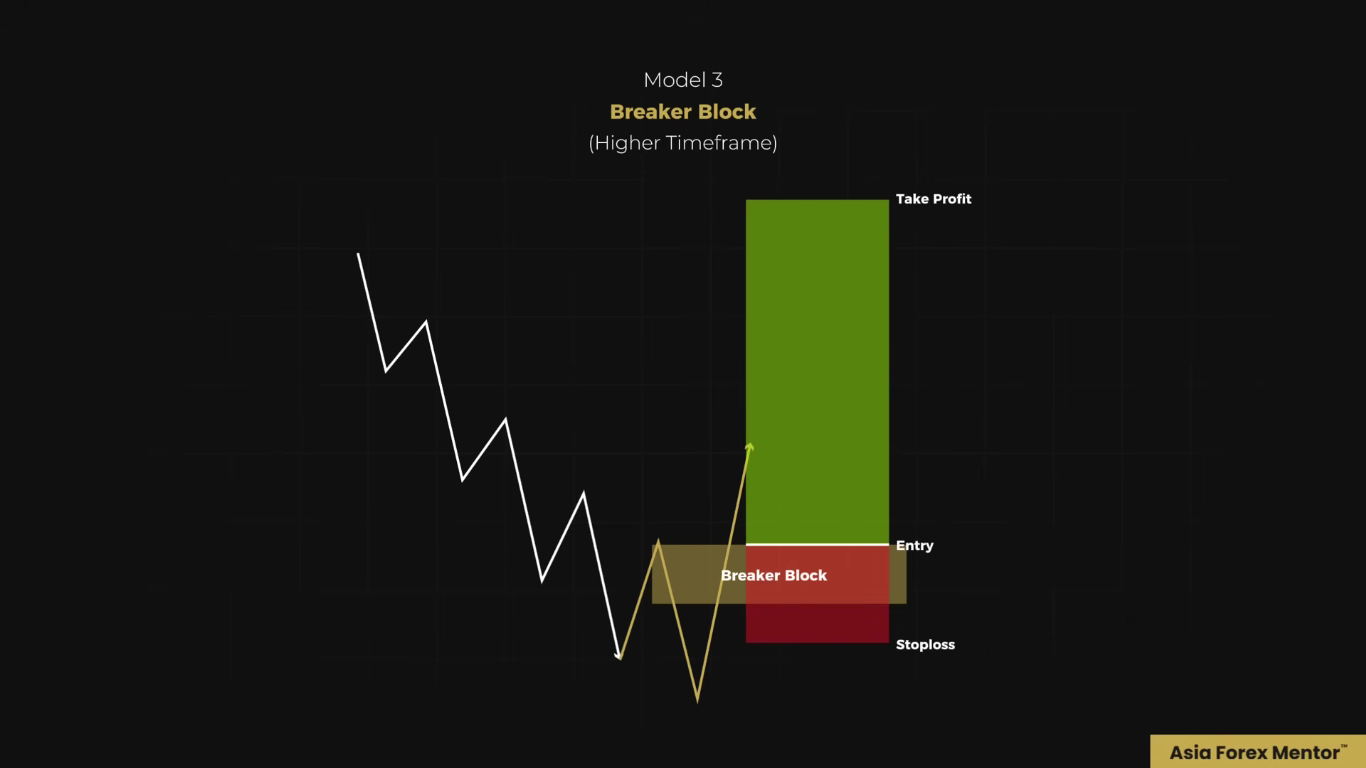 So now the difference is simple. Mitigation block, higher low. Breaker block, lower low. Both of them are valid. Both of them are powerful, but they are not the same setup, so you don't mix them up.
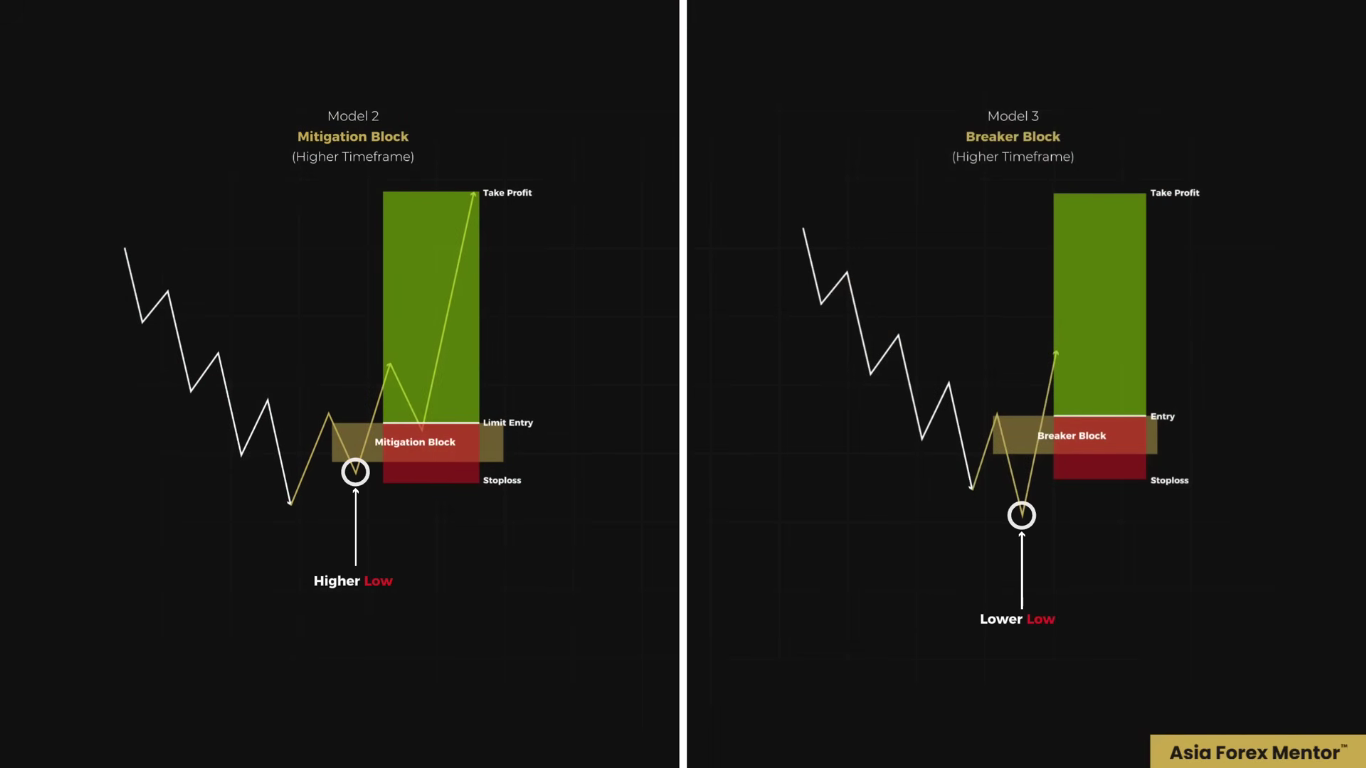
Real Chart Example
So now, let me show you how this actually plays out on the real chart itself. This is the 4-hour chart. Price is now in a clear downtrend. There is multiple bearish breaks of structure that is already confirmed. This tells us one thing, that we are looking for short opportunities. 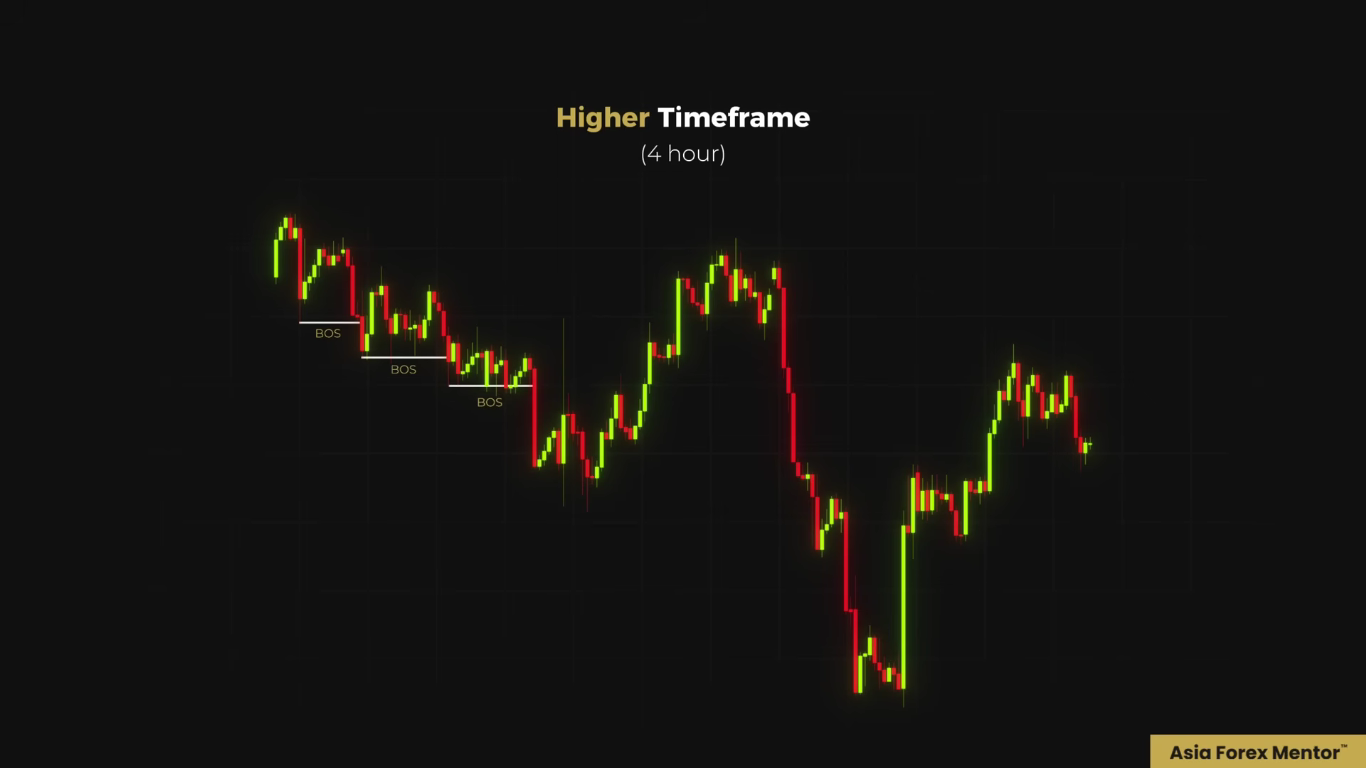 Then we identify the most recent bearish break of structure. From there, we trace back to the origin of the move that caused it. And then we mark those up-close candles as our supply zone. This is a fresh unmitigated zone itself. That is the zone that we are watching.
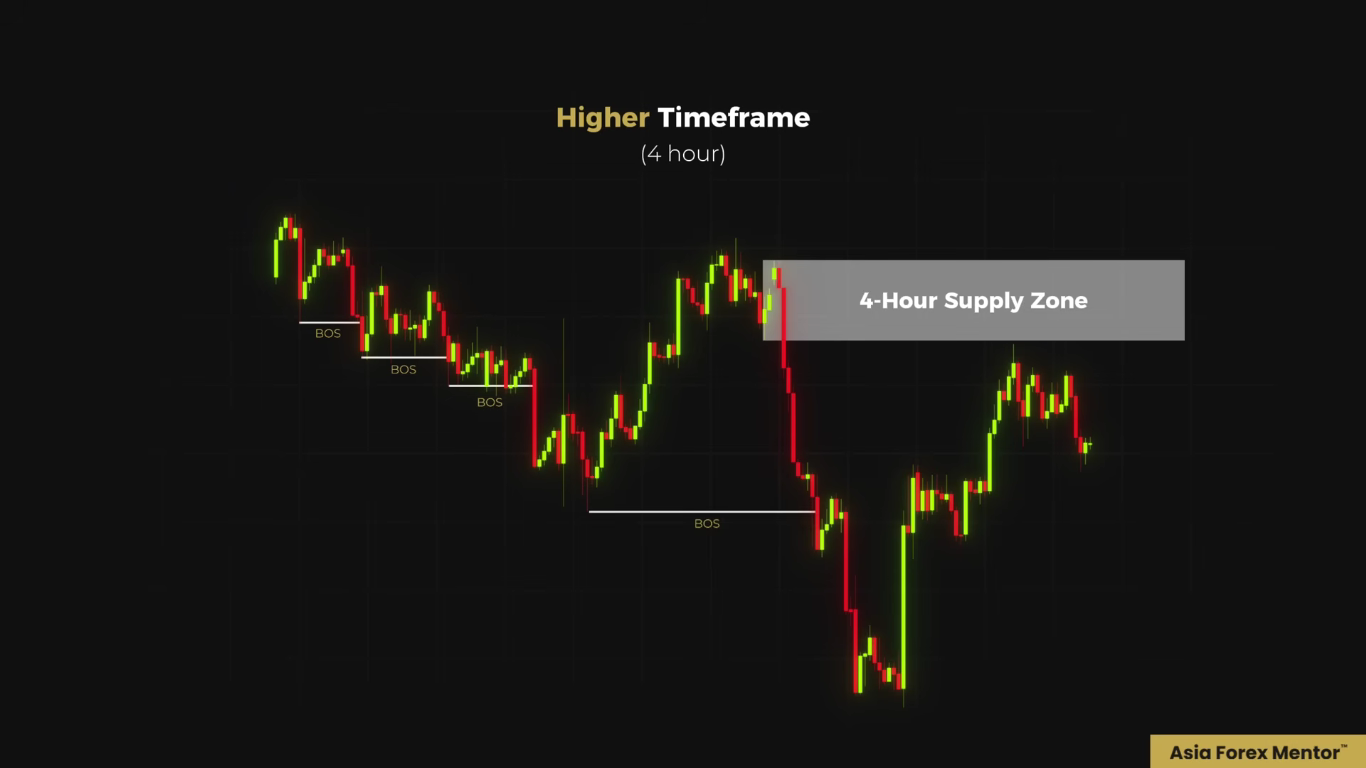
Now price pushes higher, and now it taps directly into that 4-hour supply zone that we have marked.  So now all the criteria are in place. We got a strong downtrend that is confirmed.
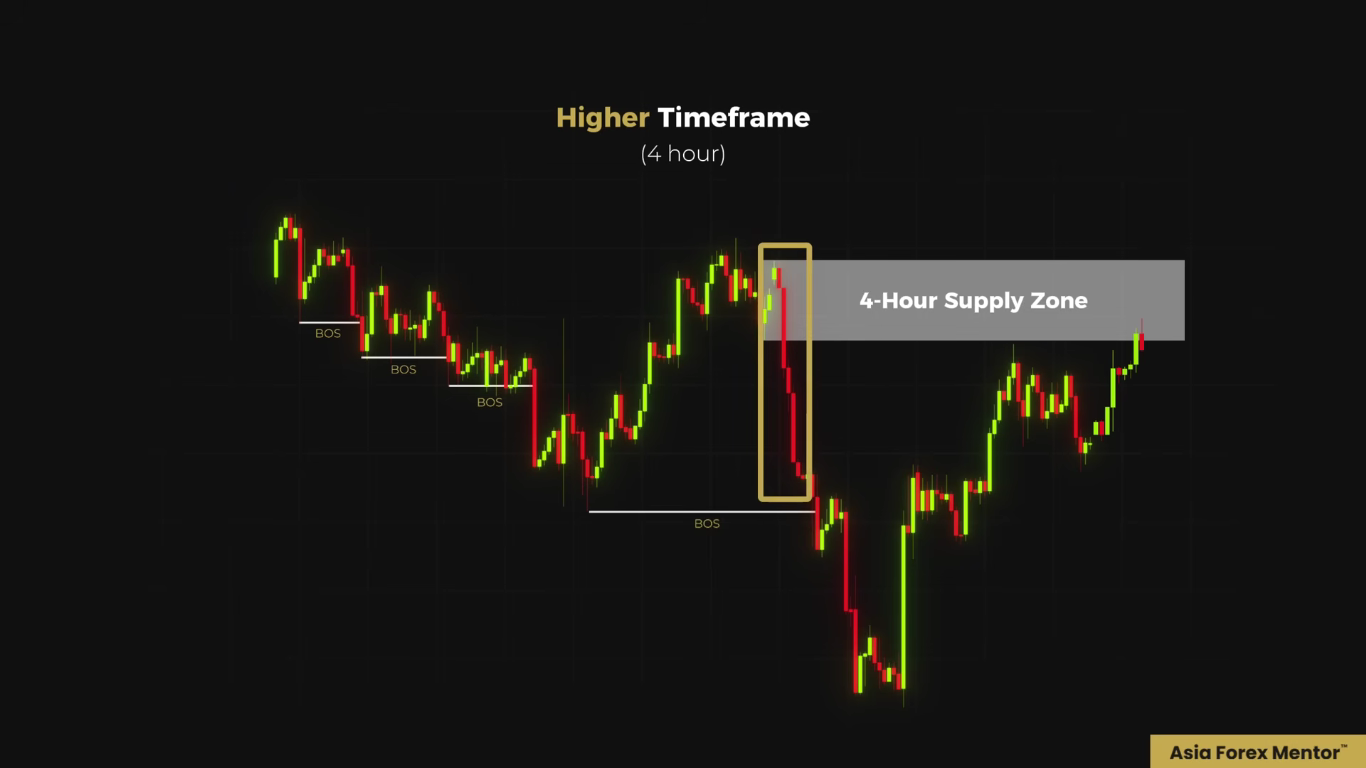 We got a break of structure that is confirmed.
 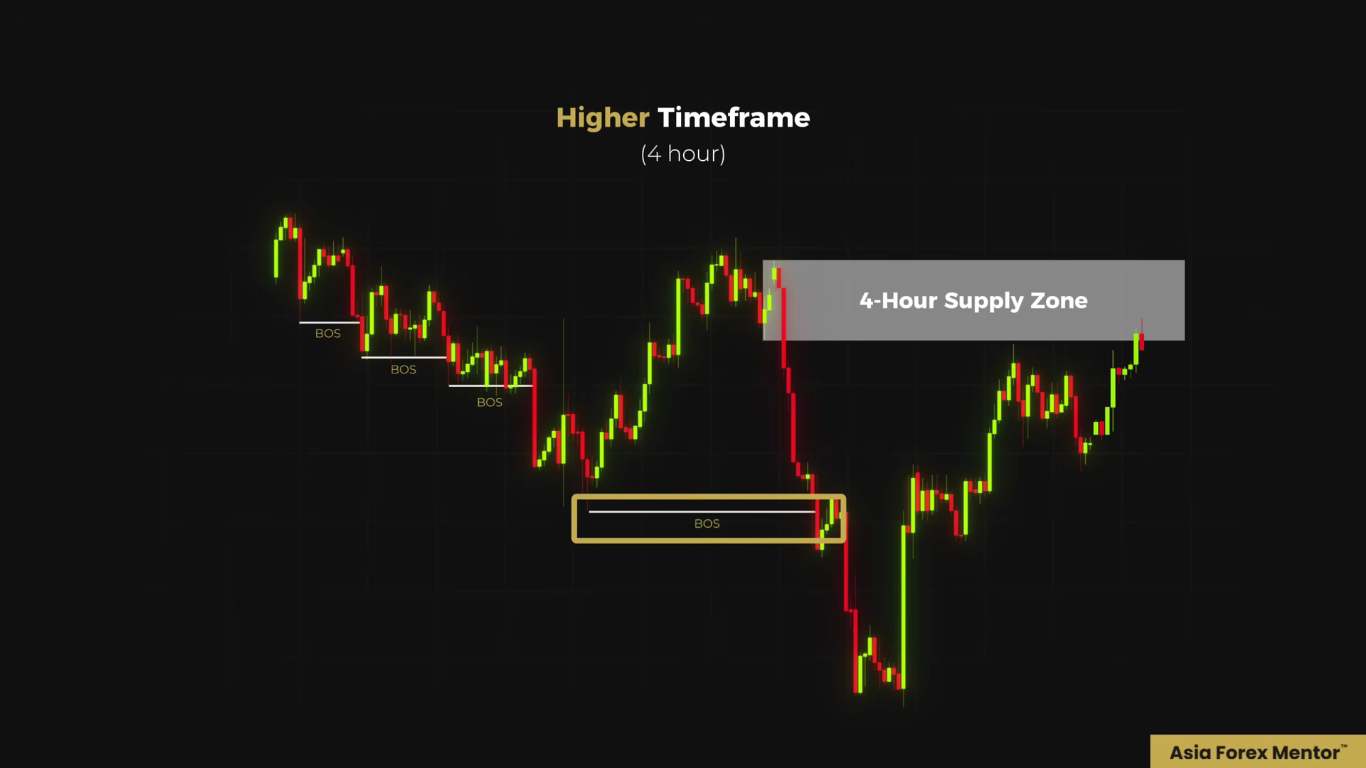 And then we got a fresh supply zone that we have marked. And now that is tapped by price itself.
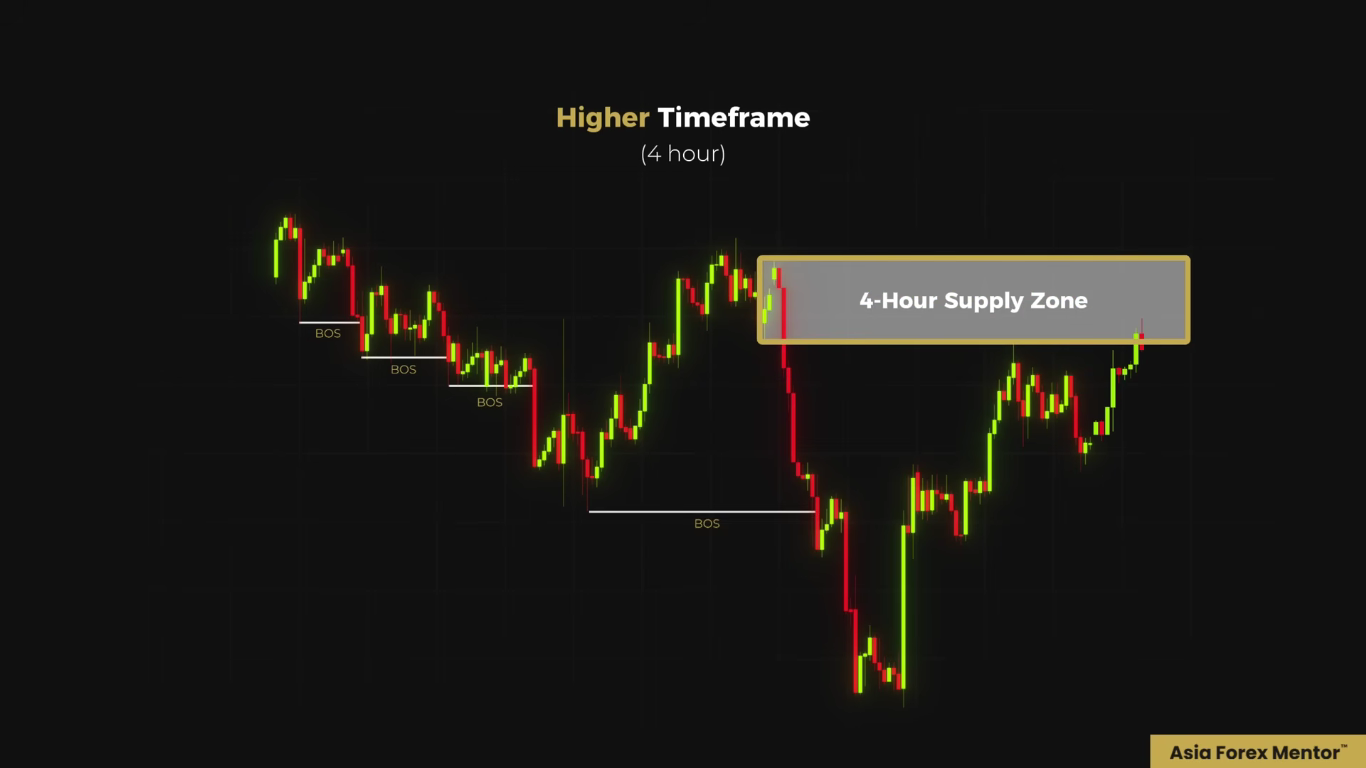
The next step is to drop down the timeframe. We now zoom into the 15 minute chart. On the 15 minute chart, price taps into that higher timeframe supply zone. 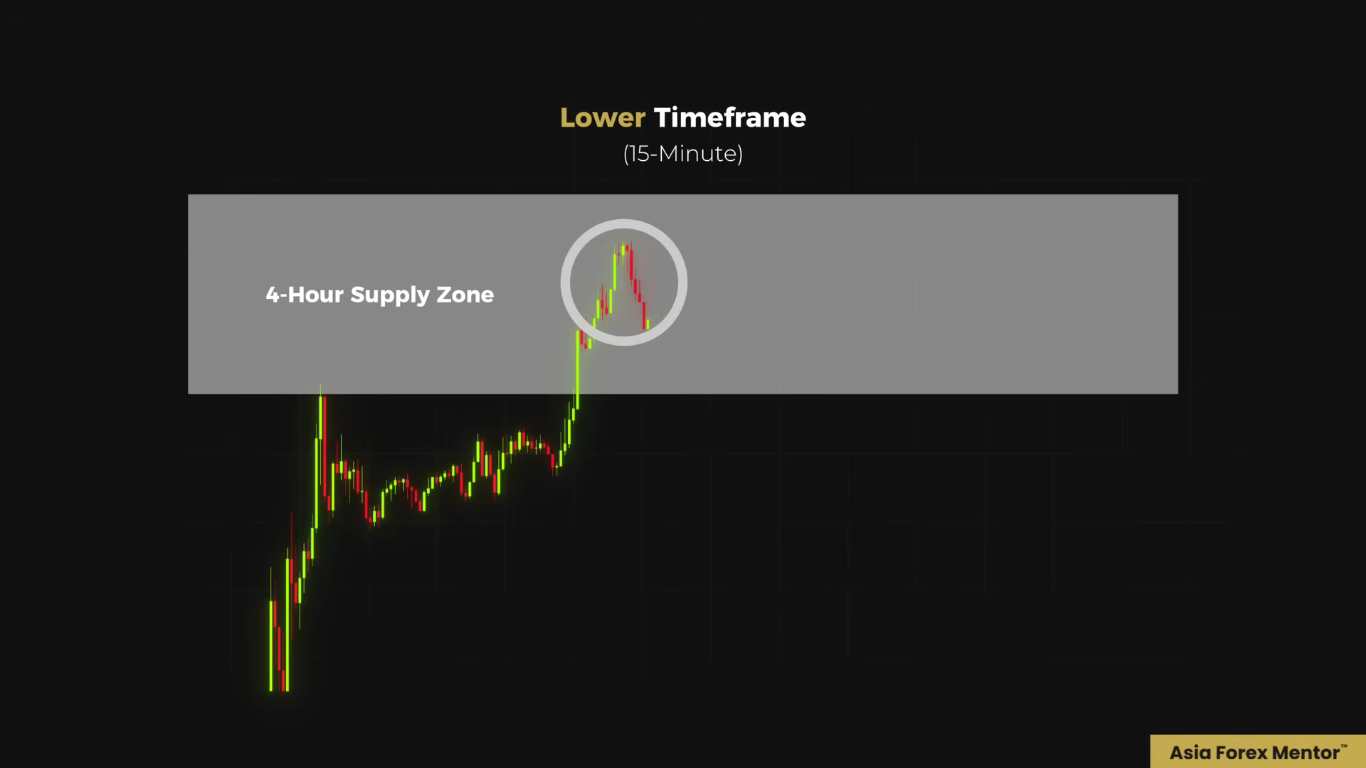 And then immediately it forms a market structure shift. At the same time, a breaker block forms. There is down-close candles. The sequence was: swing high, swing low, and then a higher high. Then price immediately reverses and closes below these two down-close candles. This confirms the breaker block.
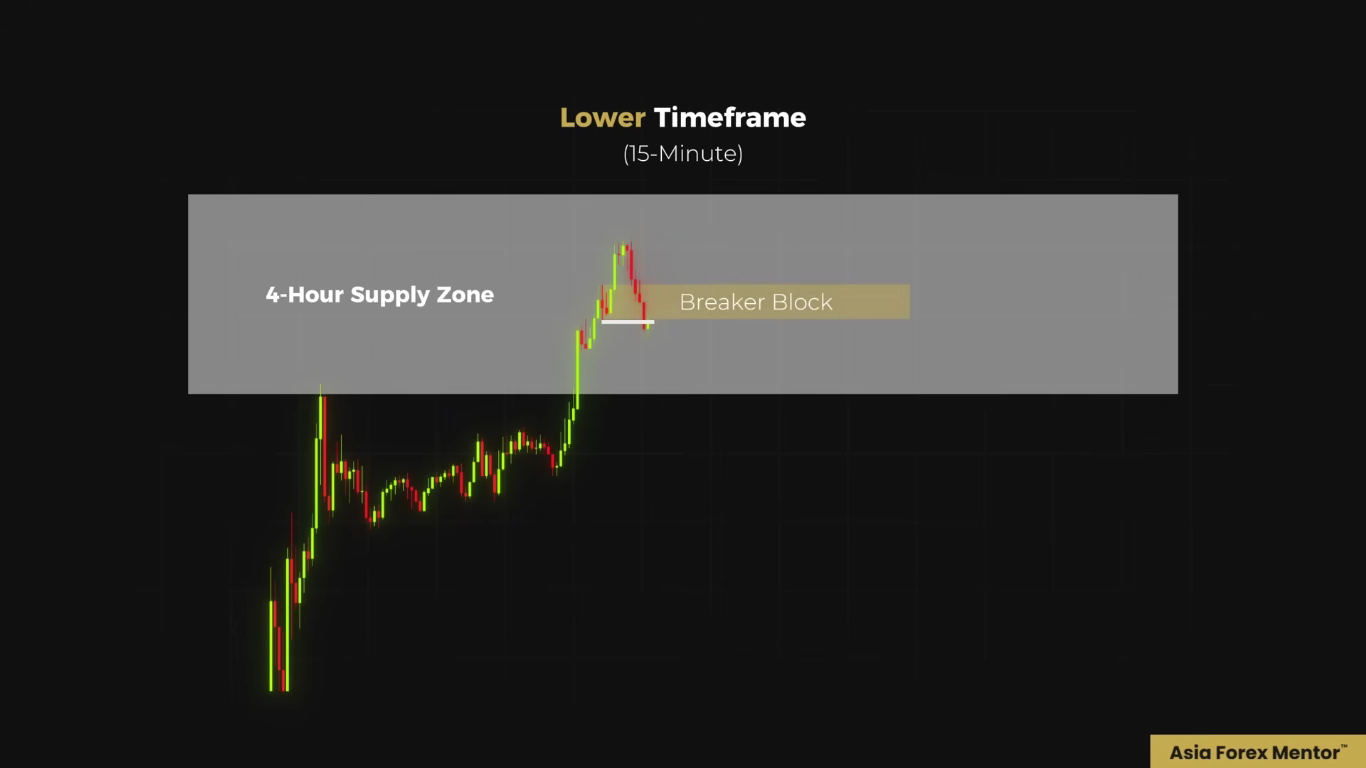
Now your entry is now set at the lowest point of the breaker block. Your stop loss, straightforward, just sit above the higher high.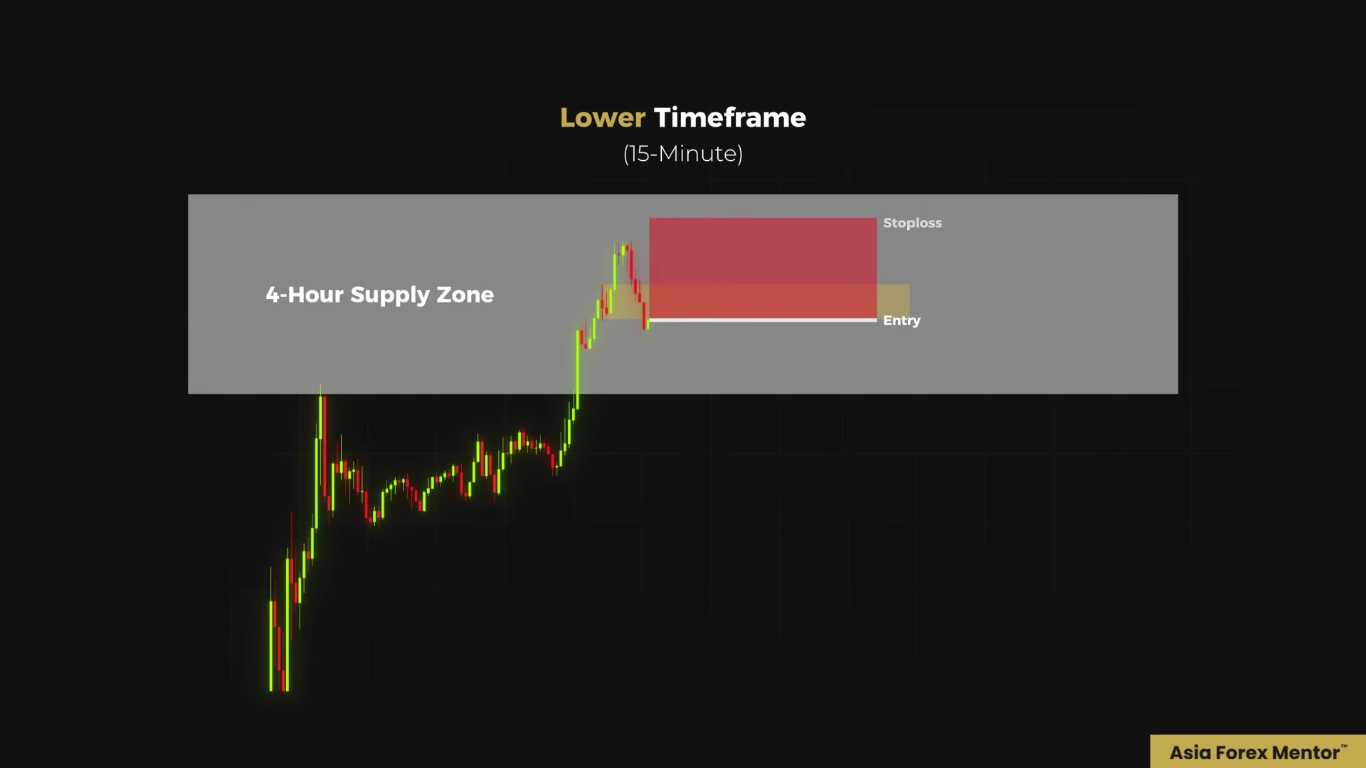 And then your take profit target is at the sell-side liquidity area, which is below the swing low. This will give you a really good risk to reward ratio. For example, in this case, it's like a one is to four risk to reward ratio. So what happens is that the trade would trigger,
 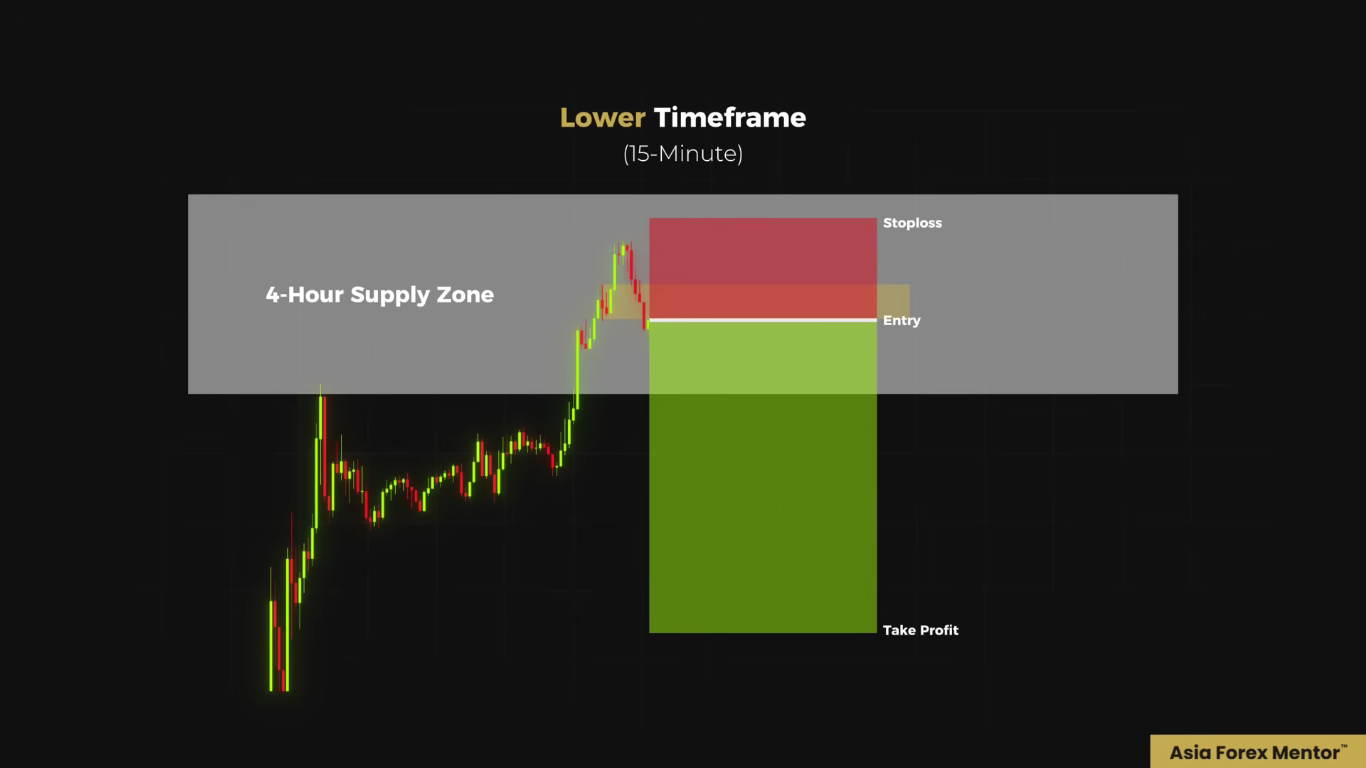 and then the price reverses, and then boom, you get a nice take profit if it goes down. Awesome risk to reward ratio.
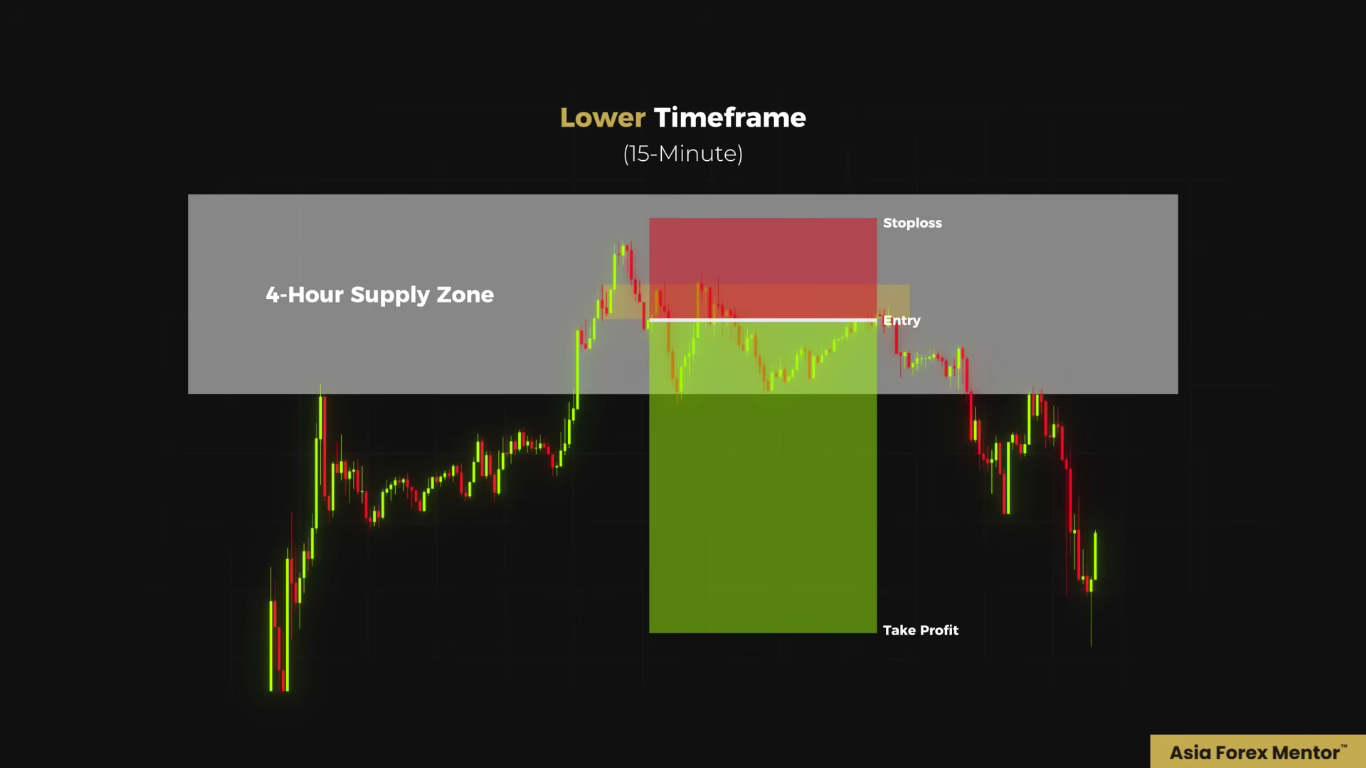
Putting Supply and Demand Trading Together
So here's what it all comes down to. Most traders, they spend years drawing zones and wondering why price just keeps blowing past them. Now you know why. A weak zone is not a zone. It's a trap that you set for yourself.
But when you draw it right, when there's three aggressive candles, the origin of the move, including the wick, and then you wait for the lower timeframe to confirm with the market structure shift, before entering with a fair value gap, a mitigation block, or a breaker block — this is when supply and demand stops becoming a guessing game anymore, and becomes a high probability system that I've just given you.
What To Do Next
If you want to go deeper, I've put together a free training that walks you through the exact three-step system that I use to find high-probability trades, with sniper-level entries, real risk control, and zero guesswork.
This is the same system that I use myself, and the same one that has helped thousands of traders go from frustration to consistency.
No fluff. No filler. Just pure strategy.
👉 FREE 3-Step Training: https://bit.ly/Free-3-StepTraining
Frequently Asked Questions
What is supply and demand trading?
Supply and demand trading is a price action method that identifies zones where strong buying (demand) or selling (supply) entered the market, then trades reactions when price returns to those zones.
How do you know if a supply or demand zone is strong?
A strong zone is created by impulsive movement, at least three consecutive momentum candles with large bodies and strong push distance. If the move is slow or hesitant, the zone is weak.
Where should you draw a supply and demand zone?
Draw it from the origin of the move, either the candle that initiated the move or the last opposing candle before it. When a wick shows where price was rejected, draw from the tip of the wick, not the candle body.
What are the three supply and demand entry models?
The fair value gap, the mitigation block, and the breaker block. All three wait for a lower-timeframe market structure shift after price taps the higher-timeframe zone. The mitigation block forms on a higher low; the breaker block forms on a lower low.
Which timeframes work best for supply and demand trading?
The 1-hour and 4-hour zones are the most reliable. The higher timeframe should be at least two levels above the entry timeframe, for example, analyzing on the 4-hour and executing on the 15-minute.