English
 简体中文
简体中文 繁體中文
繁體中文 日本語
日本語 한국어
한국어 Bahasa Melayu
 Bahasa Indonesia
 Filipino
 ไทย
ไทย Tiếng Việt
 हिन्दी
 العربية
 Italiano
 Português
 Русский
 Español
 Français
 Singapore
 Cambodia
 Myanmar
 Brunei
 Australia
  New Zealand
 Switzerland
 UAE
UAE United States
 Mexico
 Argentina
 South Africa
 IC Markets
 Pepperstone
 AvaTrade
 XM
XM Plus500
 RoboForex
 TMGM
TMGM Exness
 JustMarkets
 Orbex
Orbex Interactive Brokers
 Saxo
Saxo Tiger Brokers
 Binance
 Coinbase
 Gemini Exchange
 Kraken
 iFunds
 IC Funded
 The 5%ers
 TopStep
 IQ Option
 Pocket Option
 RaceOption
 IQCent
Divergence trading has been studied in technical analysis since J. Welles Wilder published the RSI in 1978, yet most traders who learn to spot the signal still lose money on it. The gap is not that divergence is unreliable. It is that recognizing the pattern and knowing exactly when to enter, where to stop out, and when to take profit are two completely different things.
|
ABOUT THIS GUIDE |
This guide covers what divergence trading is, how to identify all four divergence types on RSI and MACD, how to avoid the false signal traps that catch most traders, and a step-by-step entry, stop loss, and profit target method for each type. It also covers the risk management rules that keep losses controlled when a signal fails. |
|
QUICK ANSWER |
Divergence trading identifies potential reversals or continuations when price and a momentum indicator move in opposite directions. Four types exist: regular bullish, regular bearish, hidden bullish, and hidden bearish. Each has a defined entry trigger, stop loss placement, and profit target method that keeps risk controlled even when the signal fails. |
What Divergence Trading Actually Is
Divergence happens when price and a momentum indicator disagree. Price makes a new swing high, but the indicator makes a lower high. Price makes a new swing low, but the indicator makes a higher low. That disagreement signals the momentum behind the current move is weakening, even while price is still pushing in one direction.
Think of it this way. Price shows you what the market is doing. The indicator shows you how much force is behind that move. When they line up, the trend is healthy. When they diverge, the trend is losing energy and a change in direction becomes more probable.
This matters most in forex because currency pairs can hold a directional move for days or weeks before reversing. A divergence signal on the daily or four-hour chart gives early warning that momentum is fading, so a trader can position ahead of a turn rather than react after it is already underway.
The Four Core Divergence Types
Every divergence signal belongs to one of two categories. Regular divergence signals a potential reversal of the current trend. Hidden divergence signals a potential continuation of the current trend. Each category has a bullish and bearish version, giving four distinct setups.
Here is a summary of all four types at a glance:
| Type | Price Action | Indicator | Signal |
|---|---|---|---|
| Regular Bullish | Lower low | Higher low | Potential reversal up |
| Regular Bearish | Higher high | Lower high | Potential reversal down |
| Hidden Bullish | Higher low | Lower low | Potential continuation up |
| Hidden Bearish | Lower high | Higher high | Potential continuation down |
Regular Bullish Divergence
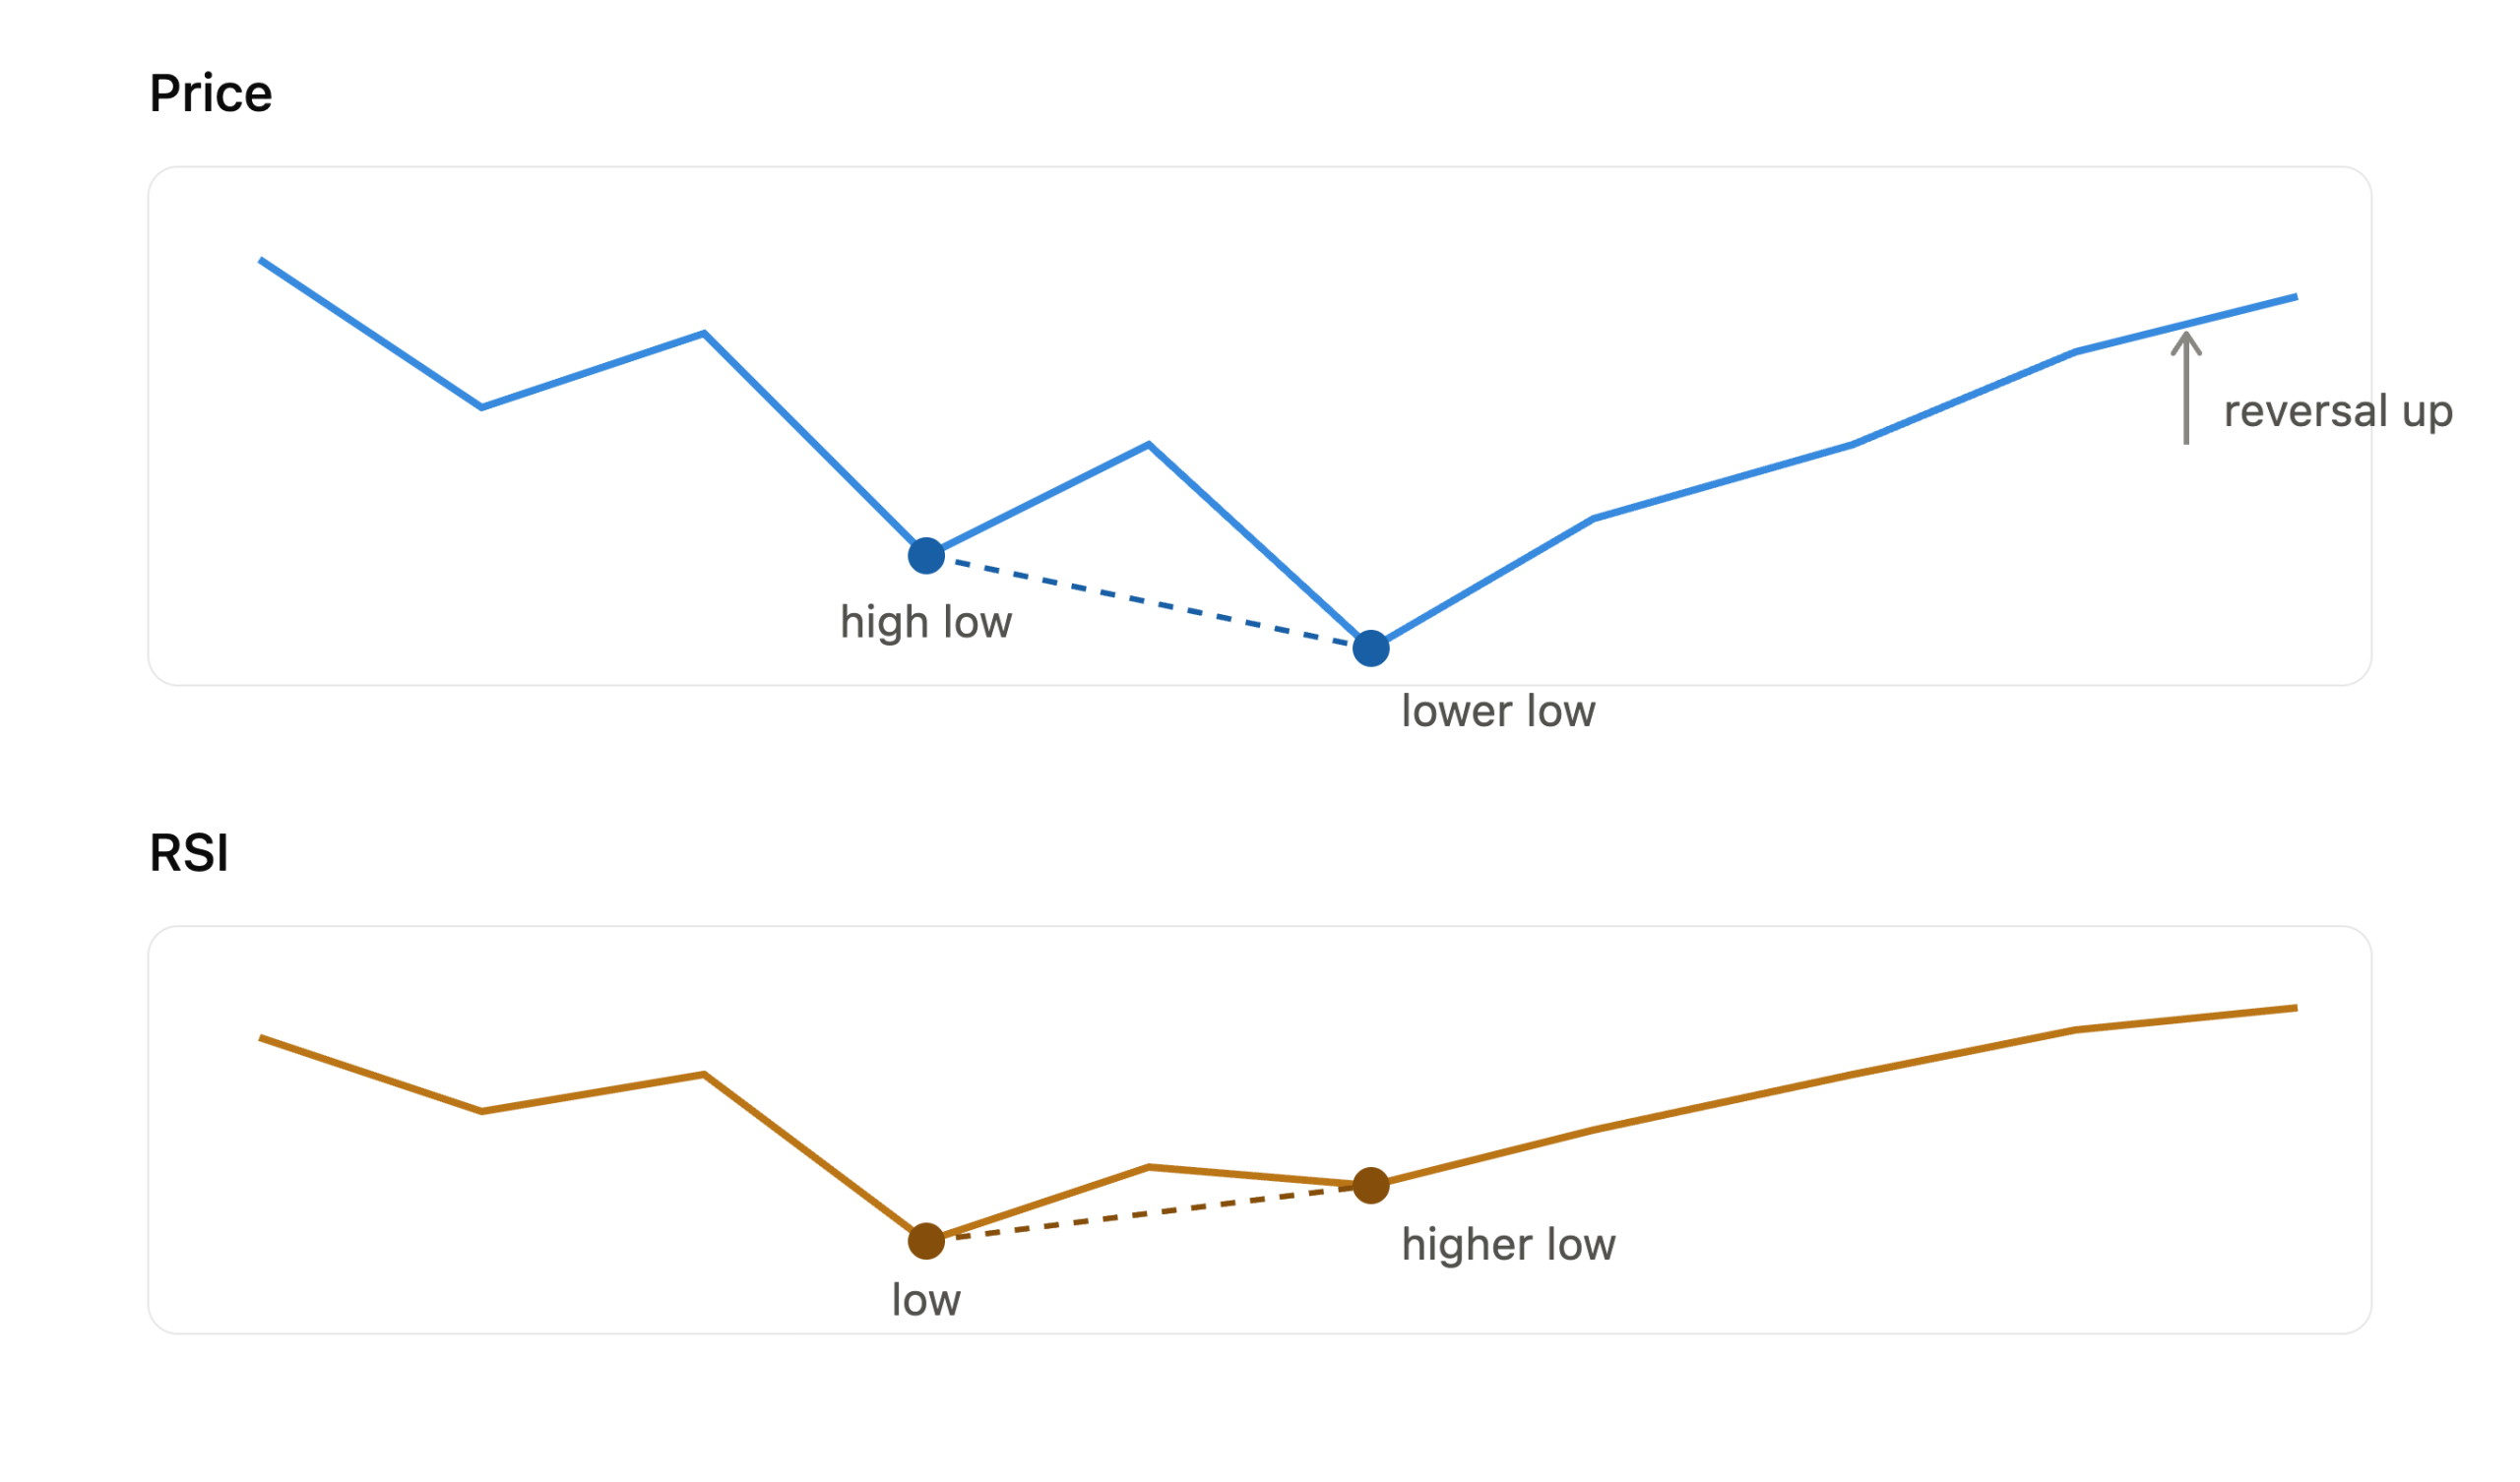
Regular bullish divergence forms at the bottom of a downtrend. Price makes a lower low, reaching a new swing bottom below the previous one. The RSI or MACD histogram makes a higher low at the same point. Sellers are still pushing price down, but the momentum behind those moves is fading.
This signal appears frequently at major support levels, which adds confluence and raises its reliability. The implication is that the downtrend is losing steam and a reversal higher is the likely next move.
Regular Bearish Divergence
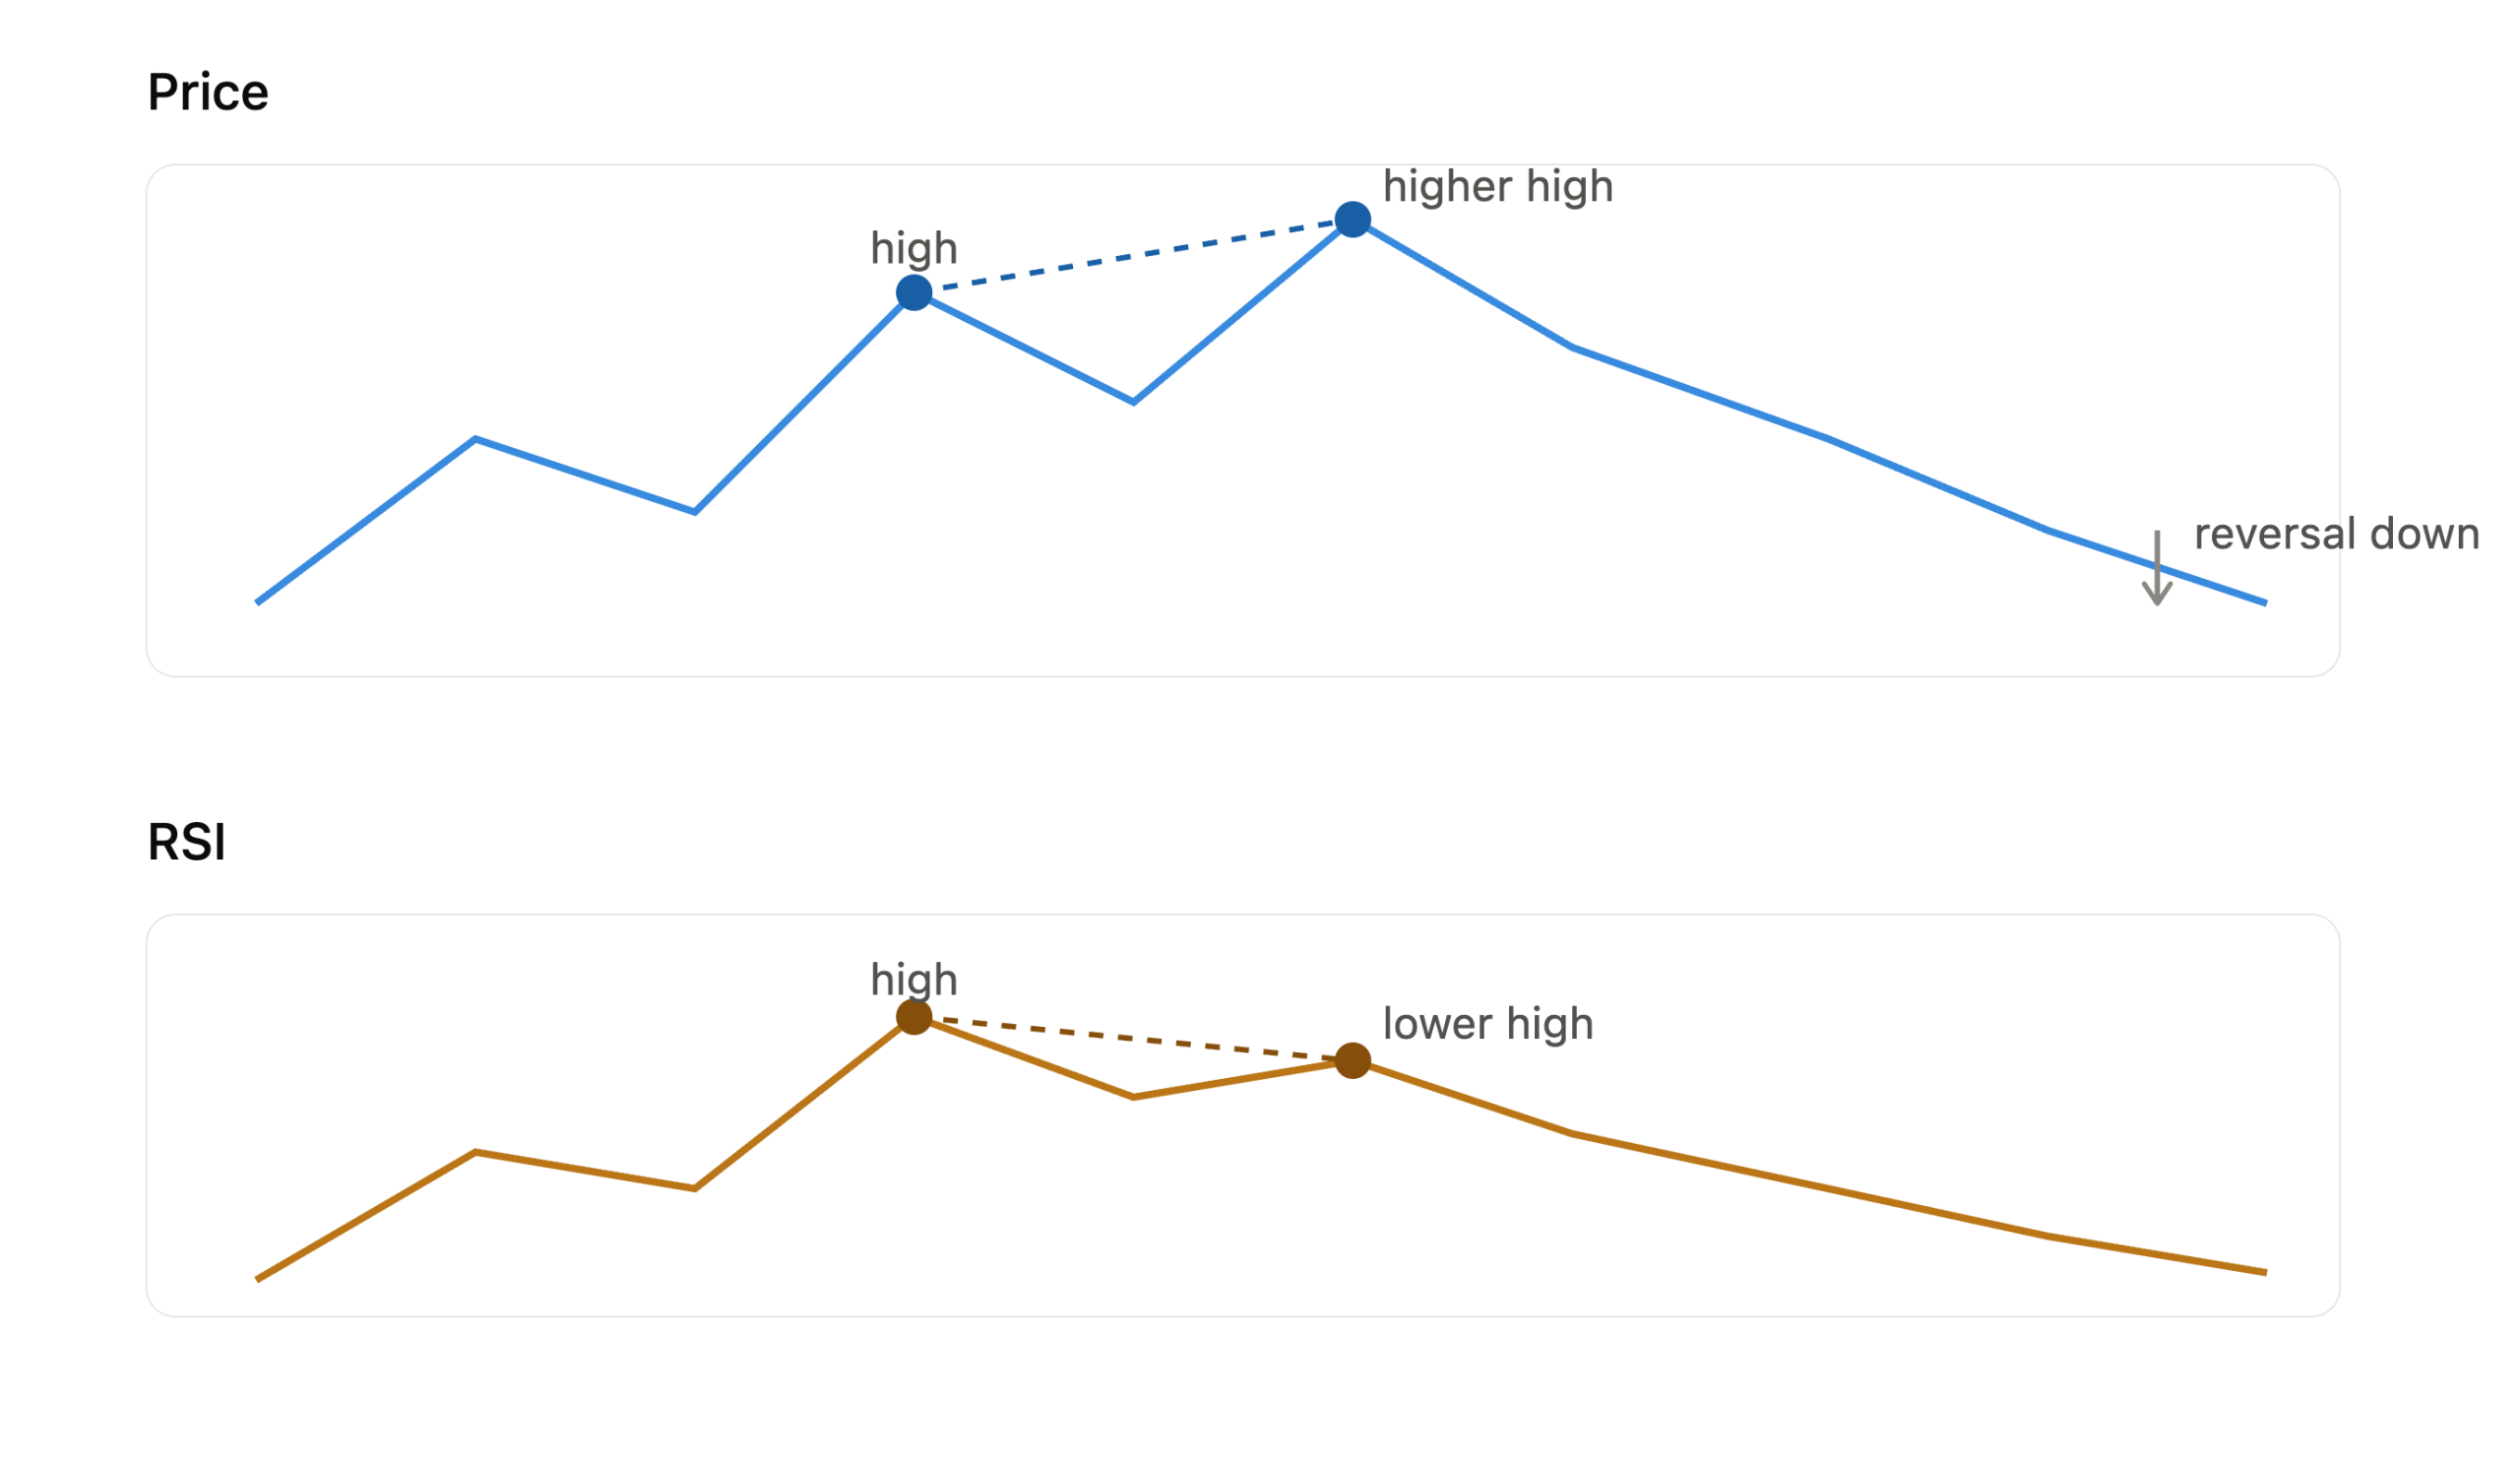
Regular bearish divergence forms at the top of an uptrend. Price makes a higher high, setting a new peak above the previous swing. The indicator makes a lower high at the same point. Buyers are still pushing price to new levels, but the force behind those moves is declining.
When this signal forms at a well-defined resistance level, a supply zone, or a major round number, the probability of a downside reversal increases considerably. This is the divergence type most retail traders recognize first.
Hidden Bullish Divergence
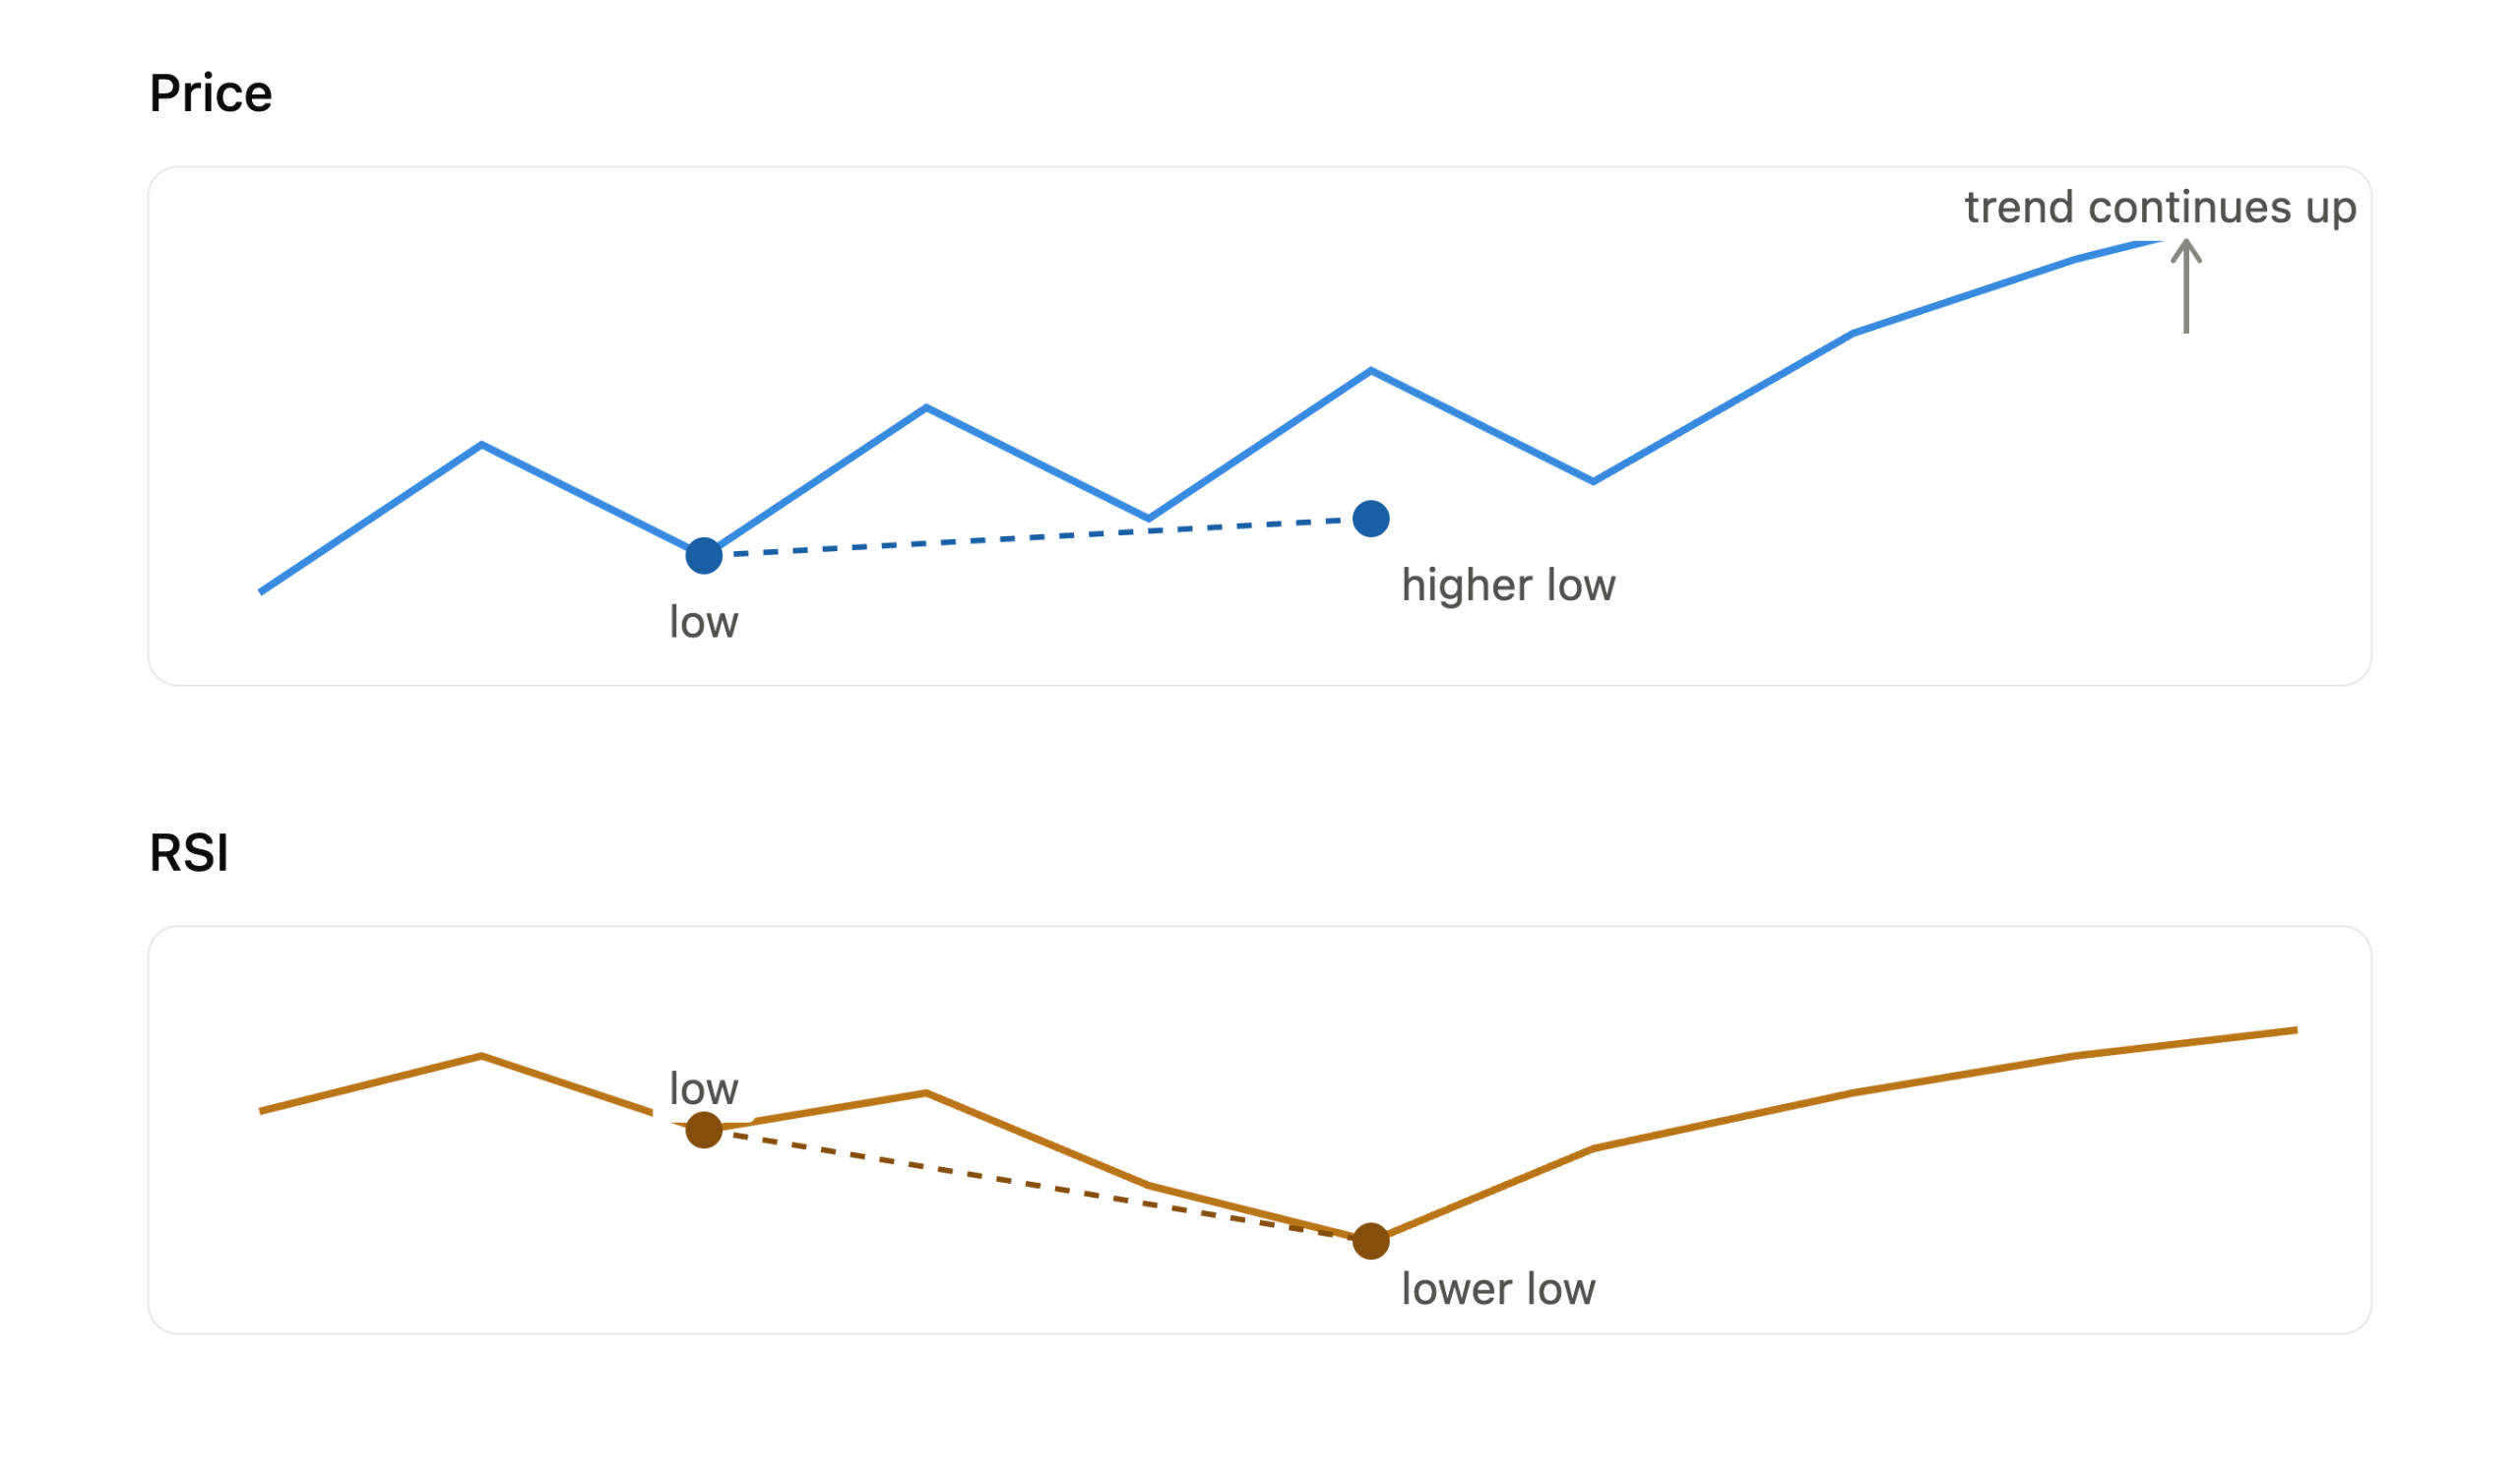
Hidden bullish divergence forms during a pullback inside an uptrend. Price makes a higher low on the retracement. The indicator makes a lower low at the same point. The indicator looks weak, but price is actually holding higher ground. That tells you the uptrend is intact and the pullback is likely to end.
This is a trend continuation signal. Traders use it to enter long during a retracement at a better price, rather than chasing price at a new high.
Hidden Bearish Divergence
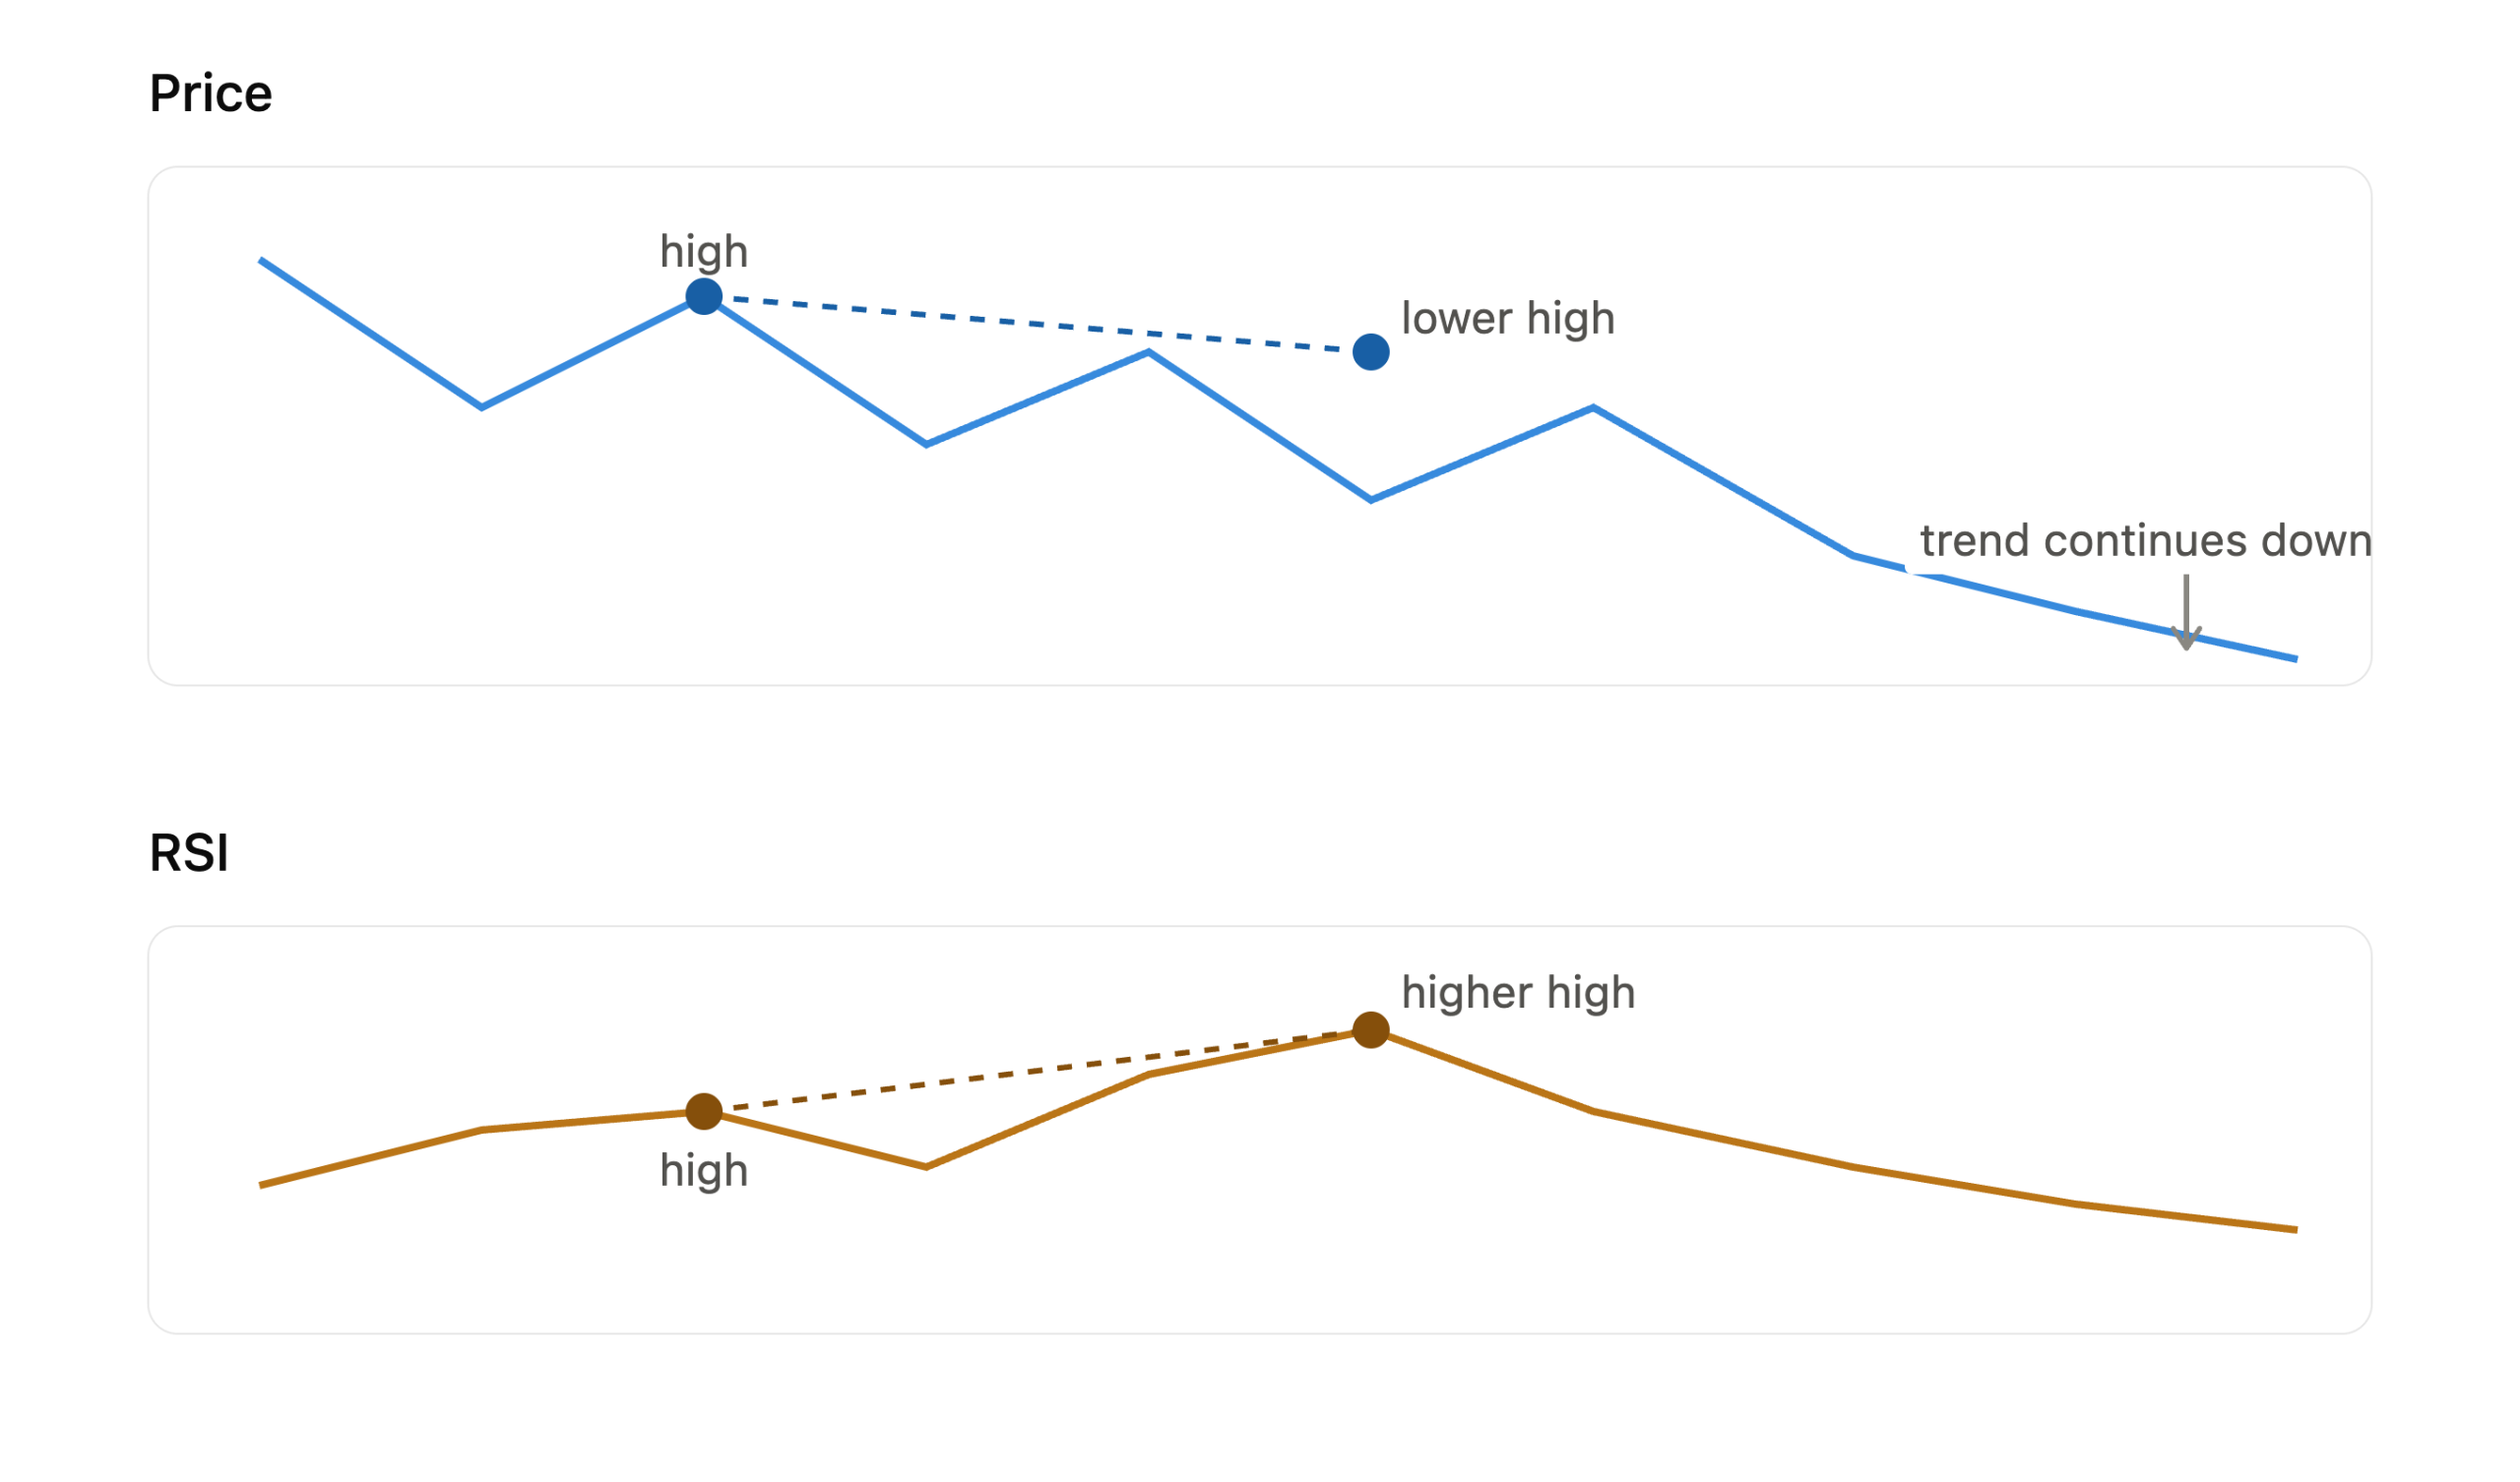
Hidden bearish divergence forms during a bounce inside a downtrend. Price makes a lower high on the bounce. The indicator makes a higher high. Price is weaker than the indicator suggests, which confirms the downtrend remains in control.
Traders use this signal to enter short after a bounce within a broader downtrend. It keeps entries aligned with the dominant trend direction rather than fighting the trend from the wrong side.
RSI vs MACD for Divergence
The two most reliable indicators for divergence work in forex are the RSI and the MACD histogram. Both produce valid signals but behave differently and suit different trading styles.
RSI divergence is faster and cleaner to read. The RSI oscillates between 0 and 100. You compare two consecutive swing highs or lows on price against the corresponding RSI readings. Divergence that forms when the RSI is near 70 on a bearish setup or near 30 on a bullish setup carries more weight, because momentum is already stretched in that direction.
Here is a side-by-side comparison to help you choose the right indicator:
| Feature | RSI (14 Period) | MACD Histogram |
|---|---|---|
| Signal clarity | High | Moderate |
| False signals in choppy markets | Lower | Higher |
| Best timeframe | All timeframes | H4 and daily |
| Speed | Fast | Moderate lag |
| Easiest visual to read | Yes | Requires bar comparison |
| Best use case | Reversal signals | Continuation confirmation |
MACD histogram divergence requires comparing the height of histogram bars at consecutive price swing highs or lows. When bars get shorter as price makes a new extreme, that is divergence. The visual cue takes more practice to read than RSI but holds up well on higher timeframes where the signal has room to develop.
Asia Forex Mentor recommends starting with RSI at 14 periods for divergence work. Once you can identify all four types on RSI without hesitation, add the MACD histogram as a secondary filter. When both indicators show divergence at the same price swing, signal strength increases meaningfully.
Learning how divergence fits into a broader trading strategy is the foundation of building a repeatable method, not just reacting to individual signals. Asia Forex Mentor’s free training walks through the full framework used by students across 50+ countries.
How to Avoid False Divergence Signals
Divergence is one of the most misapplied signals in retail trading. Most false signals come from a small set of repeated mistakes. Knowing what to avoid is as important as knowing what to look for.
Here are the five most common errors and the fix for each:
- Comparing the wrong swing points. Divergence is only valid when you compare the most recent swing to the immediately preceding swing of the same type. Stretching the comparison across three or four swings back produces a meaningless reading that looks like divergence but is not.
- Trading against the trend. Regular divergence works at trend extremes. Hidden divergence works during trend retracements. Using regular divergence to enter mid-trend, or hidden divergence at a trend extreme, puts you on the wrong side of the move.
- Ignoring the higher timeframe. A regular bullish divergence on the one-hour chart inside a clear daily downtrend is a low-probability trade. The daily bias should always be established before acting on a lower timeframe signal.
- Entering without a confirmation candle. Divergence tells you momentum is weakening. It does not tell you exactly when the reversal will begin. Entering the moment you spot divergence, without waiting for a candle that confirms the turn, leads to entries that get stopped before the real move starts.
- Using divergence in a ranging market. RSI and MACD produce frequent divergence signals when price moves sideways because the oscillator constantly crosses back and forth. These signals complete at a low rate. Divergence works best in a trending market, not a choppy one.
Entry, Stop, and Target Rules for Each Type
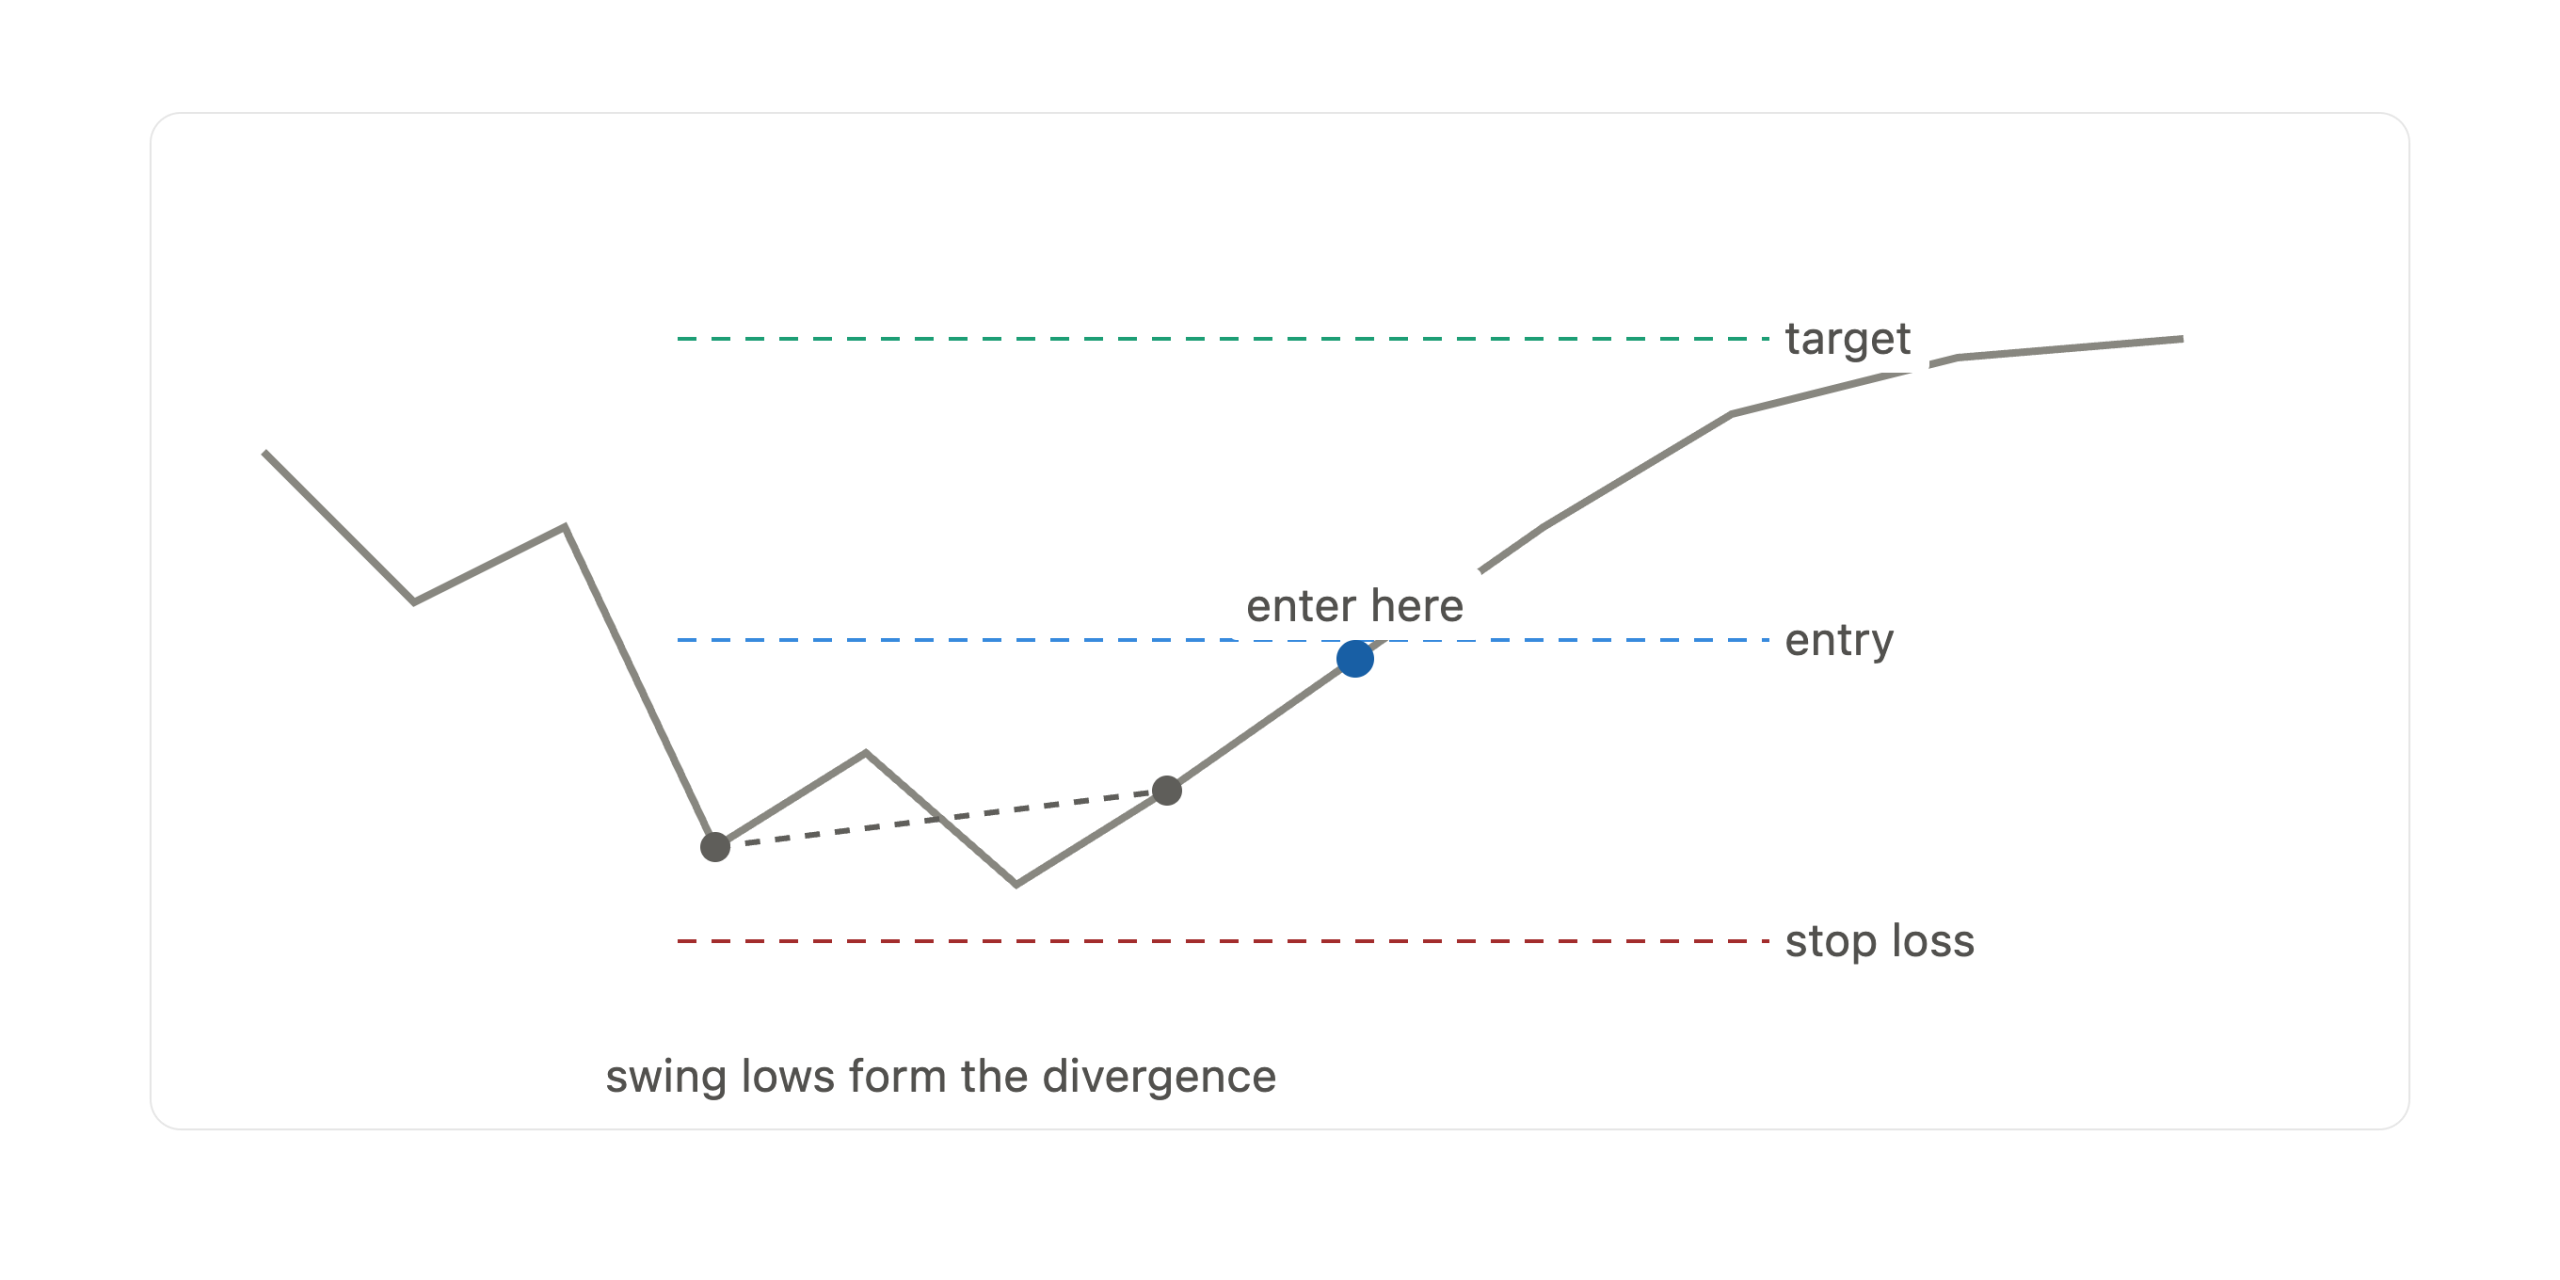
The full methodology below gives you a specific plan for each divergence type so every trade has a defined entry, stop, and target before you put on the position.
Trading Regular Bullish Divergence
This setup fires at the end of a downtrend or at a strong support zone. Follow these steps in order:
- Identify two consecutive swing lows where price made a lower low but the RSI or MACD histogram made a higher low.
- Wait for the second swing low to fully close as a completed candle. Do not enter while the signal candle is still forming.
- Wait for a bullish confirmation candle: a full-bodied green close, a hammer, or a bullish engulfing candle closing above the signal bar’s open.
- Enter long at the open of the candle that follows the confirmation.
| STOP LOSS: Place the stop 10 to 15 pips below the most recent swing low on the four-hour chart. On the daily chart, use 20 to 25 pips to give the trade room to breathe without being clipped by normal price fluctuation. |
| PROFIT TARGET: Measure from your entry up to the previous swing high before the downtrend started. Target 50% to 100% of that distance. Close at least half the position at the nearest resistance level and move the stop to breakeven on the remainder. |
Trading Regular Bearish Divergence
This setup fires at the end of an uptrend or at a strong resistance zone. Follow these steps in order:
- Identify two consecutive swing highs where price made a higher high but the RSI or MACD histogram made a lower high.
- Wait for the second swing high to fully close as a completed candle.
- Wait for a bearish confirmation candle: a full-bodied red close, a shooting star, or a bearish engulfing candle closing below the signal bar’s open.
- Enter short at the open of the candle that follows the confirmation.
| STOP LOSS: Place the stop 10 to 15 pips above the most recent swing high on the four-hour chart. The stop must clear any wick that formed at the high. |
| PROFIT TARGET: Measure from your entry down to the previous swing low before the uptrend started. Target 50% to 100% of that distance. Close partial at the nearest support zone and move the stop to breakeven on the rest. |
Trading Hidden Bullish Divergence
This setup fires during a pullback in an uptrend. It is a trend continuation entry. Follow these steps in order:
- Confirm the chart is in an uptrend with higher highs and higher lows visible on the higher timeframe.
- Identify the pullback where price made a higher low but the RSI or MACD histogram made a lower low.
- Wait for a bullish confirmation candle at the pullback low: a hammer, bullish engulfing, or full-bodied green close.
- Enter long at the open of the candle following confirmation.
| STOP LOSS: Place the stop 10 pips below the pullback low on the four-hour chart. Because you are trading with the trend, the setup has a higher completion rate, which supports a slightly tighter stop. |
| PROFIT TARGET: Target the previous swing high or the next resistance level above. Trail the stop under the swing lows that form as the trend resumes its move higher. |
Trading Hidden Bearish Divergence
This setup fires during a bounce in a downtrend. It is a trend continuation entry from the short side. Follow these steps in order:
- Confirm the chart is in a downtrend with lower highs and lower lows visible on the higher timeframe.
- Identify the bounce where price made a lower high but the RSI or MACD histogram made a higher high.
- Wait for a bearish confirmation candle at the bounce high: a shooting star, bearish engulfing, or full-bodied red close.
- Enter short at the open of the candle following confirmation.
| STOP LOSS: Place the stop 10 to 15 pips above the bounce high on the four-hour chart. The stop clears the wick of the rejection candle. |
| PROFIT TARGET: Target the previous swing low or the next support zone below. Trail the stop using the swing highs that form as the downtrend continues. |
Risk Management When Signals Fail
Divergence signals fail. Even the cleanest setup on the daily chart can resolve against you when a major economic release, a central bank statement, or a liquidity sweep overrides the technical signal. The way you manage risk determines whether a failed signal is a small controlled loss or an account-damaging event.
Here are five risk rules every divergence trader should apply:
- Risk 1% to 2% of account equity per trade. Calculate position size from the dollar risk and the stop distance, not from a fixed lot. A 30-pip stop at 1% risk on a $10,000 account is a different lot size than a 15-pip stop. Recalculate for every trade.
- Do not move your stop closer to price after entry. Divergence signals frequently produce one more probe toward the original extreme before the real move begins. Cutting the stop short ends the trade before the signal has time to play out.
- Use a minimum 1:1.5 risk-to-reward ratio. Divergence signals do not complete on every occurrence. At a 1:2 ratio, a 40% win rate is roughly breakeven before costs, so anything above that starts to grow the account over a series of trades. Anything below 1:1.5 makes it mathematically difficult to stay profitable.
- Take partial profit at the first target. Close 50% of the position when price reaches a key confluence level or the midpoint of your target range. Move the stop to breakeven on the remaining position. This approach locks in profit while giving the trade room to reach the full target.
- Record every signal in a trade log. Note the divergence type, indicator used, timeframe, entry, stop, and outcome. After 20 to 30 trades, patterns in the losing trades will show whether you are entering in the wrong market condition, on the wrong timeframe, or with the wrong stop placement.
Before trading any divergence setup, reviewing stop loss mistakes that cost traders money will help you avoid the errors that wipe out multiple winning signals in a single trade.
Why Most Traders Misread Divergence
The gap between observing divergence and profiting from it consistently comes down to three steps most traders skip.
First, they do not check the higher timeframe. A regular bearish divergence on the one-hour chart inside a strong daily uptrend is a low-probability trade. Applying top-down analysis before looking at entries on the four-hour chart removes most of the counter-trend noise and keeps direction aligned with the dominant move.
Second, they treat divergence as a standalone signal. Divergence carries the most weight when it forms at a point of confluence: a major support or resistance level, a Fibonacci retracement level, or a previous market structure extreme. A divergence signal forming in empty space, with no price-based reason for a reversal, has a much lower completion rate than one forming at a well-defined level where price has reacted before.
Third, they skip the confirmation candle. The confirmation step is not optional. It filters out divergence signals that are still resolving against you from those that are about to turn in your favor. Waiting for a candle to close costs a few pips of entry price. It saves you from entering against a trend that has not finished moving.
Also Read: 7 Best Trading Strategies That Actually Work in 2026
Conclusion
Divergence trading gives forex traders an objective way to identify when momentum and price are no longer telling the same story. The four types, regular bullish, regular bearish, hidden bullish, and hidden bearish, each have a specific look on the chart and a defined set of entry, stop, and target rules that make the method repeatable.
The signal gains the most power when it forms at a confluence level, confirmed by a candle close, and evaluated through the lens of the higher timeframe trend. Without those filters, divergence becomes a reason to overtrade. With them, it is one of the cleaner signals available in the forex market.
Frequently Asked Questions
What is divergence trading in forex?
Divergence trading is a method of identifying potential price reversals or continuations by comparing price swing highs or lows to the corresponding readings on a momentum indicator such as RSI or MACD. When price and the indicator move in opposite directions at a swing point, it signals that the momentum behind the current price move is weakening and a change in direction may follow.
What is the difference between regular and hidden divergence?
Regular divergence signals a potential reversal of the current trend. It forms when price makes a new extreme high or low but the indicator fails to match it. Hidden divergence signals a potential continuation of the current trend. It forms when the indicator makes a more extreme reading while price holds higher ground on a pullback or lower ground on a bounce during a retracement.
Which indicator is best for divergence trading?
RSI with a 14-period setting is the most straightforward indicator for divergence because it oscillates cleanly between 0 and 100 and produces clear visual comparisons between consecutive swing points. The MACD histogram is a strong secondary option, particularly on the daily and four-hour timeframes, where it confirms momentum shifts with less noise than on lower timeframes.
How do you confirm a divergence signal before entering?
Wait for the second swing point to fully close as a completed candle, then wait for a confirmation candle. For a bullish setup, look for a full-bodied green candle, hammer, or bullish engulfing candle closing above the signal bar’s open. For a bearish setup, look for a full-bodied red candle, shooting star, or bearish engulfing candle. Enter at the open of the candle that follows the confirmation close.
Can divergence be traded on any currency pair?
Yes. Divergence works on any currency pair, but major pairs such as EUR/USD, GBP/USD, and USD/JPY produce the most reliable signals because they have consistent trending behavior, tight spreads, and high liquidity. Exotic pairs with lower liquidity can generate erratic oscillator readings that increase the frequency of false signals, particularly on lower timeframes.