
Learn To Trade Forex • Best Forex Trading Course • AsiaForexMentor

Double Top Pattern Forex Trading Guide In 2026

Written by

Ezekiel Chew

Updated on

August 3, 2026

i
Its a default text

Double Top Pattern Forex Trading Guide In 2026

Written by:

Last updated on:

August 3, 2026

The double top pattern has taken more money from traders than it has returned to them. The pattern works fine. The problem is that most traders pull the trigger before the neckline ever breaks.

ABOUT THIS GUIDE

This guide explains what the double top pattern is, how to identify it on any currency pair including the trap of unequal peaks, and the exact trade plan used at Asia Forex Mentor, from the neckline break to stop placement to profit target calculation.


QUICK ANSWER

The double top pattern is a bearish reversal signal in which price tests a resistance level twice and fails both times. Confirmation comes only when price closes below the neckline, the low point between the two peaks. The profit target equals the height of the pattern projected downward from the neckline break.

What the Double Top Pattern Is

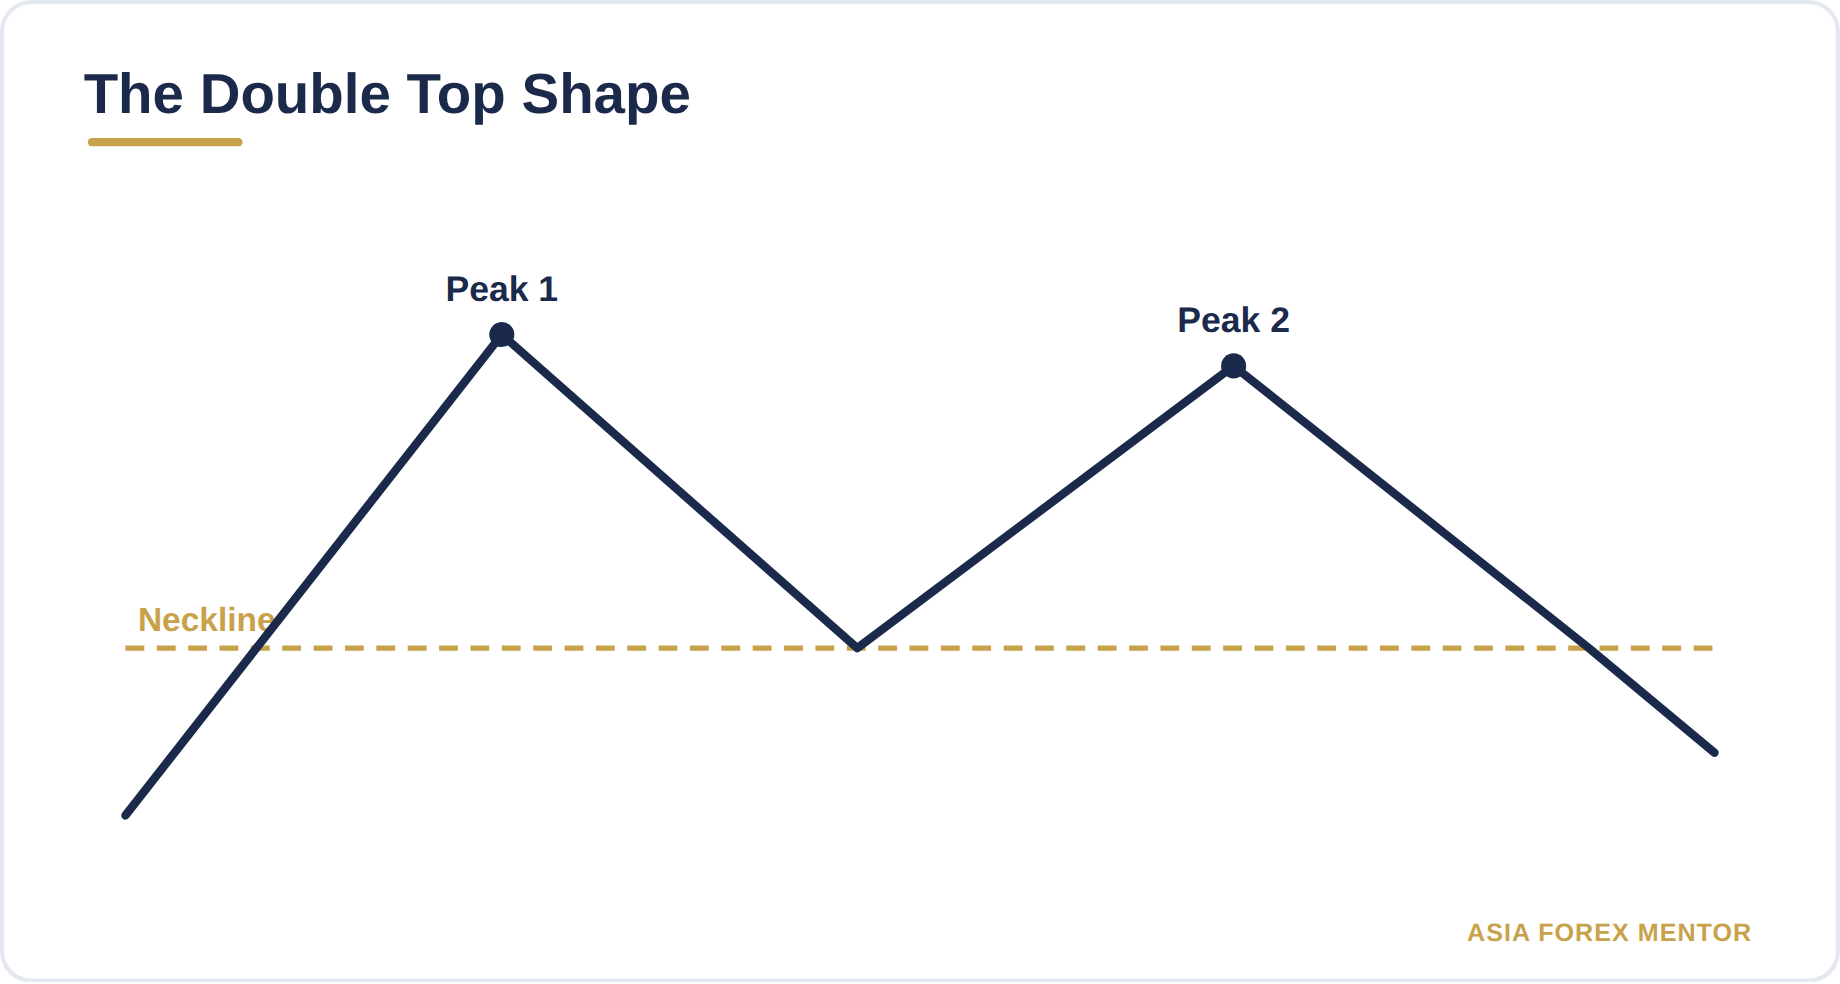
The double top pattern is a bearish reversal formation that appears on a price chart after an extended uptrend. Price rises to a resistance level, pulls back, rallies toward that same level again, and fails a second time. The pattern signals that buyers cannot push price any higher and that sellers are taking control.

On a chart it looks like a capital M, though real ones are never that tidy. The two peaks represent two failed attempts at resistance. The low between them marks the neckline, which is the confirmation level traders watch. No neckline break means no confirmed pattern.

This pattern appears on every time frame and every currency pair. Asia Forex Mentor focuses on the H4 and daily charts because those time frames produce cleaner, more tradeable signals than the noise found in shorter time frames.

The Market Psychology Behind It

Every double top is really a story about buyers running out of conviction. Understanding those decisions separates traders who read the setup correctly from traders who guess.

The first peak forms when buyers push price into a resistance zone. Sellers at that level are strong enough to stall the move and send price back down. Most traders assume this pullback is temporary. They buy the dip and push price back toward the highs.

When price reaches resistance again and sellers defend it a second time, the second peak forms. Buyers who entered during the pullback are now stuck in losing positions near the highs. As price turns lower from the second peak and breaks below the neckline, those trapped buyers exit. That selling adds pressure to the downside move.

That trapped-buyer fuel is the whole reason this pattern is worth trading. Nothing about the reversal is random. It is demand failing at a level the market has already tested and thrown back twice.

How to Identify a Double Top Pattern Correctly
A valid double top pattern has four elements. Confirming all four before entering keeps traders out of false setups.

Here are the four elements to verify before trading a double top:

1. Prior uptrend. The pattern must form after a clear move higher. A double top without a prior uptrend is not a reversal pattern. It is a range.

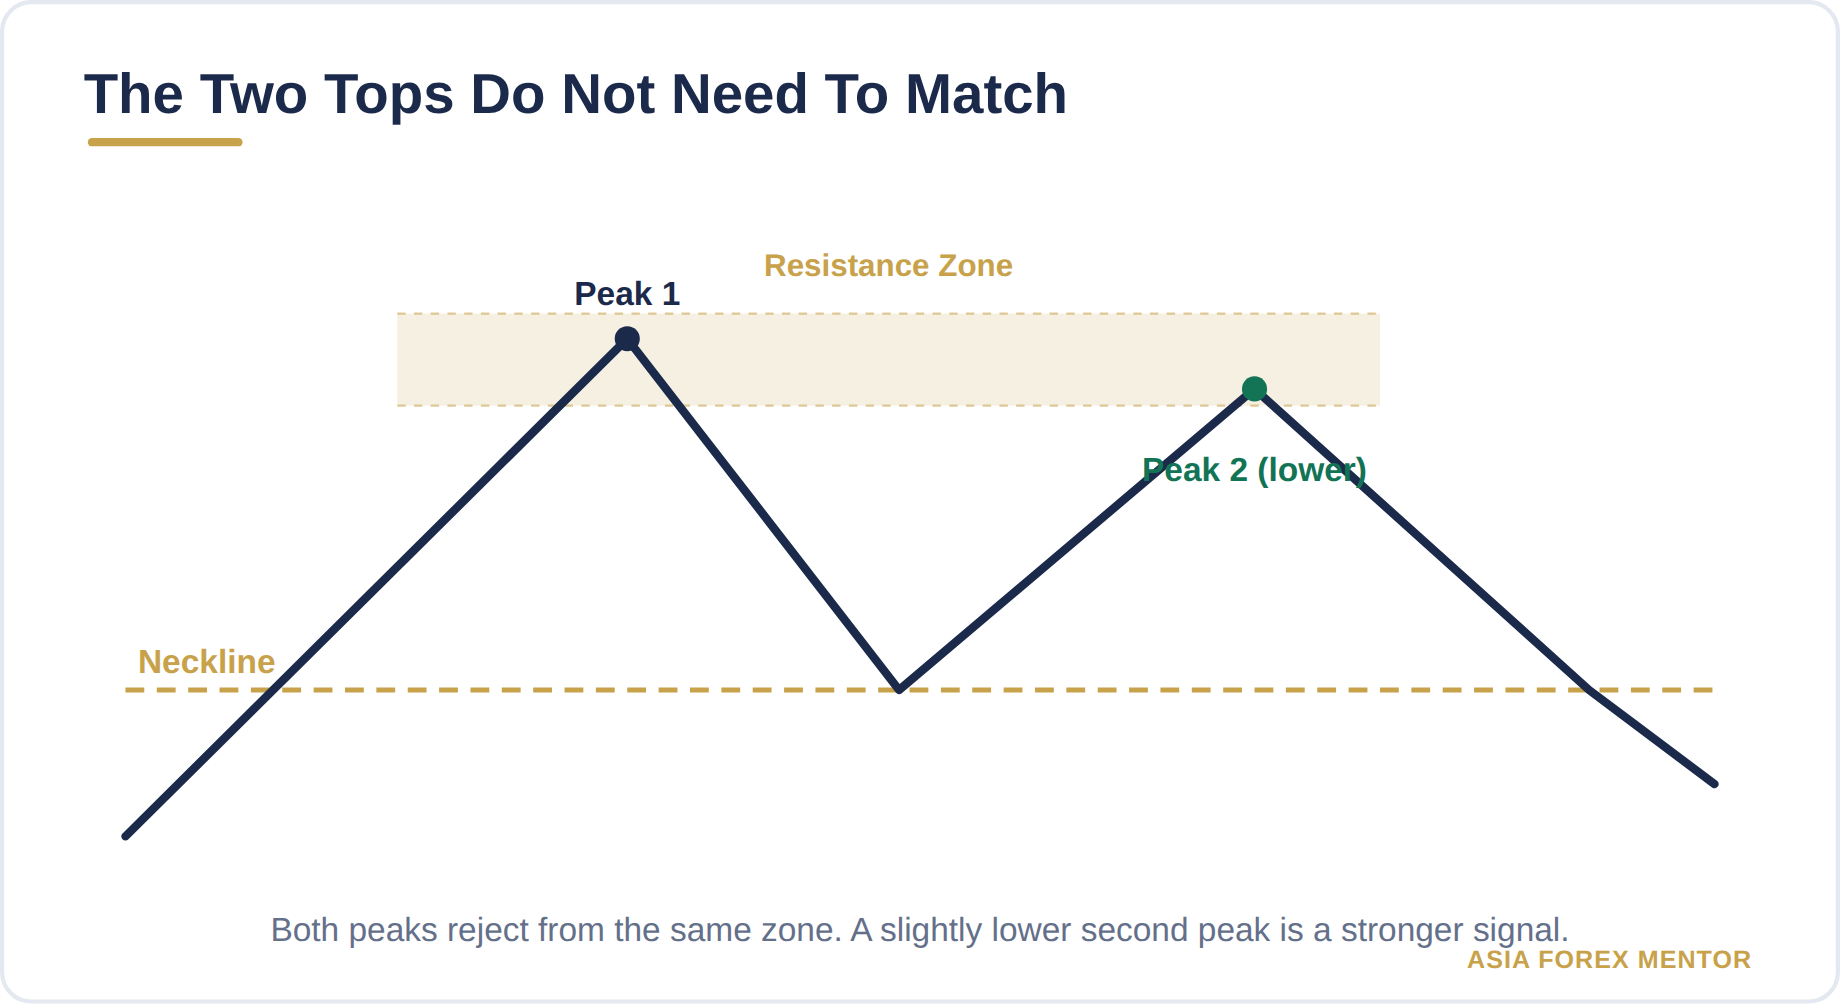
2. Two distinct peaks near the same resistance level. The peaks do not need to be at the exact same price. A difference of 20 to 30 pips between them is normal and valid.

3. A neckline formed by the low between the two peaks. This level acts as the boundary between a pattern in progress and a confirmed reversal.

4. A closing break below the neckline. A candle close below the neckline on the current time frame confirms the pattern. A wick that dips below does not count.

he most expensive mistake here is demanding that both peaks sit at exactly the same price. They never do. One top is almost always a few pips off the other, and that is just what a real chart looks like. The textbook diagrams lie to you on this one, and traders who throw out setups over uneven peaks end up missing some of the cleanest trades on the board.

When the second peak is slightly lower than the first, the bearish signal is actually stronger. It means buyers tried again and failed to reach the previous high. That weakening momentum increases the probability of a sustained reversal.

Asia Forex Mentor teaches traders to draw a resistance zone rather than a single resistance line when assessing double tops. If both peaks fall within that zone, the pattern qualifies. The neckline is the confirmation trigger regardless of peak alignment.

For a broader look at how reversal setups appear on live forex charts, the reversal trading strategy guide walks through how these formations develop in real time.

The Neckline Break Explained
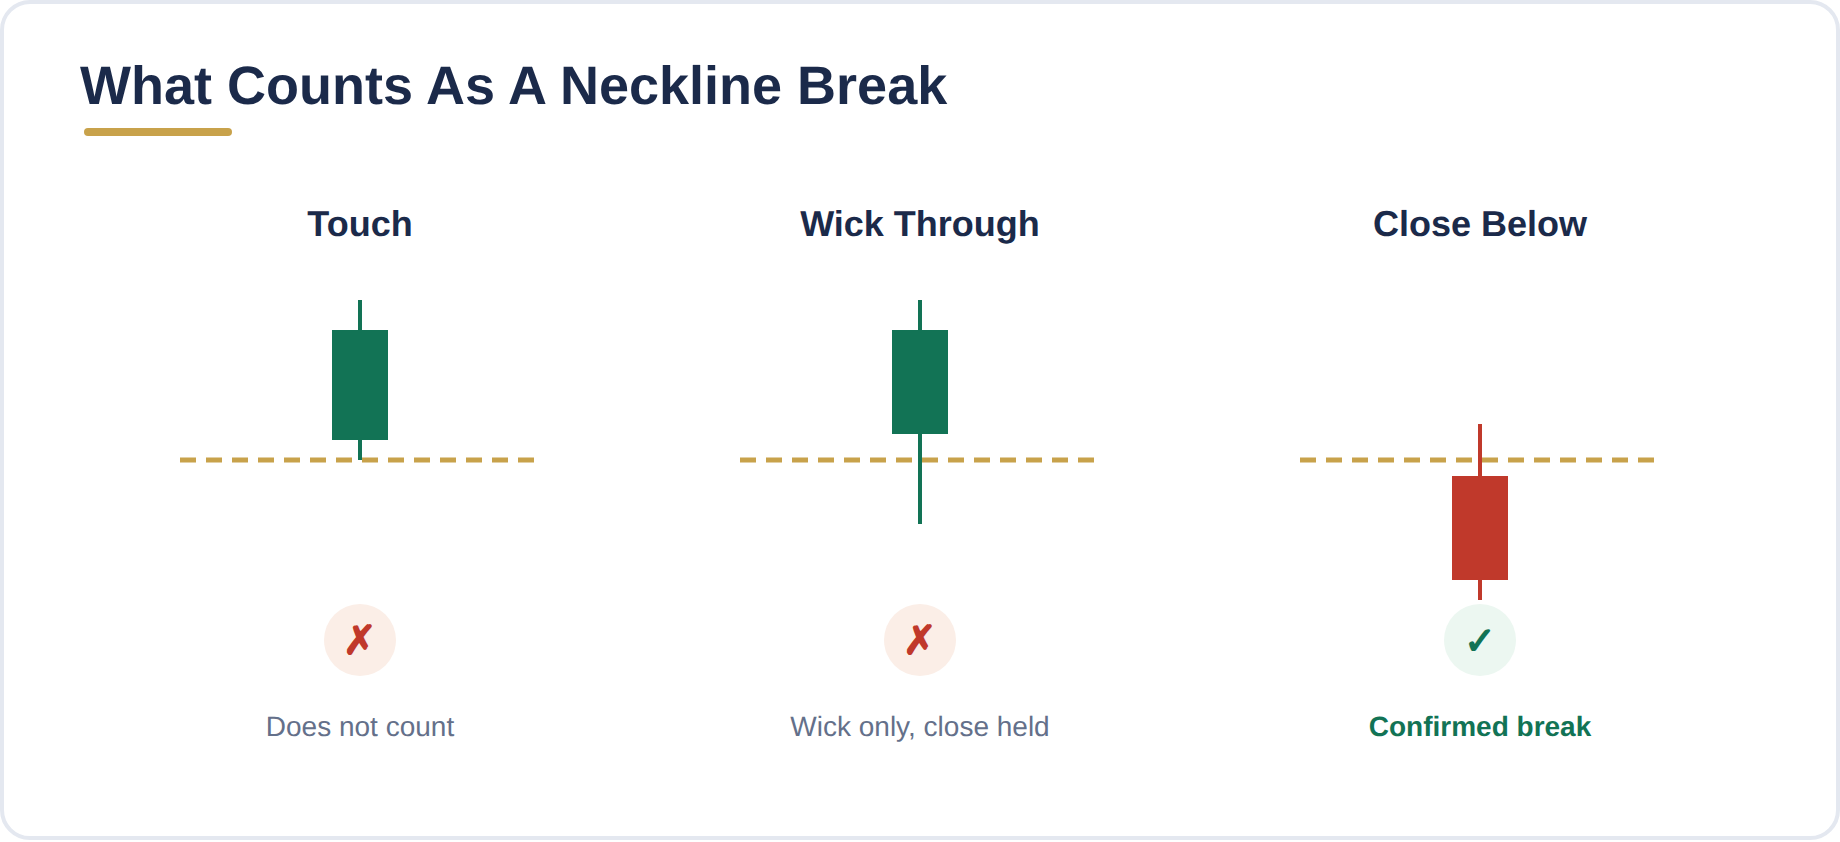
The neckline is the most important level in the double top pattern. Draw it horizontally at the low point between the two peaks. Nothing about the pattern is confirmed until price closes below this level.

Plenty of traders see price tag the neckline and assume they are in. A touch does not count. Neither does a wick poking through it. What actually confirms the pattern is a full candle closing below the line on the time frame you are trading, and nothing short of that.

The neckline also determines the profit target. The pip distance from the neckline to the peaks sets how far price is expected to fall after the break. Traders who skip this measurement enter without a defined exit and end up cutting winners short or holding too long.

A neckline that tilts a little, up or down, still works. Draw it off the lowest point of the pullback between the two peaks and use candle closes against that line as your trigger. The slight angle changes nothing about the rule.

Traders who want to build the discipline to wait for neckline confirmation will find the 10 trading discipline habits guide directly relevant to this point.

How to Trade the Double Top Pattern
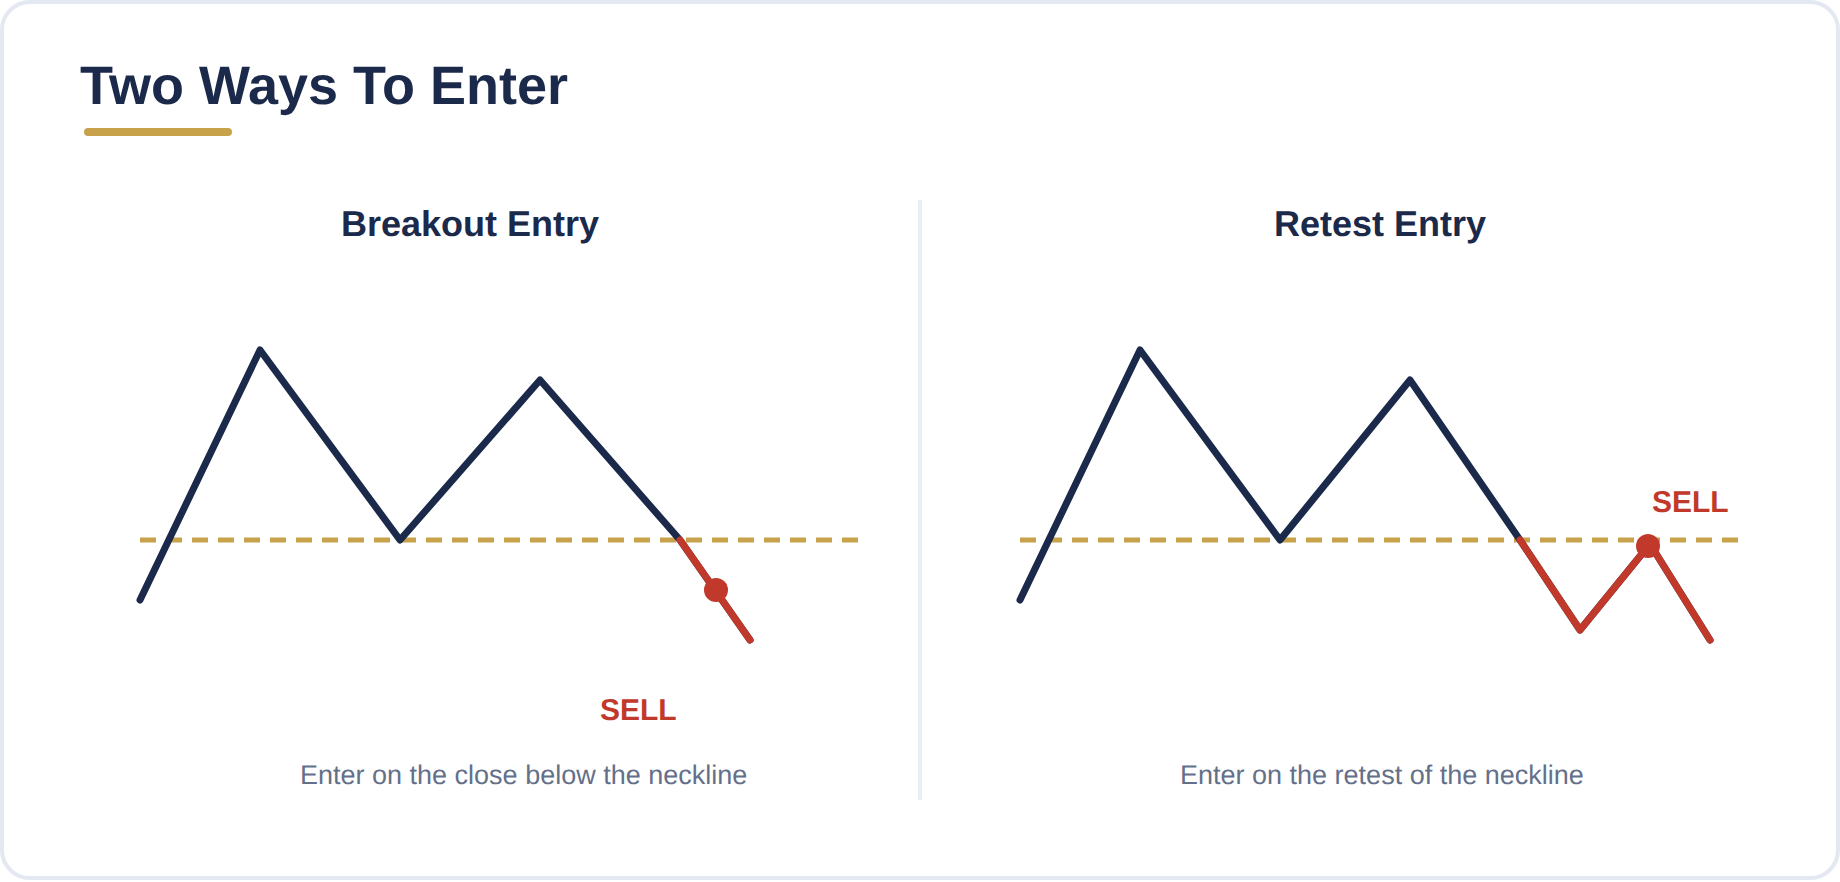
There are two entries for the double top pattern: the breakout entry and the retest entry. Both are valid. The right choice depends on how the pair is moving and the trader's risk tolerance.

The Breakout Entry

The breakout entry triggers when price closes below the neckline. Traders place a sell order at the open of the next candle after that confirmed close. This entry captures the move early but accepts the risk that price may pull back toward the neckline before continuing lower.

Breakout entries suit faster-moving pairs and time frames where retests are infrequent. They work best when the break closes well below the neckline with strong momentum. A weak or hesitant close just below the neckline is better approached with the retest entry.

The Retest Entry

After price breaks the neckline, it often returns to test that level from below. The neckline, which was support between the two peaks, now acts as resistance. The retest entry waits for price to return to the neckline, shows rejection there, and then enters short.

The retest entry offers a tighter stop and a better risk-to-reward ratio. The tradeoff is that not every double top produces a clean retest. On some pairs, price moves straight down from the breakout. Traders who always wait for the retest will miss those moves.

Stop Placement

For both entries, the stop loss belongs above the higher of the two peaks. This level marks the point at which the pattern fails. If price trades above that level, the bearish thesis is invalid and the position should be closed.

Placing the stop too close to the neckline is one of the most common stop loss mistakes in forex trading. Price often revisits the neckline after the break. A tight stop gets taken out before the real move begins.

Profit Target

Measure the pip distance from the neckline to the highest of the two peaks. Project that same distance downward from the neckline break point. That level becomes the initial profit target.

Here is a worked example with specific levels:

Peak 1: 1.3200
Peak 2: 1.3180
Neckline: 1.3000
Pattern height: 200 pips (1.3200 minus 1.3000)
Target: 1.2800 (200 pips below the neckline break)

The entry is at the neckline break, at 1.3000, and the stop sits above the higher peak. With a stop 30 pips above the higher peak, at 1.3230, the risk is about 230 pips against the 200-pip target, which is close to 1:1. Because a double top's measured target and its stop distance are both roughly the height of the pattern, the base setup tends to sit near 1:1. Traders build on that by taking partial profit at the measured target and trailing the remainder when the reversal keeps running.


Asia Forex Mentor has trained more than 100,000 traders across 50+ countries to measure and execute setups exactly like this one. Investopedia named it the “Most Comprehensive Course” and Benzinga named it the “Best Forex Trading Course.”

Double Top vs Double Bottom

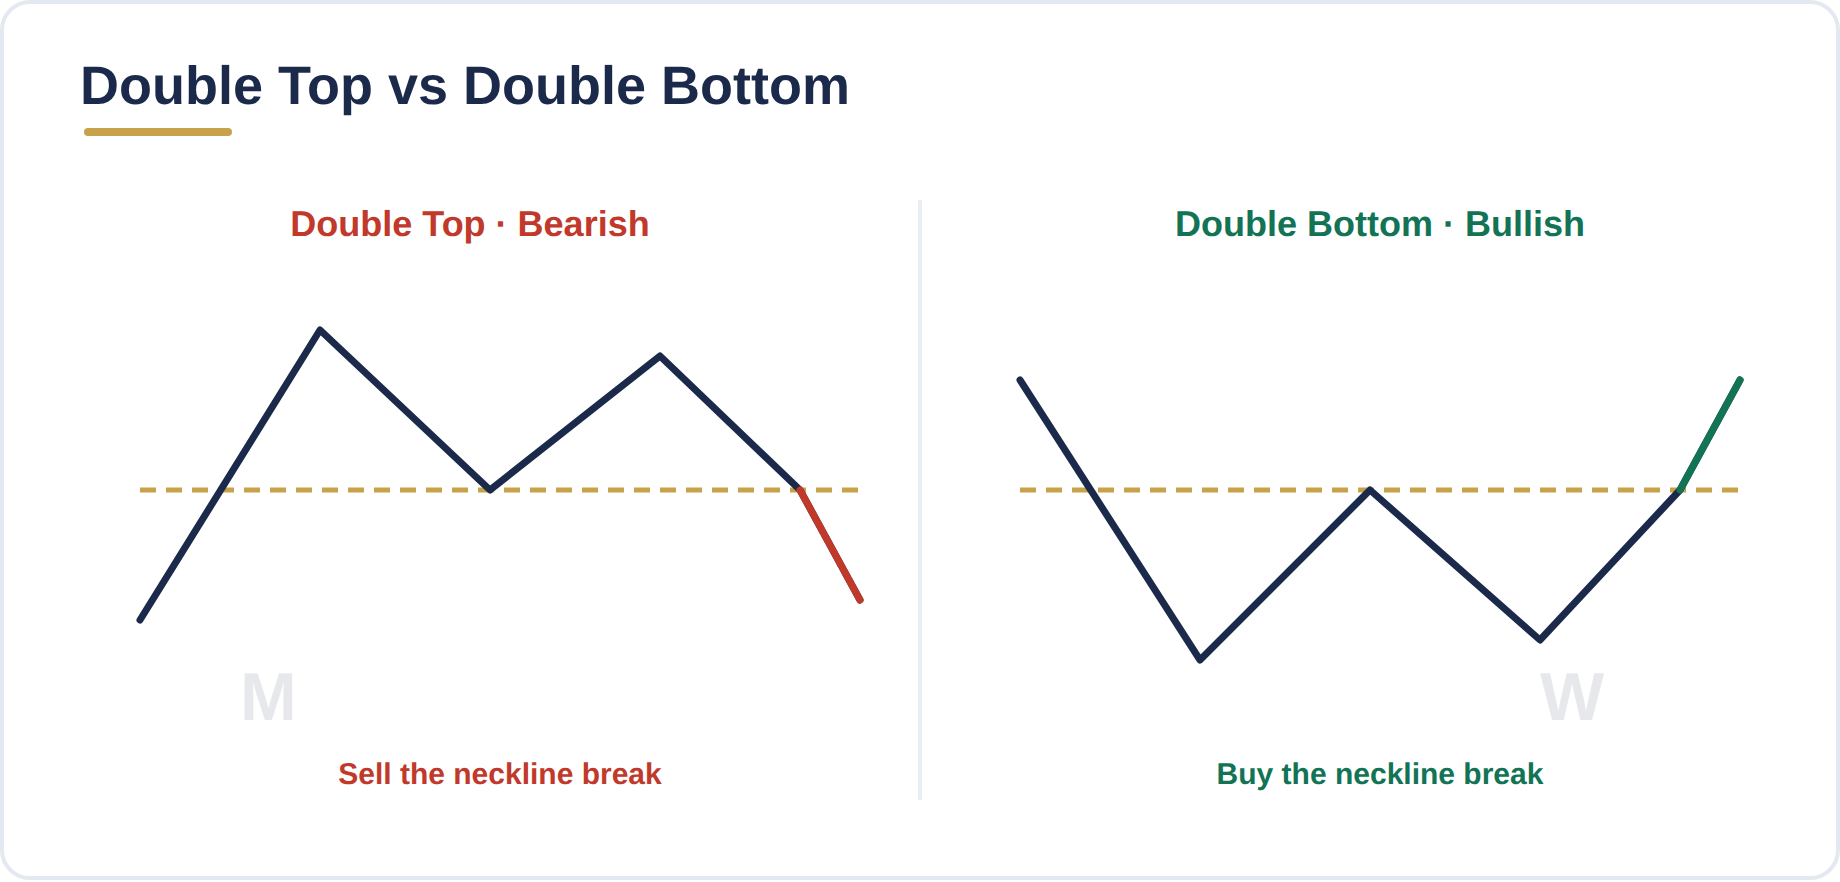
The double bottom is the mirror image of the double top. Where the double top signals a bearish reversal after an uptrend, the double bottom signals a bullish reversal after a downtrend. Both patterns use the same four elements in opposite directions.

The table below compares the two patterns side by side:

Feature Double Top Double Bottom
Trend Before Pattern Uptrend Downtrend
Pattern Shape Letter M Letter W
Levels Tested Resistance fails twice Support holds twice
Neckline Position Low between the two peaks High between the two troughs
Confirmation Signal Close below neckline Close above neckline
Trade Direction Short (sell) Long (buy)
Target Direction Downward from neckline break Upward from neckline break
Stop Placement Above the higher peak Below the lower trough

The execution is the same for both patterns. Identify the structure and wait for the neckline break. Choose a breakout or retest entry. Place the stop beyond the pattern extremes and measure the target from the pattern height.

The double bottom appears frequently after sharp sell-offs in trending markets. Traders who know both patterns can operate on both sides of the market with the same consistent framework.

Common Mistakes Traders Make

The double top pattern fails traders not because the pattern is unreliable, but because specific execution errors repeat themselves across thousands of accounts.

Here are the four mistakes that cost traders the most on double top setups:

1. Entering before the neckline breaks. This is the one that wipes accounts. Until price closes below the neckline, there is no confirmed pattern, yet traders pile in at the second peak or the moment price grazes the neckline. Plenty of setups that look like perfect double tops just keep climbing and never break at all.

2. Rejecting uneven peaks. Demand two identical tops and you will throw out most of the good trades. What matters is that both peaks reject from the same resistance zone, not that they print the same price to the pip.

3. Placing the stop below the neckline. Park it just under the neckline and a routine retest takes you out before the move even starts. The stop belongs above the higher peak, where the pattern actually fails, so the trade has room to breathe.

4. Skipping the target calculation. No target means you are guessing at the exit, and guessing is how good trades turn into breakeven ones. Measure the pattern height before you enter, drop a limit at that level, and then get out of your own way.

Building the patience to avoid these mistakes requires a consistent mental process. The trading mindset guide from Asia Forex Mentor covers how to stay disciplined through the wait for confirmation.

Also Read: 14 Forex Candle Patterns Every Serious Trader Must Know

Conclusion

The double top pattern is one of the most reliable bearish reversal signals in forex. Execution is the whole game. You wait for the neckline to break, pick your entry, and set the stop above the higher peak, all before you calculate where the trade is going. Get that sequence right and the pattern does the rest.

The uneven peaks trap catches traders who learned the pattern from simplified diagrams. Real charts are messier than textbook examples. Two tops at slightly different levels, both rejected at the same resistance zone, qualify as a valid pattern. Dismissing the setup because the peaks are not identical means missing the trade.

The free Asia Forex Mentor training covers this full trading system, taught to more than 100,000 traders across 50+ countries. Access the free 3-step training here.

Frequently Asked Questions

What Is the Double Top Pattern in Forex?

It is a bearish reversal that shows up after an uptrend. Price runs at a resistance level, fails, comes back and fails again, then rolls over. You only have a confirmed pattern once price closes below the neckline, the low sitting between those two peaks. In plain terms, buyers took two swings, missed both, and sellers took the wheel.

Do the Two Tops Need to Be at Exactly the Same Price?

No, and expecting them to is one of the most common ways traders talk themselves out of good setups. The two tops just need to reject from the same resistance zone. If anything, a second peak that comes in a little lower is the stronger signal, because it means buyers could not even get back to the previous high.

What Is the Neckline in a Double Top Pattern?

Draw the neckline across the lowest point between the two peaks. That line is the border between a pattern that might happen and one that actually has. Price has to close below it to confirm. A wick poking through or a quick touch does nothing for you.

How Do I Calculate the Profit Target for a Double Top?

Measure from the neckline up to the higher of the two peaks. That gap is your pattern height. Take the same number of pips and project it straight down from where price broke the neckline. Peaks sitting 200 pips above the line? Your target is 200 pips below the break.

What Is the Difference Between the Breakout Entry and the Retest Entry?

With the breakout entry, you sell the open of the candle right after price closes below the neckline. With the retest, you wait for price to come back up to the neckline, get rejected, and then short it. The retest gives you a tighter stop and better reward for the risk. The catch is that some pairs never look back, so you miss those moves entirely.

Where Should the Stop Loss Go on a Double Top Trade?

Put the stop above the higher of the two peaks. That keeps you in through the normal chop that follows a breakout, and it only takes you out if price climbs back above the resistance that defined the whole pattern. At that point the bearish case is dead anyway.

Is the Double Top Pattern Reliable in Forex?

It is, as long as all four elements are there and you actually wait for the neckline to break. It holds up across majors, minors, and exotics. Where it falls apart is trader behavior, jumping in early, ignoring the neckline, or tossing out valid setups over uneven peaks. Stick to the H4 and daily charts and the signals get a lot cleaner.


About Ezekiel Chew​

Ezekiel Chew, founder and head of training at Asia Forex Mentor, is a renowned forex expert, frequently invited to speak at major industry events. Known for his deep market insights, Ezekiel is one of the top traders committed to supporting the trading community. Making six figures per trade, he also trains traders working in banks, fund management, and prop trading firms.

Market Structure Trading Strategy That Actually Works

Market structure trading stops working the moment traders ignore location and timing. Clean analysis on the wrong side of a level produces the same outcome every time. The move starts without you, and the chart tells you exactly why, after the fact. ABOUT THIS GUIDE This guide covers three approaches

Read More

How to Stop FOMO Trading Before It Wrecks Your Account

Learning how to stop FOMO trading matters more than any strategy, because FOMO wrecks more trading accounts than bad entries, weak setups, or poor timing ever will. Most traders try to beat FOMO with willpower. They promise to stay calm. They tell themselves they will wait for the next clean

Read More

Elliott Wave Trading Explained the Right Way

Hey, what’s up guys? It’s Ezekiel Chew here. So if you ever wanted to actually understand where the market is in a cycle right now, not just about following candles, not just about reacting to breakouts, but to know whether or not are you in an impulse or are you

Read More

How to Recover From a Trading Losing Streak

Most traders get how to recover from a trading losing streak completely backward. They try to win it all back at once, and that one move turns a rough patch into a blown account. Real recovery works the other way around. The trader who comes back trades smaller, not bigger,

Read More

Turtle Soup Trading Strategy: The 3 Step Framework

Hey, what’s up guys? It’s Ezekiel Chew here. Let me hit you with this. If you are trading breakouts, you are probably the liquidity. Most traders think that they are catching momentum in the market when they see a breakout. When they see price push above the high, they buy.

Read More

5 Stop Loss Mistakes That Are Costing You Money

Stop loss in trading is the one tool every trader has access to, and almost every trader uses incorrectly. The concept sounds simple. Place a stop loss to limit potential losses if the trade goes wrong. But the execution is where most traders destroy their accounts. They place stops at

Read More

AFM Trading Summit Live

Date: Coming Soon

Join us at the AFM Trading Summit Live and learn from top industry experts through live trading sessions, market insights, and actionable strategies.

Double Top Pattern Forex Trading Guide In 2026

4.0
Overall Trust Index

Written by:

Updated:

August 3, 2026
The double top pattern has taken more money from traders than it has returned to them. The pattern works fine. The problem is that most traders pull the trigger before the neckline ever breaks.

ABOUT THIS GUIDE

This guide explains what the double top pattern is, how to identify it on any currency pair including the trap of unequal peaks, and the exact trade plan used at Asia Forex Mentor, from the neckline break to stop placement to profit target calculation.
 

QUICK ANSWER

The double top pattern is a bearish reversal signal in which price tests a resistance level twice and fails both times. Confirmation comes only when price closes below the neckline, the low point between the two peaks. The profit target equals the height of the pattern projected downward from the neckline break.

What the Double Top Pattern Is

The double top pattern is a bearish reversal formation that appears on a price chart after an extended uptrend. Price rises to a resistance level, pulls back, rallies toward that same level again, and fails a second time. The pattern signals that buyers cannot push price any higher and that sellers are taking control. On a chart it looks like a capital M, though real ones are never that tidy. The two peaks represent two failed attempts at resistance. The low between them marks the neckline, which is the confirmation level traders watch. No neckline break means no confirmed pattern. This pattern appears on every time frame and every currency pair. Asia Forex Mentor focuses on the H4 and daily charts because those time frames produce cleaner, more tradeable signals than the noise found in shorter time frames.

The Market Psychology Behind It

Every double top is really a story about buyers running out of conviction. Understanding those decisions separates traders who read the setup correctly from traders who guess. The first peak forms when buyers push price into a resistance zone. Sellers at that level are strong enough to stall the move and send price back down. Most traders assume this pullback is temporary. They buy the dip and push price back toward the highs. When price reaches resistance again and sellers defend it a second time, the second peak forms. Buyers who entered during the pullback are now stuck in losing positions near the highs. As price turns lower from the second peak and breaks below the neckline, those trapped buyers exit. That selling adds pressure to the downside move. That trapped-buyer fuel is the whole reason this pattern is worth trading. Nothing about the reversal is random. It is demand failing at a level the market has already tested and thrown back twice.

How to Identify a Double Top Pattern Correctly

A valid double top pattern has four elements. Confirming all four before entering keeps traders out of false setups. Here are the four elements to verify before trading a double top: 1. Prior uptrend. The pattern must form after a clear move higher. A double top without a prior uptrend is not a reversal pattern. It is a range. 2. Two distinct peaks near the same resistance level. The peaks do not need to be at the exact same price. A difference of 20 to 30 pips between them is normal and valid. 3. A neckline formed by the low between the two peaks. This level acts as the boundary between a pattern in progress and a confirmed reversal. 4. A closing break below the neckline. A candle close below the neckline on the current time frame confirms the pattern. A wick that dips below does not count. he most expensive mistake here is demanding that both peaks sit at exactly the same price. They never do. One top is almost always a few pips off the other, and that is just what a real chart looks like. The textbook diagrams lie to you on this one, and traders who throw out setups over uneven peaks end up missing some of the cleanest trades on the board. When the second peak is slightly lower than the first, the bearish signal is actually stronger. It means buyers tried again and failed to reach the previous high. That weakening momentum increases the probability of a sustained reversal. Asia Forex Mentor teaches traders to draw a resistance zone rather than a single resistance line when assessing double tops. If both peaks fall within that zone, the pattern qualifies. The neckline is the confirmation trigger regardless of peak alignment. For a broader look at how reversal setups appear on live forex charts, the reversal trading strategy guide walks through how these formations develop in real time.

The Neckline Break Explained

The neckline is the most important level in the double top pattern. Draw it horizontally at the low point between the two peaks. Nothing about the pattern is confirmed until price closes below this level. Plenty of traders see price tag the neckline and assume they are in. A touch does not count. Neither does a wick poking through it. What actually confirms the pattern is a full candle closing below the line on the time frame you are trading, and nothing short of that. The neckline also determines the profit target. The pip distance from the neckline to the peaks sets how far price is expected to fall after the break. Traders who skip this measurement enter without a defined exit and end up cutting winners short or holding too long. A neckline that tilts a little, up or down, still works. Draw it off the lowest point of the pullback between the two peaks and use candle closes against that line as your trigger. The slight angle changes nothing about the rule. Traders who want to build the discipline to wait for neckline confirmation will find the 10 trading discipline habits guide directly relevant to this point.

How to Trade the Double Top Pattern

There are two entries for the double top pattern: the breakout entry and the retest entry. Both are valid. The right choice depends on how the pair is moving and the trader's risk tolerance.

The Breakout Entry

The breakout entry triggers when price closes below the neckline. Traders place a sell order at the open of the next candle after that confirmed close. This entry captures the move early but accepts the risk that price may pull back toward the neckline before continuing lower. Breakout entries suit faster-moving pairs and time frames where retests are infrequent. They work best when the break closes well below the neckline with strong momentum. A weak or hesitant close just below the neckline is better approached with the retest entry.

The Retest Entry

After price breaks the neckline, it often returns to test that level from below. The neckline, which was support between the two peaks, now acts as resistance. The retest entry waits for price to return to the neckline, shows rejection there, and then enters short. The retest entry offers a tighter stop and a better risk-to-reward ratio. The tradeoff is that not every double top produces a clean retest. On some pairs, price moves straight down from the breakout. Traders who always wait for the retest will miss those moves.

Stop Placement

For both entries, the stop loss belongs above the higher of the two peaks. This level marks the point at which the pattern fails. If price trades above that level, the bearish thesis is invalid and the position should be closed. Placing the stop too close to the neckline is one of the most common stop loss mistakes in forex trading. Price often revisits the neckline after the break. A tight stop gets taken out before the real move begins.

Profit Target

Measure the pip distance from the neckline to the highest of the two peaks. Project that same distance downward from the neckline break point. That level becomes the initial profit target. Here is a worked example with specific levels: - Peak 1: 1.3200 - Peak 2: 1.3180 - Neckline: 1.3000 - Pattern height: 200 pips (1.3200 minus 1.3000) - Target: 1.2800 (200 pips below the neckline break) The entry is at the neckline break, at 1.3000, and the stop sits above the higher peak. With a stop 30 pips above the higher peak, at 1.3230, the risk is about 230 pips against the 200-pip target, which is close to 1:1. Because a double top's measured target and its stop distance are both roughly the height of the pattern, the base setup tends to sit near 1:1. Traders build on that by taking partial profit at the measured target and trailing the remainder when the reversal keeps running.  
Asia Forex Mentor has trained more than 100,000 traders across 50+ countries to measure and execute setups exactly like this one. Investopedia named it the "Most Comprehensive Course" and Benzinga named it the "Best Forex Trading Course."

Double Top vs Double Bottom

The double bottom is the mirror image of the double top. Where the double top signals a bearish reversal after an uptrend, the double bottom signals a bullish reversal after a downtrend. Both patterns use the same four elements in opposite directions.

The table below compares the two patterns side by side:

Feature Double Top Double Bottom
Trend Before Pattern Uptrend Downtrend
Pattern Shape Letter M Letter W
Levels Tested Resistance fails twice Support holds twice
Neckline Position Low between the two peaks High between the two troughs
Confirmation Signal Close below neckline Close above neckline
Trade Direction Short (sell) Long (buy)
Target Direction Downward from neckline break Upward from neckline break
Stop Placement Above the higher peak Below the lower trough
The execution is the same for both patterns. Identify the structure and wait for the neckline break. Choose a breakout or retest entry. Place the stop beyond the pattern extremes and measure the target from the pattern height. The double bottom appears frequently after sharp sell-offs in trending markets. Traders who know both patterns can operate on both sides of the market with the same consistent framework.

Common Mistakes Traders Make

The double top pattern fails traders not because the pattern is unreliable, but because specific execution errors repeat themselves across thousands of accounts. Here are the four mistakes that cost traders the most on double top setups: 1. Entering before the neckline breaks. This is the one that wipes accounts. Until price closes below the neckline, there is no confirmed pattern, yet traders pile in at the second peak or the moment price grazes the neckline. Plenty of setups that look like perfect double tops just keep climbing and never break at all. 2. Rejecting uneven peaks. Demand two identical tops and you will throw out most of the good trades. What matters is that both peaks reject from the same resistance zone, not that they print the same price to the pip. 3. Placing the stop below the neckline. Park it just under the neckline and a routine retest takes you out before the move even starts. The stop belongs above the higher peak, where the pattern actually fails, so the trade has room to breathe. 4. Skipping the target calculation. No target means you are guessing at the exit, and guessing is how good trades turn into breakeven ones. Measure the pattern height before you enter, drop a limit at that level, and then get out of your own way. Building the patience to avoid these mistakes requires a consistent mental process. The trading mindset guide from Asia Forex Mentor covers how to stay disciplined through the wait for confirmation. Also Read: 14 Forex Candle Patterns Every Serious Trader Must Know

Conclusion

The double top pattern is one of the most reliable bearish reversal signals in forex. Execution is the whole game. You wait for the neckline to break, pick your entry, and set the stop above the higher peak, all before you calculate where the trade is going. Get that sequence right and the pattern does the rest. The uneven peaks trap catches traders who learned the pattern from simplified diagrams. Real charts are messier than textbook examples. Two tops at slightly different levels, both rejected at the same resistance zone, qualify as a valid pattern. Dismissing the setup because the peaks are not identical means missing the trade. The free Asia Forex Mentor training covers this full trading system, taught to more than 100,000 traders across 50+ countries. Access the free 3-step training here.

Frequently Asked Questions

What Is the Double Top Pattern in Forex?

It is a bearish reversal that shows up after an uptrend. Price runs at a resistance level, fails, comes back and fails again, then rolls over. You only have a confirmed pattern once price closes below the neckline, the low sitting between those two peaks. In plain terms, buyers took two swings, missed both, and sellers took the wheel.

Do the Two Tops Need to Be at Exactly the Same Price?

No, and expecting them to is one of the most common ways traders talk themselves out of good setups. The two tops just need to reject from the same resistance zone. If anything, a second peak that comes in a little lower is the stronger signal, because it means buyers could not even get back to the previous high.

What Is the Neckline in a Double Top Pattern?

Draw the neckline across the lowest point between the two peaks. That line is the border between a pattern that might happen and one that actually has. Price has to close below it to confirm. A wick poking through or a quick touch does nothing for you.

How Do I Calculate the Profit Target for a Double Top?

Measure from the neckline up to the higher of the two peaks. That gap is your pattern height. Take the same number of pips and project it straight down from where price broke the neckline. Peaks sitting 200 pips above the line? Your target is 200 pips below the break.

What Is the Difference Between the Breakout Entry and the Retest Entry?

With the breakout entry, you sell the open of the candle right after price closes below the neckline. With the retest, you wait for price to come back up to the neckline, get rejected, and then short it. The retest gives you a tighter stop and better reward for the risk. The catch is that some pairs never look back, so you miss those moves entirely.

Where Should the Stop Loss Go on a Double Top Trade?

Put the stop above the higher of the two peaks. That keeps you in through the normal chop that follows a breakout, and it only takes you out if price climbs back above the resistance that defined the whole pattern. At that point the bearish case is dead anyway.

Is the Double Top Pattern Reliable in Forex?

It is, as long as all four elements are there and you actually wait for the neckline to break. It holds up across majors, minors, and exotics. Where it falls apart is trader behavior, jumping in early, ignoring the neckline, or tossing out valid setups over uneven peaks. Stick to the H4 and daily charts and the signals get a lot cleaner.

ezekiel chew asiaforexmentor

About Ezekiel Chew

Ezekiel Chew, founder and head of training at Asia Forex Mentor, is a renowned forex expert, frequently invited to speak at major industry events. Known for his deep market insights, Ezekiel is one of the top traders committed to supporting the trading community. Making six figures per trade, he also trains traders working in banks, fund management, and prop trading firms.

RELATED ARTICLES

Double Top Pattern Forex Trading Guide In 2026

4.0
Overall Trust Index

Written by:

Updated:

August 3, 2026
The double top pattern has taken more money from traders than it has returned to them. The pattern works fine. The problem is that most traders pull the trigger before the neckline ever breaks.

ABOUT THIS GUIDE

This guide explains what the double top pattern is, how to identify it on any currency pair including the trap of unequal peaks, and the exact trade plan used at Asia Forex Mentor, from the neckline break to stop placement to profit target calculation.
 

QUICK ANSWER

The double top pattern is a bearish reversal signal in which price tests a resistance level twice and fails both times. Confirmation comes only when price closes below the neckline, the low point between the two peaks. The profit target equals the height of the pattern projected downward from the neckline break.

What the Double Top Pattern Is

The double top pattern is a bearish reversal formation that appears on a price chart after an extended uptrend. Price rises to a resistance level, pulls back, rallies toward that same level again, and fails a second time. The pattern signals that buyers cannot push price any higher and that sellers are taking control. On a chart it looks like a capital M, though real ones are never that tidy. The two peaks represent two failed attempts at resistance. The low between them marks the neckline, which is the confirmation level traders watch. No neckline break means no confirmed pattern. This pattern appears on every time frame and every currency pair. Asia Forex Mentor focuses on the H4 and daily charts because those time frames produce cleaner, more tradeable signals than the noise found in shorter time frames.

The Market Psychology Behind It

Every double top is really a story about buyers running out of conviction. Understanding those decisions separates traders who read the setup correctly from traders who guess. The first peak forms when buyers push price into a resistance zone. Sellers at that level are strong enough to stall the move and send price back down. Most traders assume this pullback is temporary. They buy the dip and push price back toward the highs. When price reaches resistance again and sellers defend it a second time, the second peak forms. Buyers who entered during the pullback are now stuck in losing positions near the highs. As price turns lower from the second peak and breaks below the neckline, those trapped buyers exit. That selling adds pressure to the downside move. That trapped-buyer fuel is the whole reason this pattern is worth trading. Nothing about the reversal is random. It is demand failing at a level the market has already tested and thrown back twice.

How to Identify a Double Top Pattern Correctly

A valid double top pattern has four elements. Confirming all four before entering keeps traders out of false setups. Here are the four elements to verify before trading a double top: 1. Prior uptrend. The pattern must form after a clear move higher. A double top without a prior uptrend is not a reversal pattern. It is a range. 2. Two distinct peaks near the same resistance level. The peaks do not need to be at the exact same price. A difference of 20 to 30 pips between them is normal and valid. 3. A neckline formed by the low between the two peaks. This level acts as the boundary between a pattern in progress and a confirmed reversal. 4. A closing break below the neckline. A candle close below the neckline on the current time frame confirms the pattern. A wick that dips below does not count. he most expensive mistake here is demanding that both peaks sit at exactly the same price. They never do. One top is almost always a few pips off the other, and that is just what a real chart looks like. The textbook diagrams lie to you on this one, and traders who throw out setups over uneven peaks end up missing some of the cleanest trades on the board. When the second peak is slightly lower than the first, the bearish signal is actually stronger. It means buyers tried again and failed to reach the previous high. That weakening momentum increases the probability of a sustained reversal. Asia Forex Mentor teaches traders to draw a resistance zone rather than a single resistance line when assessing double tops. If both peaks fall within that zone, the pattern qualifies. The neckline is the confirmation trigger regardless of peak alignment. For a broader look at how reversal setups appear on live forex charts, the reversal trading strategy guide walks through how these formations develop in real time.

The Neckline Break Explained

The neckline is the most important level in the double top pattern. Draw it horizontally at the low point between the two peaks. Nothing about the pattern is confirmed until price closes below this level. Plenty of traders see price tag the neckline and assume they are in. A touch does not count. Neither does a wick poking through it. What actually confirms the pattern is a full candle closing below the line on the time frame you are trading, and nothing short of that. The neckline also determines the profit target. The pip distance from the neckline to the peaks sets how far price is expected to fall after the break. Traders who skip this measurement enter without a defined exit and end up cutting winners short or holding too long. A neckline that tilts a little, up or down, still works. Draw it off the lowest point of the pullback between the two peaks and use candle closes against that line as your trigger. The slight angle changes nothing about the rule. Traders who want to build the discipline to wait for neckline confirmation will find the 10 trading discipline habits guide directly relevant to this point.

How to Trade the Double Top Pattern

There are two entries for the double top pattern: the breakout entry and the retest entry. Both are valid. The right choice depends on how the pair is moving and the trader's risk tolerance.

The Breakout Entry

The breakout entry triggers when price closes below the neckline. Traders place a sell order at the open of the next candle after that confirmed close. This entry captures the move early but accepts the risk that price may pull back toward the neckline before continuing lower. Breakout entries suit faster-moving pairs and time frames where retests are infrequent. They work best when the break closes well below the neckline with strong momentum. A weak or hesitant close just below the neckline is better approached with the retest entry.

The Retest Entry

After price breaks the neckline, it often returns to test that level from below. The neckline, which was support between the two peaks, now acts as resistance. The retest entry waits for price to return to the neckline, shows rejection there, and then enters short. The retest entry offers a tighter stop and a better risk-to-reward ratio. The tradeoff is that not every double top produces a clean retest. On some pairs, price moves straight down from the breakout. Traders who always wait for the retest will miss those moves.

Stop Placement

For both entries, the stop loss belongs above the higher of the two peaks. This level marks the point at which the pattern fails. If price trades above that level, the bearish thesis is invalid and the position should be closed. Placing the stop too close to the neckline is one of the most common stop loss mistakes in forex trading. Price often revisits the neckline after the break. A tight stop gets taken out before the real move begins.

Profit Target

Measure the pip distance from the neckline to the highest of the two peaks. Project that same distance downward from the neckline break point. That level becomes the initial profit target. Here is a worked example with specific levels: - Peak 1: 1.3200 - Peak 2: 1.3180 - Neckline: 1.3000 - Pattern height: 200 pips (1.3200 minus 1.3000) - Target: 1.2800 (200 pips below the neckline break) The entry is at the neckline break, at 1.3000, and the stop sits above the higher peak. With a stop 30 pips above the higher peak, at 1.3230, the risk is about 230 pips against the 200-pip target, which is close to 1:1. Because a double top's measured target and its stop distance are both roughly the height of the pattern, the base setup tends to sit near 1:1. Traders build on that by taking partial profit at the measured target and trailing the remainder when the reversal keeps running.  
Asia Forex Mentor has trained more than 100,000 traders across 50+ countries to measure and execute setups exactly like this one. Investopedia named it the "Most Comprehensive Course" and Benzinga named it the "Best Forex Trading Course."

Double Top vs Double Bottom

The double bottom is the mirror image of the double top. Where the double top signals a bearish reversal after an uptrend, the double bottom signals a bullish reversal after a downtrend. Both patterns use the same four elements in opposite directions.

The table below compares the two patterns side by side:

Feature Double Top Double Bottom
Trend Before Pattern Uptrend Downtrend
Pattern Shape Letter M Letter W
Levels Tested Resistance fails twice Support holds twice
Neckline Position Low between the two peaks High between the two troughs
Confirmation Signal Close below neckline Close above neckline
Trade Direction Short (sell) Long (buy)
Target Direction Downward from neckline break Upward from neckline break
Stop Placement Above the higher peak Below the lower trough
The execution is the same for both patterns. Identify the structure and wait for the neckline break. Choose a breakout or retest entry. Place the stop beyond the pattern extremes and measure the target from the pattern height. The double bottom appears frequently after sharp sell-offs in trending markets. Traders who know both patterns can operate on both sides of the market with the same consistent framework.

Common Mistakes Traders Make

The double top pattern fails traders not because the pattern is unreliable, but because specific execution errors repeat themselves across thousands of accounts. Here are the four mistakes that cost traders the most on double top setups: 1. Entering before the neckline breaks. This is the one that wipes accounts. Until price closes below the neckline, there is no confirmed pattern, yet traders pile in at the second peak or the moment price grazes the neckline. Plenty of setups that look like perfect double tops just keep climbing and never break at all. 2. Rejecting uneven peaks. Demand two identical tops and you will throw out most of the good trades. What matters is that both peaks reject from the same resistance zone, not that they print the same price to the pip. 3. Placing the stop below the neckline. Park it just under the neckline and a routine retest takes you out before the move even starts. The stop belongs above the higher peak, where the pattern actually fails, so the trade has room to breathe. 4. Skipping the target calculation. No target means you are guessing at the exit, and guessing is how good trades turn into breakeven ones. Measure the pattern height before you enter, drop a limit at that level, and then get out of your own way. Building the patience to avoid these mistakes requires a consistent mental process. The trading mindset guide from Asia Forex Mentor covers how to stay disciplined through the wait for confirmation. Also Read: 14 Forex Candle Patterns Every Serious Trader Must Know

Conclusion

The double top pattern is one of the most reliable bearish reversal signals in forex. Execution is the whole game. You wait for the neckline to break, pick your entry, and set the stop above the higher peak, all before you calculate where the trade is going. Get that sequence right and the pattern does the rest. The uneven peaks trap catches traders who learned the pattern from simplified diagrams. Real charts are messier than textbook examples. Two tops at slightly different levels, both rejected at the same resistance zone, qualify as a valid pattern. Dismissing the setup because the peaks are not identical means missing the trade. The free Asia Forex Mentor training covers this full trading system, taught to more than 100,000 traders across 50+ countries. Access the free 3-step training here.

Frequently Asked Questions

What Is the Double Top Pattern in Forex?

It is a bearish reversal that shows up after an uptrend. Price runs at a resistance level, fails, comes back and fails again, then rolls over. You only have a confirmed pattern once price closes below the neckline, the low sitting between those two peaks. In plain terms, buyers took two swings, missed both, and sellers took the wheel.

Do the Two Tops Need to Be at Exactly the Same Price?

No, and expecting them to is one of the most common ways traders talk themselves out of good setups. The two tops just need to reject from the same resistance zone. If anything, a second peak that comes in a little lower is the stronger signal, because it means buyers could not even get back to the previous high.

What Is the Neckline in a Double Top Pattern?

Draw the neckline across the lowest point between the two peaks. That line is the border between a pattern that might happen and one that actually has. Price has to close below it to confirm. A wick poking through or a quick touch does nothing for you.

How Do I Calculate the Profit Target for a Double Top?

Measure from the neckline up to the higher of the two peaks. That gap is your pattern height. Take the same number of pips and project it straight down from where price broke the neckline. Peaks sitting 200 pips above the line? Your target is 200 pips below the break.

What Is the Difference Between the Breakout Entry and the Retest Entry?

With the breakout entry, you sell the open of the candle right after price closes below the neckline. With the retest, you wait for price to come back up to the neckline, get rejected, and then short it. The retest gives you a tighter stop and better reward for the risk. The catch is that some pairs never look back, so you miss those moves entirely.

Where Should the Stop Loss Go on a Double Top Trade?

Put the stop above the higher of the two peaks. That keeps you in through the normal chop that follows a breakout, and it only takes you out if price climbs back above the resistance that defined the whole pattern. At that point the bearish case is dead anyway.

Is the Double Top Pattern Reliable in Forex?

It is, as long as all four elements are there and you actually wait for the neckline to break. It holds up across majors, minors, and exotics. Where it falls apart is trader behavior, jumping in early, ignoring the neckline, or tossing out valid setups over uneven peaks. Stick to the H4 and daily charts and the signals get a lot cleaner.

ezekiel chew asiaforexmentor

About Ezekiel Chew

Ezekiel Chew, founder and head of training at Asia Forex Mentor, is a renowned forex expert, frequently invited to speak at major industry events. Known for his deep market insights, Ezekiel is one of the top traders committed to supporting the trading community. Making six figures per trade, he also trains traders working in banks, fund management, and prop trading firms.

RELATED ARTICLES

Join the Live Event
Get Your Free Ticket Now

I consent to receiving emails and/or text message reminders for this event.

REGISTER FOR THE MASTERCLASS!