Learn To Trade Forex • Best Forex Trading Course • AsiaForexMentor

How to Use Fibonacci Retracement Step by Step in 2026

Written by

Ezekiel Chew

Updated on

August 13, 2026

i
Its a default text

How to Use Fibonacci Retracement Step by Step in 2026

Written by:

Last updated on:

August 13, 2026

Most traders learn how to use Fibonacci retracement and immediately draw it wrong. This tool comes from a mathematical sequence first documented in 1202, and institutional traders use it daily to plan entries at precise price levels. The majority of retail traders miss the one placement rule that makes every level on the chart either meaningful or useless.

ABOUT THIS GUIDE

This guide covers Fibonacci retracement from the ground up for forex traders: what it is, how to draw it correctly, what each level means, which levels institutional traders act on, and how to build a complete trade entry with a stop and target around a single retracement level.


QUICK ANSWER

Fibonacci retracement divides a price move into key percentage levels (23.6%, 38.2%, 50%, 61.8%, and 78.6%) where price may pause or reverse during a pullback. To use it, identify a clear swing high and swing low, apply the tool from the swing low to the swing high in an uptrend, then wait for price action confirmation before entering in the direction of the trend.

What Fibonacci Retracement Is and Why Price Respects These Levels

Fibonacci retracement is a technical analysis tool that marks horizontal lines on a price chart at percentage levels derived from the Fibonacci number sequence. The sequence produces a set of ratios. The most important one approaches 0.618 and is known as the golden ratio. That figure appears across natural structures, architecture, and financial markets.

Price respects Fibonacci levels not because of mathematics but because of behavior. Banks, hedge funds, and institutional trading desks have used Fibonacci retracement for decades as a core part of entry planning. When enough market participants act on the same level, price responds to the combined weight of their orders.

Forex markets move in waves. Price trends in one direction, pulls back, and then resumes the original trend. Fibonacci retracement marks where those pullbacks are most likely to find order clusters. The levels are not predictions. They are zones where institutional participants have chosen to act, which gives those zones real weight.

Asia Forex Mentor has trained more than 100,000 traders across 50+ countries in applying Fibonacci retracement within a rules-based entry framework. The consistent finding is that the levels hold because the market's biggest participants expect them to. Understanding the psychology behind each level makes the tool far more powerful than simply memorizing the percentages.

How to Draw Fibonacci Retracement Correctly

Getting the placement right is the single most important Fibonacci skill. A precise drawing produces reliable levels. An imprecise drawing produces noise that leads to losing trades. Most retail traders make one placement mistake that invalidates every level drawn afterward.

The Swing High and Swing Low

A swing high is a price peak with at least two lower highs on either side of it. A swing low is a price trough with at least two higher lows on either side of it. These two points are the anchor points for any Fibonacci retracement drawing. Understanding how to identify a valid swing high and swing low using market structure is the foundation of the method.

Do not use every minor candlestick wick as a swing point. Look for clear, visible turning points on the chart. The more prominent the swing, the more traders worldwide see the same anchor. More eyes on the same anchor means more orders clustering at the same retracement levels, which makes those levels far more reliable.

How to Draw Fibonacci Retracement in an Uptrend
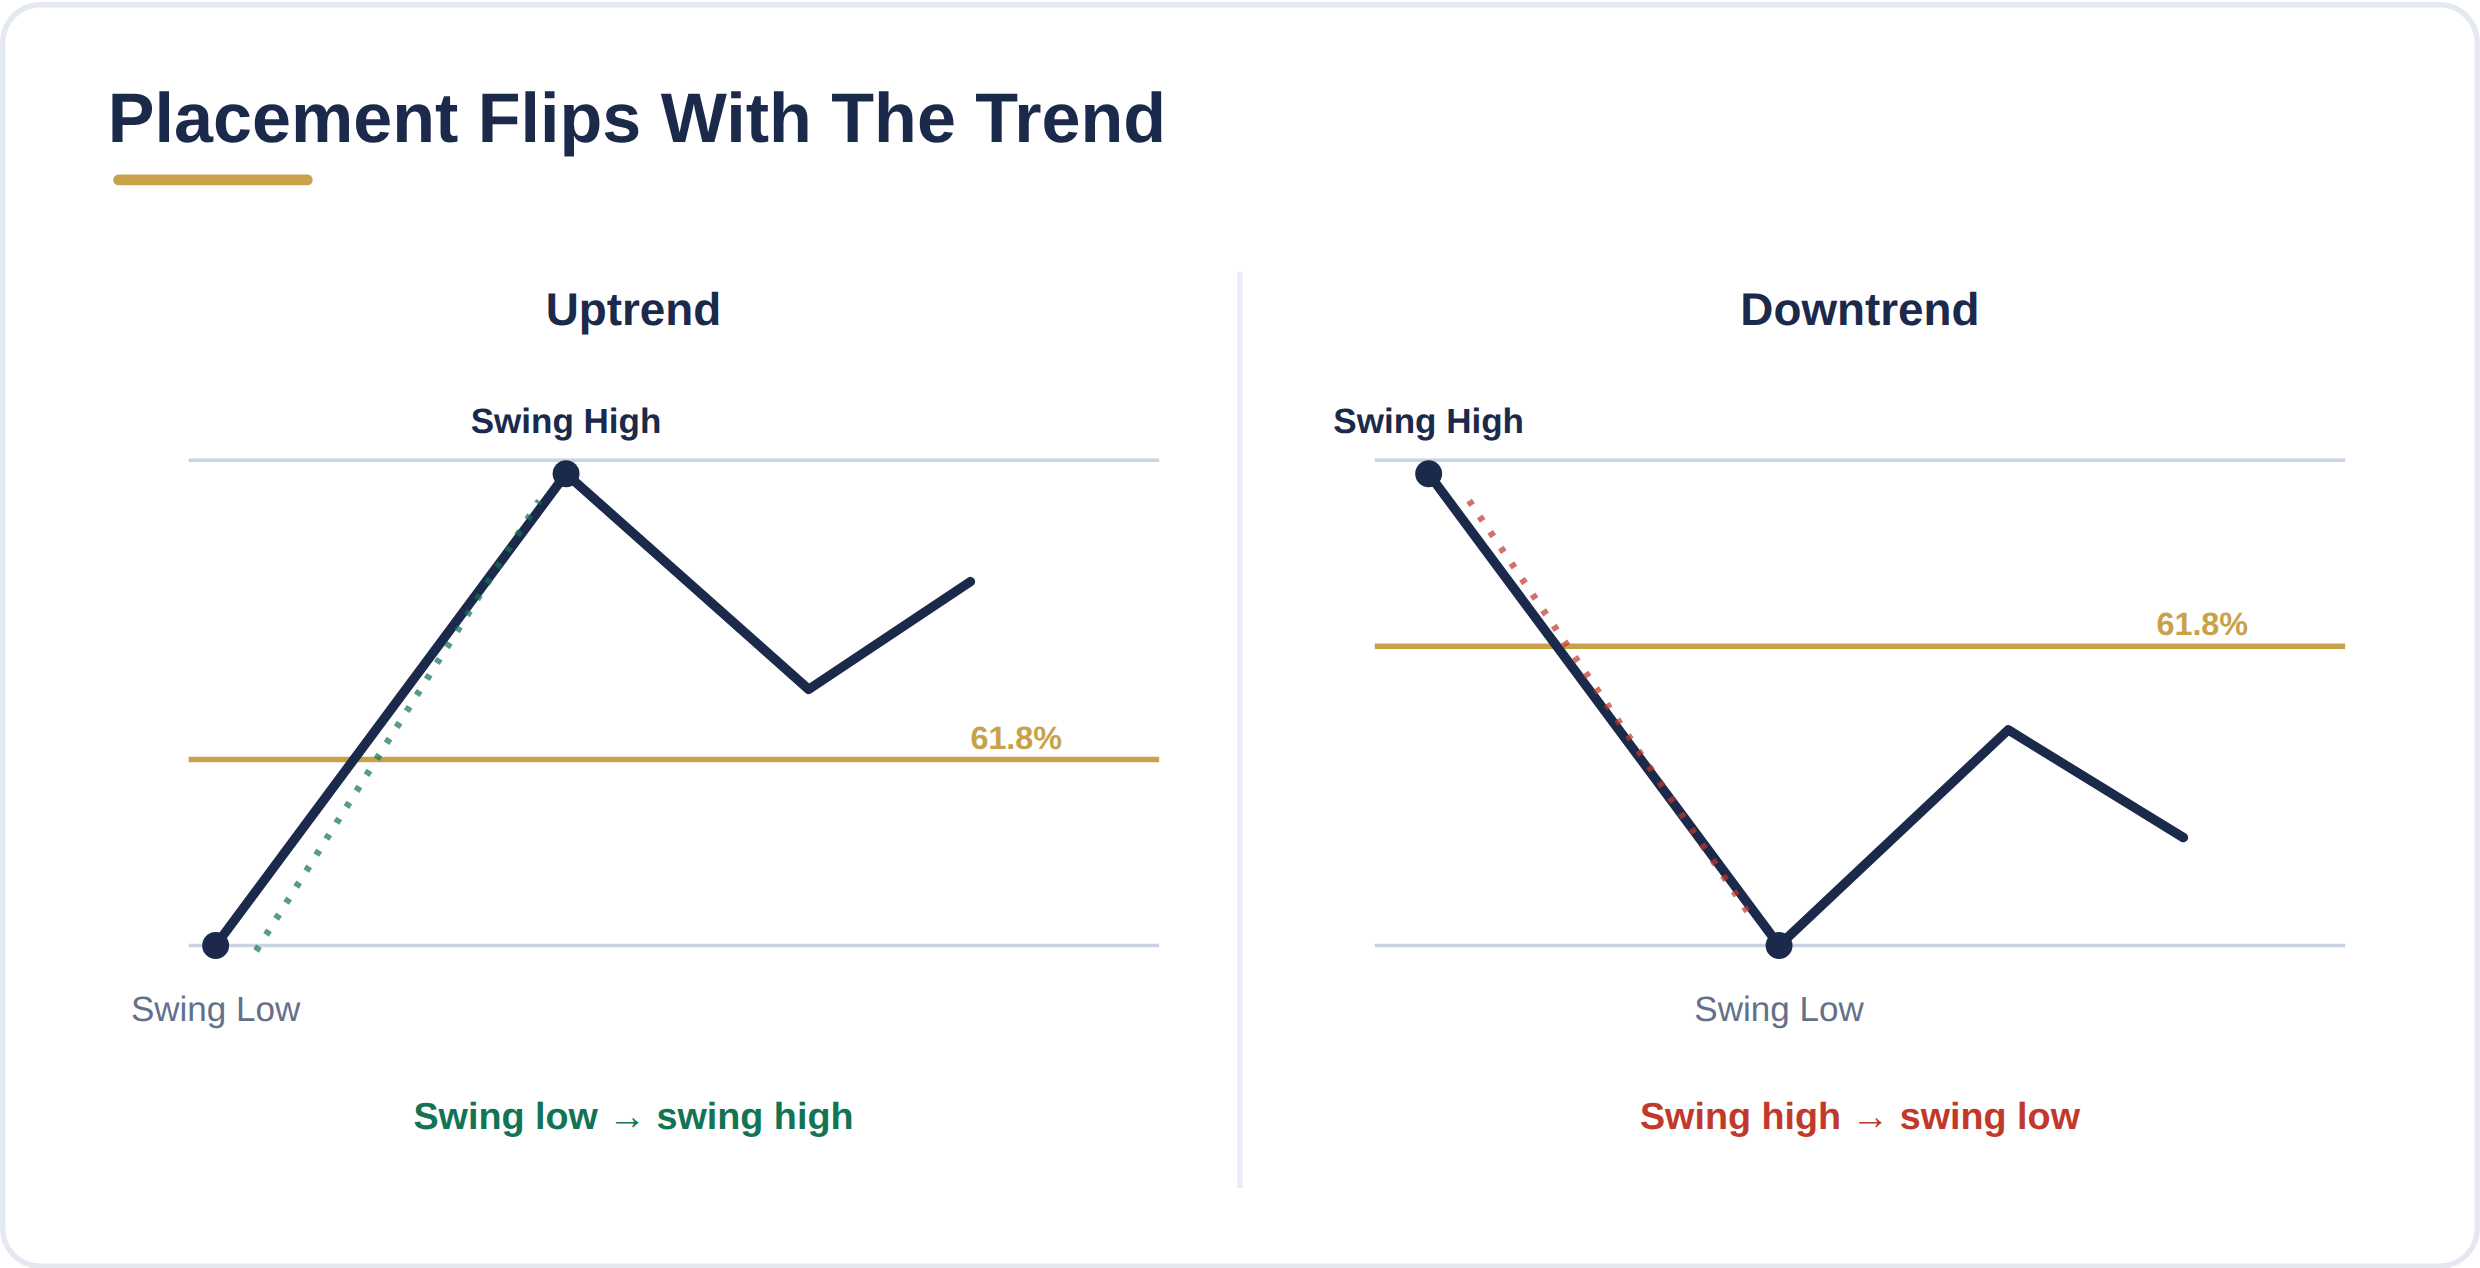
In an uptrend, the tool is applied from the bottom of the move to the top. Here are the steps to follow on any charting platform, including MetaTrader and TradingView:

1. Identify the most recent significant swing low. This is the starting point of the upward move being measured.
2. Identify the swing high that ended the rally. This is the top of the measured move.
3. Click the swing low first, then drag the Fibonacci tool up to the swing high.
4. Confirm the tool shows 0 at the swing low and 100 at the swing high.

The tool then plots retracement levels downward from the swing high at 23.6%, 38.2%, 50%, 61.8%, and 78.6%. Price is expected to pull back toward one of these levels before continuing higher.

How to Draw Fibonacci Retracement in a Downtrend

In a downtrend, the anchor points swap and the tool is applied from the top of the move to the bottom. Follow these steps:

1. Identify the swing high. This is the starting point of the downward move being measured.
2. Identify the swing low. This is the bottom of the move.
3. Click the swing high first, then drag the Fibonacci tool down to the swing low.
4. Confirm the tool shows 0 at the swing high and 100 at the swing low.

The retracement levels then mark potential areas where the downtrend resumes after a temporary bounce upward. Most charting platforms handle the math automatically once the anchor points are set correctly.

What Each Fibonacci Level Means

Each Fibonacci level marks a different depth of pullback and attracts a different degree of institutional attention. The table below summarizes all five levels before the most important ones are explained in detail.

Here is what each retracement level signals in a trending forex market:

Level Pullback Depth What It Signals
23.6% Very shallow Extremely strong trend; buyers are aggressive and not waiting for a discount
38.2% Moderate Healthy trend with strong directional bias; common institutional entry zone
50% Mid-point Psychological decision zone; not a Fibonacci ratio but widely respected
61.8% Deep The golden ratio; highest concentration of institutional order flow
78.6% Very deep Trend technically intact but showing strain; higher-risk entry

The 38.2% Level

The 38.2% retracement is common in fast-moving, healthy trends. It represents a moderate pullback that still signals strong directional momentum. Professional traders in trending markets frequently use this level for entries when price is unlikely to offer a deeper discount. A confirming candlestick at 38.2% in a strong trend is one of the cleaner setups available.

The 50% Level

The 50% level does not come from the Fibonacci sequence, but markets treat it as a key zone anyway. It represents the exact midpoint of the measured move and carries significant psychological weight. When price reaches the midpoint of a major rally or decline, traders worldwide see a decision point. The 50% level often aligns with prior horizontal structure, which reinforces its significance further.

The 61.8% Level

The 61.8% level is the most important Fibonacci retracement level in forex. It is derived directly from the golden ratio (0.618) and attracts the highest concentration of institutional limit orders in trending markets. Banks and algorithmic trading systems frequently cluster entries at this zone. When the 61.8% level aligns with prior support, a key moving average, or a supply and demand zone, the result is a high-probability setup that Asia Forex Mentor's framework prioritizes above all other retracement entries.

The 78.6% Level

The 78.6% retracement marks a deep pullback that tests whether the original trend has enough momentum to resume. A move to this level raises the question of whether the trend is still valid. Entries at 78.6% carry more risk. If price continues past this level, it almost always completes a full retracement of the original move, which would invalidate the trend entirely.

The Levels Institutional Traders Watch Most

Not every Fibonacci level receives equal institutional attention. Understanding which levels attract the heaviest order flow helps traders focus on setups with real backing rather than monitoring every line on the chart.

The 61.8% level is the most actively monitored by professional traders. Algorithmic systems at major banks and hedge funds frequently place limit buy orders in uptrends at this retracement and limit sell orders in downtrends at the equivalent zone. That combined order weight means price either reverses sharply from the 61.8% area or consolidates there before the trend resumes. Either way, the zone shows clear institutional activity.

The 38.2% level comes second. In fast-moving trends, institutions that missed an initial breakout watch the first 38.2% pullback for a re-entry opportunity. This pattern appears consistently on EUR/USD, GBP/USD, and USD/JPY across the 4-hour and daily timeframes. Retailers who know this can enter alongside institutional flow rather than chasing price.

The 50% level forces a clear decision. Price at the midpoint of a significant move pushes institutions to commit to one direction. Heavy buying or selling from that zone creates fast directional momentum, which is why the 50% level frequently produces clean, quick bounces.

The 23.6% and 78.6% levels become most relevant through confluence. A 23.6% level that sits directly on prior resistance turned support carries more weight than either factor alone. Supply and demand zones are one of the strongest confluence tools to combine with Fibonacci retracement levels when building a complete entry thesis.

The highest-probability Fibonacci setups occur when two or more independent technical factors agree on the same price zone. That confluence is what separates a level worth trading from a line the market drifts through.

How to Build a Trade Entry Around a Fibonacci Level

Reaching a Fibonacci level is not a trade signal on its own. Price action confirmation is required before any position is opened. Below is the complete process for turning a retracement level into a high-probability entry.

Step 1: Confirm the Trend

Before drawing any Fibonacci tool, confirm that a clear trend exists on the timeframe being traded. In an uptrend, price makes higher highs and higher lows. In a downtrend, price makes lower highs and lower lows. Using Fibonacci retracement in a ranging market produces misleading signals with no institutional backing. Reading trend direction with price action before applying any technical tool is the correct sequence.

Step 2: Draw the Tool and Set Alerts

After identifying the most recent significant swing high and swing low, draw the Fibonacci retracement tool on the chart. Set price alerts at the 38.2%, 50%, and 61.8% levels. This keeps the setup visible without requiring constant chart monitoring throughout the trading session.

Step 3: Wait for a Confirming Candlestick

When price reaches a key Fibonacci level, look for a candlestick signal before entering. The most reliable confirmation signals are:

– A bullish engulfing candle at a retracement level in an uptrend
– A pin bar with a long lower wick rejecting the level and closing bullish
– A bearish engulfing candle at a retracement level in a downtrend
– A pin bar with a long upper wick rejecting the level and closing bearish

Step 4: Enter and Place the Stop Loss

In an uptrend, enter at the close of the confirming bullish candle when price reacts from the Fibonacci level. The stop loss goes 5 to 10 pips below the swing low anchor point, not at the edge of the Fibonacci level itself. Placing the stop inside the zone is one of the most costly stop loss mistakes in Fibonacci trading. Normal price noise around a level will clip a stop that is positioned too close before the intended move begins.

Step 5: Set the Target

The first target is the 0% Fibonacci level, which is the original swing high for long trades or the original swing low for short trades. A second target can project beyond the original swing point using Fibonacci extension levels. Asia Forex Mentor's guide to Fibonacci extensions covers how to identify the next price target once the original swing is broken.

For a trade entered at the 61.8% level with a stop beyond the swing low, a return to the original swing high typically produces a risk-to-reward ratio between 1:1.4 and 1:1.5. Because the 61.8% entry is a deep pullback, the reward to the swing high is naturally smaller, which is why Asia Forex Mentor uses Fibonacci extension targets beyond the swing high to push the ratio higher on trades that keep running.

A Practical Trade Example
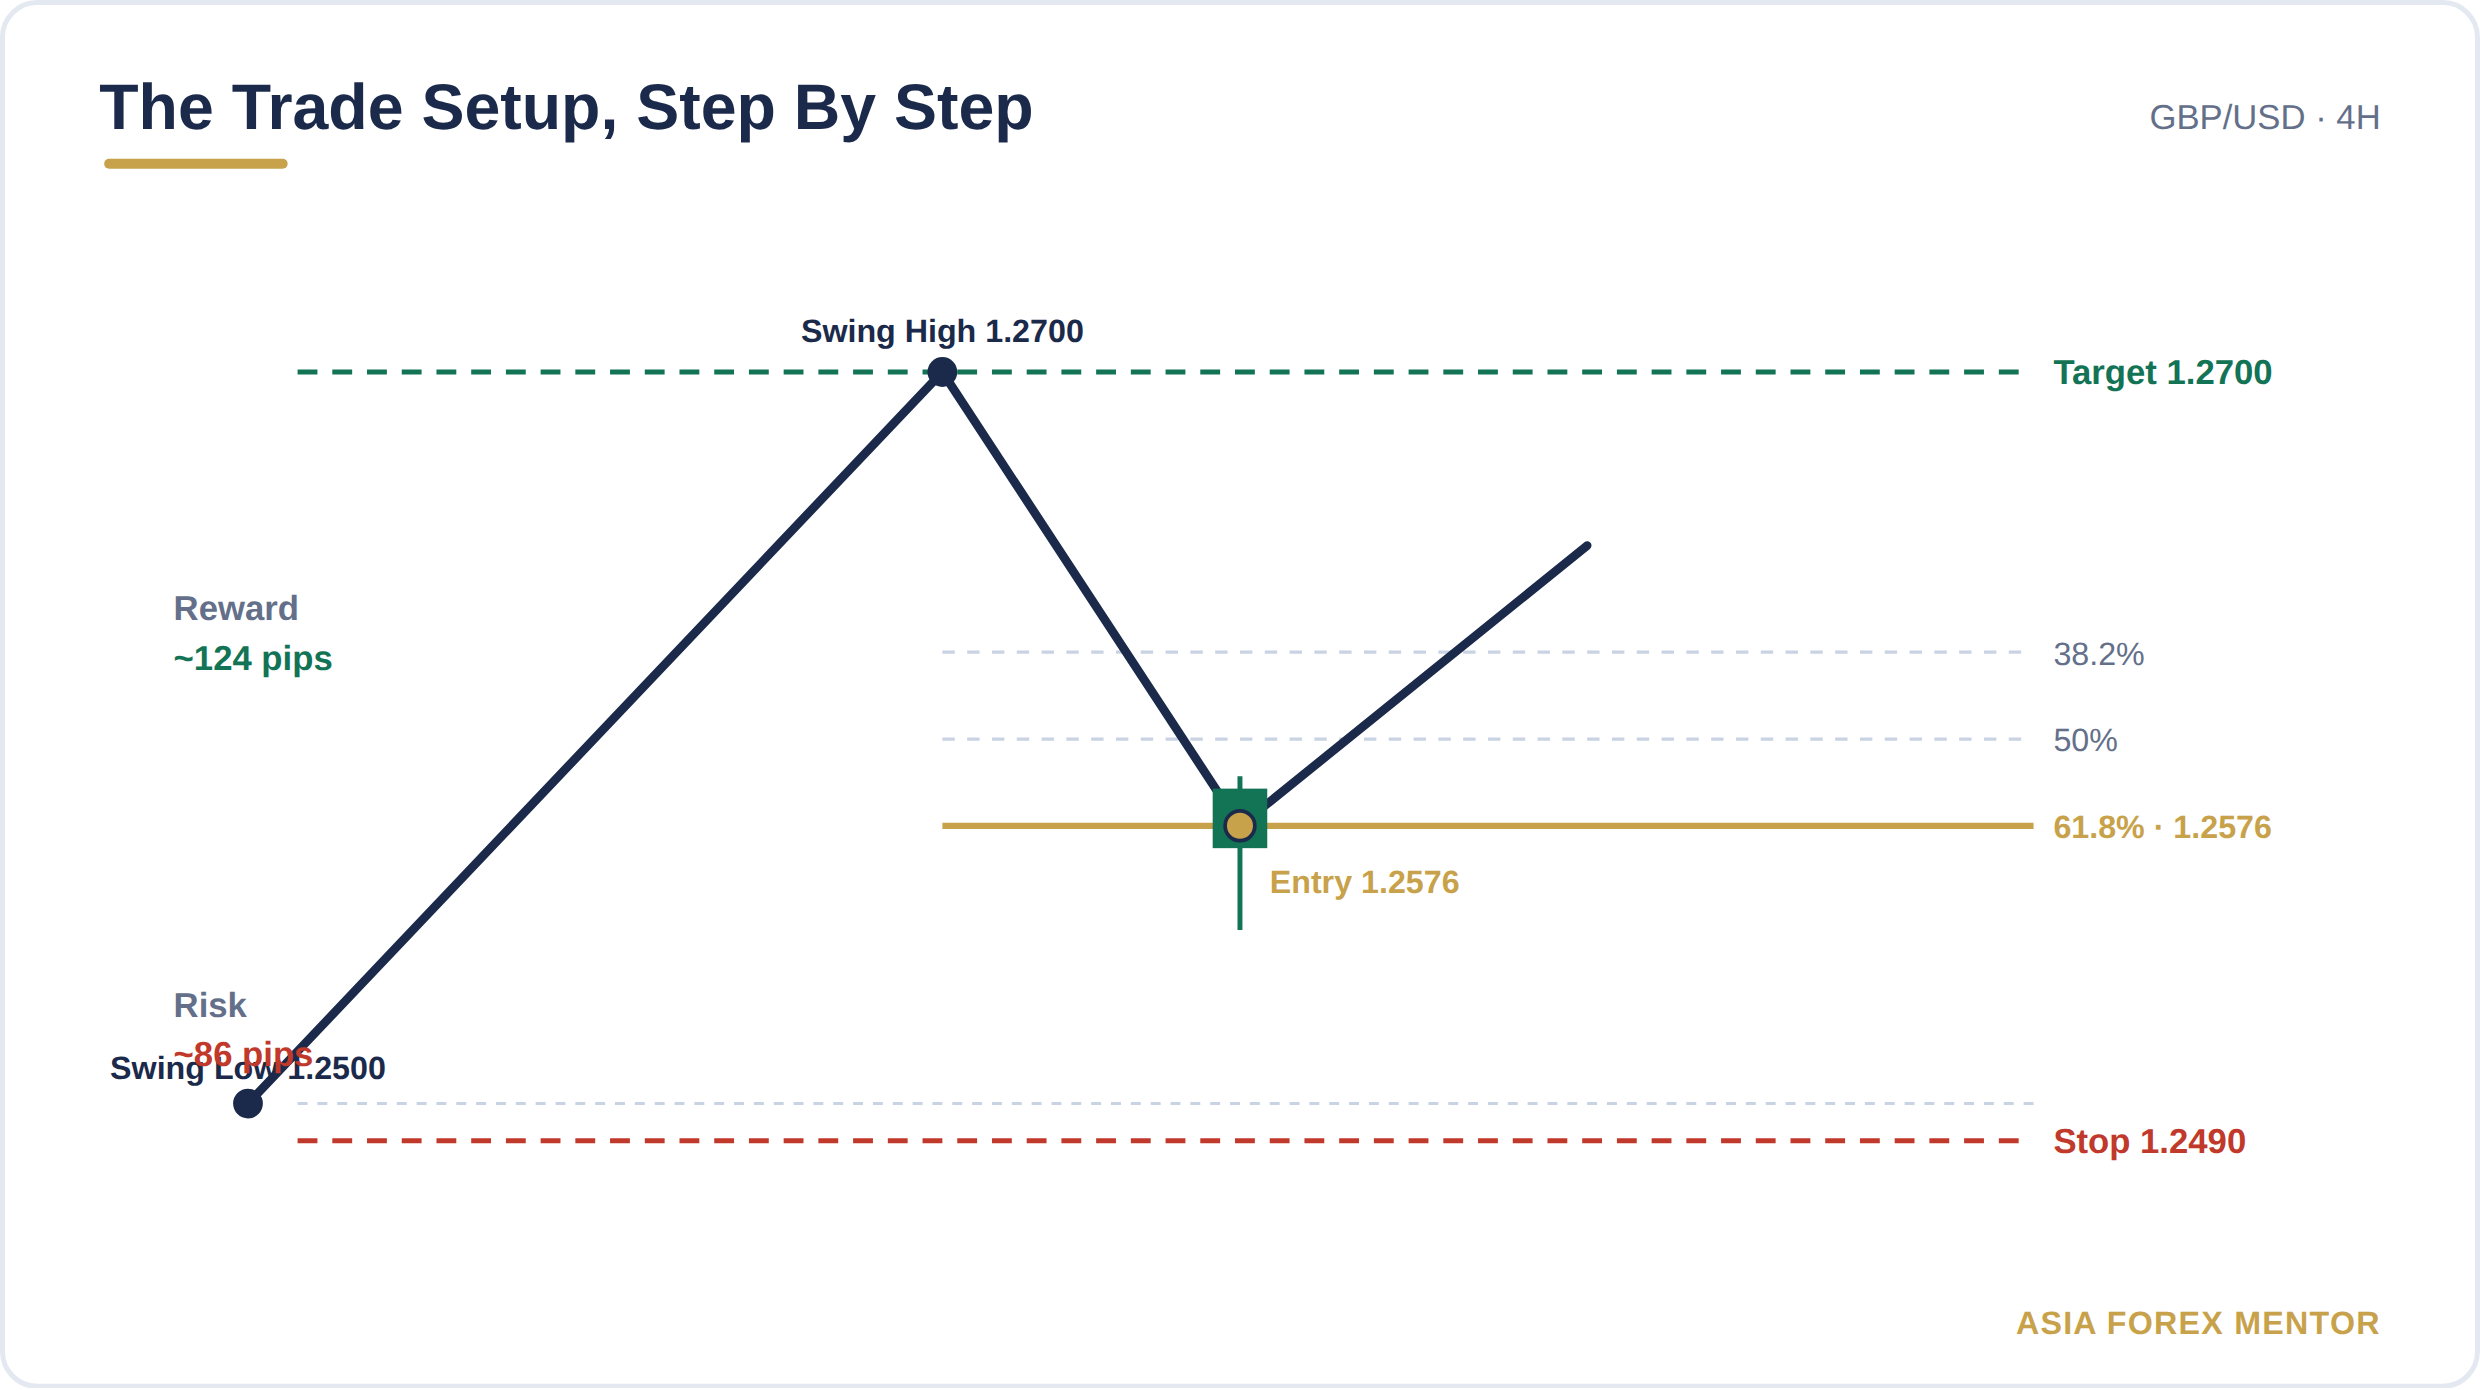
Consider GBP/USD in an uptrend on the 4-hour chart. Price rallies from 1.2500 to 1.2700, a 200-pip move. The 61.8% retracement sits at 1.2576 (200 pips multiplied by 0.618 equals 123 pips, subtracted from the swing high of 1.2700). Price pulls back to 1.2576 and forms a bullish pin bar with a long lower wick.

The entry is at the close of that pin bar. The stop goes 10 pips below the swing low at 1.2490. The first target is 1.2700.

This structure creates a risk of approximately 86 pips and a potential reward of approximately 124 pips, a ratio of about 1:1.4 to the swing high. Once price breaks through the swing high, Fibonacci extension levels open up a larger target and a better ratio. That is where Fibonacci extension levels become the next tool in the sequence.

Common Fibonacci Retracement Mistakes to Avoid

Most Fibonacci failures trace back to a small set of repeated errors. Knowing what they are prevents the losses that come with learning them the hard way.

Using It in a Ranging Market

Fibonacci retracement is a trend-continuation tool. It requires a clear, directional move to measure. In a choppy, sideways market, there is no meaningful swing high and swing low to anchor the tool. Price drifts through Fibonacci levels with no reaction because no institutional momentum exists to reverse from them.

Anchoring to the Wrong Swing Point

Every Fibonacci level on the chart is only as accurate as the swing points used to draw it. Anchoring the tool to a minor candlestick wick instead of a clean structural pivot produces levels that hold no institutional significance. Use only the most prominent turning point visible on the chart. Cross-check the same swing on one timeframe higher to confirm it is structurally meaningful.

Entering at Every Level Mechanically

Not every Fibonacci level holds every time. Entering mechanically at the 23.6%, 38.2%, 50%, 61.8%, and 78.6% levels on every pullback turns a disciplined method into an undisciplined one. Focus on the 61.8% level first. Combine it with at least one additional confluence factor before committing to a position.

Ignoring Confluence

A Fibonacci level alone is not a trade. The highest-probability setups occur when the Fibonacci level aligns with at least one independent factor: prior horizontal support or resistance, a relevant moving average, a supply and demand zone, or a price action signal. Treating any Fibonacci level as a guaranteed bounce in isolation produces repeated losses over time.

Placing the Stop Too Close

Setting the stop loss inside the Fibonacci zone instead of beyond the anchor swing point guarantees that market noise removes the trade before the real move develops. The stop belongs beyond the full swing point. This is a non-negotiable rule. An 86-pip stop positioned correctly is far more effective than a 20-pip stop positioned at the wrong location.

Also Read: Mastering Fibonacci Extension for Precise Trade Exits

Conclusion

Fibonacci retracement gives forex traders a systematic, repeatable way to identify high-probability entry points in trending markets. The tool takes minutes to learn. Applying it correctly, with the right swing points, at the right levels, with confirmed price action and a properly placed stop, takes more time but produces consistent results when the rules are followed.

The method works because institutional traders worldwide use the same levels. That shared behavior creates order clusters that give Fibonacci zones real market weight. Retail traders who understand this stop fighting institutional order flow and start aligning with it.

Asia Forex Mentor has refined this approach across more than 100,000 traders in 50+ countries. The consistent finding is that Fibonacci retracement works best as part of a complete framework. A level on a chart without a confirmation signal, a stop, and a defined target is not a trade. For traders who want to build a complete, rules-based system around these principles, Asia Forex Mentor's free training covers the full entry method step by step. Access the free training here.

Frequently Asked Questions

What is Fibonacci retracement in forex trading?

Fibonacci retracement is a technical tool that plots horizontal lines on a forex chart at key percentage levels derived from the Fibonacci number sequence. These levels (23.6%, 38.2%, 50%, 61.8%, and 78.6%) mark zones where price may pause or reverse during a pullback in a trending market. Institutional traders use these levels to plan limit entries and cluster orders. That collective behavior is why price so frequently reacts at Fibonacci zones.

How do you use Fibonacci retracement step by step?

First, confirm that a clear trend exists on the chart being analyzed. Identify the most recent significant swing low and swing high. In an uptrend, click the swing low and drag the Fibonacci tool up to the swing high. Then wait for price to pull back to the 38.2%, 50%, or 61.8% level and look for a confirming candlestick before entering in the direction of the original trend. Place the stop beyond the swing low and target the original swing high.

What is the best Fibonacci retracement level for forex trading?

The 61.8% retracement level is widely considered the most reliable level in forex. It comes directly from the golden ratio (0.618) and attracts the highest concentration of institutional order flow. Banks and algorithmic trading systems frequently cluster limit orders around this zone. When the 61.8% level aligns with prior horizontal structure or a supply and demand zone, the setup becomes even more compelling.

How do you identify a swing high and swing low for Fibonacci?

A swing high is a price peak with at least two lower highs on both sides of it. A swing low is a price trough with at least two higher lows on both sides of it. Look for clear, prominent turning points on the chart. The more visible the swing, the more traders globally see the same anchor point. Minor candlestick wicks or short-term noise spikes should never be used as Fibonacci anchor points.

Does Fibonacci retracement work in forex markets?

Yes, Fibonacci retracement works in forex because institutional traders, banks, and algorithmic systems collectively act on the same levels. When enough market participants place orders at the 61.8% or 38.2% zones, price responds to that combined order flow. The tool is most reliable in trending markets with clearly defined swing points. In choppy or ranging markets, Fibonacci levels are unreliable because no directional momentum exists to resume.

What is the difference between Fibonacci retracement and Fibonacci extension?

Fibonacci retracement measures pullback levels within a completed price move and helps identify entry points. Fibonacci extension projects where price may travel beyond the original swing high or low after the pullback ends and helps identify profit targets. Both tools use the same swing high and swing low anchor points but serve different purposes at different stages of a trade. Retracement finds the entry; extension finds the exit.

How should the stop loss be placed on a Fibonacci retracement trade?

The stop loss goes beyond the anchor swing point, not inside the Fibonacci zone. For a long trade at the 61.8% retracement in an uptrend, place the stop 5 to 10 pips below the swing low. Placing the stop directly at the Fibonacci level or inside the zone exposes the trade to being removed by normal market noise before the intended move begins. The stop belongs beyond the full structure of the swing.

Can Fibonacci retracement be used on any timeframe?

Fibonacci retracement works on all timeframes but produces the most reliable signals on the 4-hour and daily charts. Higher timeframe levels attract more institutional attention because more participants worldwide see and act on the same structure. On lower timeframes like the 5-minute or 15-minute chart, price noise around Fibonacci levels increases significantly. Many professional traders identify Fibonacci setups on the daily chart and use the 1-hour or 4-hour chart to time the entry with precision.

About Ezekiel Chew​

Ezekiel Chew, founder and head of training at Asia Forex Mentor, is a renowned forex expert, frequently invited to speak at major industry events. Known for his deep market insights, Ezekiel is one of the top traders committed to supporting the trading community. Making six figures per trade, he also trains traders working in banks, fund management, and prop trading firms.

Free Margin in Forex What the MT4 Panel Shows

Free margin in forex is the one figure on the MT4 or MT5 account panel that determines whether another position can open right now, and it is consistently the last number most traders learn to read. ABOUT THIS GUIDE This guide explains what free margin is and how it connects

Read More

Scalping Trading Strategy The Pros Actually Use

The scalping trading strategy most retail traders use is not actually scalping. They are gambling on 1-minute candles with no defined edge, no position-sizing rules, and no plan for when the losses come. ABOUT THIS GUIDE This guide covers what scalping is, how professional scalpers build a repeatable edge, and

Read More

Support and Resistance Levels Most Traders Draw Wrong

Support and resistance levels are the most widely referenced concept in technical analysis , yet retail trading data consistently shows that the majority of traders apply them without structural discipline. They draw too many lines, place them at the wrong prices, and then blame the market when price blows straight

Read More

Why Most Traders Get the Risk Reward Ratio Wrong

Traders who win 70% of their trades still lose money in forex when their average loss is twice their average gain. The risk reward ratio is the math that determines long-term profitability, not the win rate. ABOUT THIS GUIDE This guide breaks down in plain terms: what it means, how

Read More

London Trading Session 90 Minute Playbook for 2026

Most traders lose money during the London trading session . The setup is not the problem. They enter before the real move begins. ABOUT THIS GUIDE This guide covers the specific price-action setups that form in the first 90 minutes of the London forex market open, the institutional order-flow mechanics

Read More

AFM Trading Summit Live

Date: Coming Soon

Join us at the AFM Trading Summit Live and learn from top industry experts through live trading sessions, market insights, and actionable strategies.

How to Use Fibonacci Retracement Step by Step in 2026

4.0
Overall Trust Index

Written by:

Updated:

August 13, 2026
Most traders learn how to use Fibonacci retracement and immediately draw it wrong. This tool comes from a mathematical sequence first documented in 1202, and institutional traders use it daily to plan entries at precise price levels. The majority of retail traders miss the one placement rule that makes every level on the chart either meaningful or useless.

ABOUT THIS GUIDE

This guide covers Fibonacci retracement from the ground up for forex traders: what it is, how to draw it correctly, what each level means, which levels institutional traders act on, and how to build a complete trade entry with a stop and target around a single retracement level.
 

QUICK ANSWER

Fibonacci retracement divides a price move into key percentage levels (23.6%, 38.2%, 50%, 61.8%, and 78.6%) where price may pause or reverse during a pullback. To use it, identify a clear swing high and swing low, apply the tool from the swing low to the swing high in an uptrend, then wait for price action confirmation before entering in the direction of the trend.

What Fibonacci Retracement Is and Why Price Respects These Levels

Fibonacci retracement is a technical analysis tool that marks horizontal lines on a price chart at percentage levels derived from the Fibonacci number sequence. The sequence produces a set of ratios. The most important one approaches 0.618 and is known as the golden ratio. That figure appears across natural structures, architecture, and financial markets. Price respects Fibonacci levels not because of mathematics but because of behavior. Banks, hedge funds, and institutional trading desks have used Fibonacci retracement for decades as a core part of entry planning. When enough market participants act on the same level, price responds to the combined weight of their orders. Forex markets move in waves. Price trends in one direction, pulls back, and then resumes the original trend. Fibonacci retracement marks where those pullbacks are most likely to find order clusters. The levels are not predictions. They are zones where institutional participants have chosen to act, which gives those zones real weight. Asia Forex Mentor has trained more than 100,000 traders across 50+ countries in applying Fibonacci retracement within a rules-based entry framework. The consistent finding is that the levels hold because the market's biggest participants expect them to. Understanding the psychology behind each level makes the tool far more powerful than simply memorizing the percentages.

How to Draw Fibonacci Retracement Correctly

Getting the placement right is the single most important Fibonacci skill. A precise drawing produces reliable levels. An imprecise drawing produces noise that leads to losing trades. Most retail traders make one placement mistake that invalidates every level drawn afterward.

The Swing High and Swing Low

A swing high is a price peak with at least two lower highs on either side of it. A swing low is a price trough with at least two higher lows on either side of it. These two points are the anchor points for any Fibonacci retracement drawing. Understanding how to identify a valid swing high and swing low using market structure is the foundation of the method. Do not use every minor candlestick wick as a swing point. Look for clear, visible turning points on the chart. The more prominent the swing, the more traders worldwide see the same anchor. More eyes on the same anchor means more orders clustering at the same retracement levels, which makes those levels far more reliable.

How to Draw Fibonacci Retracement in an Uptrend

In an uptrend, the tool is applied from the bottom of the move to the top. Here are the steps to follow on any charting platform, including MetaTrader and TradingView: 1. Identify the most recent significant swing low. This is the starting point of the upward move being measured. 2. Identify the swing high that ended the rally. This is the top of the measured move. 3. Click the swing low first, then drag the Fibonacci tool up to the swing high. 4. Confirm the tool shows 0 at the swing low and 100 at the swing high. The tool then plots retracement levels downward from the swing high at 23.6%, 38.2%, 50%, 61.8%, and 78.6%. Price is expected to pull back toward one of these levels before continuing higher.

How to Draw Fibonacci Retracement in a Downtrend

In a downtrend, the anchor points swap and the tool is applied from the top of the move to the bottom. Follow these steps: 1. Identify the swing high. This is the starting point of the downward move being measured. 2. Identify the swing low. This is the bottom of the move. 3. Click the swing high first, then drag the Fibonacci tool down to the swing low. 4. Confirm the tool shows 0 at the swing high and 100 at the swing low. The retracement levels then mark potential areas where the downtrend resumes after a temporary bounce upward. Most charting platforms handle the math automatically once the anchor points are set correctly.

What Each Fibonacci Level Means

Each Fibonacci level marks a different depth of pullback and attracts a different degree of institutional attention. The table below summarizes all five levels before the most important ones are explained in detail. Here is what each retracement level signals in a trending forex market:
Level Pullback Depth What It Signals
23.6% Very shallow Extremely strong trend; buyers are aggressive and not waiting for a discount
38.2% Moderate Healthy trend with strong directional bias; common institutional entry zone
50% Mid-point Psychological decision zone; not a Fibonacci ratio but widely respected
61.8% Deep The golden ratio; highest concentration of institutional order flow
78.6% Very deep Trend technically intact but showing strain; higher-risk entry

The 38.2% Level

The 38.2% retracement is common in fast-moving, healthy trends. It represents a moderate pullback that still signals strong directional momentum. Professional traders in trending markets frequently use this level for entries when price is unlikely to offer a deeper discount. A confirming candlestick at 38.2% in a strong trend is one of the cleaner setups available.

The 50% Level

The 50% level does not come from the Fibonacci sequence, but markets treat it as a key zone anyway. It represents the exact midpoint of the measured move and carries significant psychological weight. When price reaches the midpoint of a major rally or decline, traders worldwide see a decision point. The 50% level often aligns with prior horizontal structure, which reinforces its significance further.

The 61.8% Level

The 61.8% level is the most important Fibonacci retracement level in forex. It is derived directly from the golden ratio (0.618) and attracts the highest concentration of institutional limit orders in trending markets. Banks and algorithmic trading systems frequently cluster entries at this zone. When the 61.8% level aligns with prior support, a key moving average, or a supply and demand zone, the result is a high-probability setup that Asia Forex Mentor's framework prioritizes above all other retracement entries.

The 78.6% Level

The 78.6% retracement marks a deep pullback that tests whether the original trend has enough momentum to resume. A move to this level raises the question of whether the trend is still valid. Entries at 78.6% carry more risk. If price continues past this level, it almost always completes a full retracement of the original move, which would invalidate the trend entirely.

The Levels Institutional Traders Watch Most

Not every Fibonacci level receives equal institutional attention. Understanding which levels attract the heaviest order flow helps traders focus on setups with real backing rather than monitoring every line on the chart. The 61.8% level is the most actively monitored by professional traders. Algorithmic systems at major banks and hedge funds frequently place limit buy orders in uptrends at this retracement and limit sell orders in downtrends at the equivalent zone. That combined order weight means price either reverses sharply from the 61.8% area or consolidates there before the trend resumes. Either way, the zone shows clear institutional activity. The 38.2% level comes second. In fast-moving trends, institutions that missed an initial breakout watch the first 38.2% pullback for a re-entry opportunity. This pattern appears consistently on EUR/USD, GBP/USD, and USD/JPY across the 4-hour and daily timeframes. Retailers who know this can enter alongside institutional flow rather than chasing price. The 50% level forces a clear decision. Price at the midpoint of a significant move pushes institutions to commit to one direction. Heavy buying or selling from that zone creates fast directional momentum, which is why the 50% level frequently produces clean, quick bounces. The 23.6% and 78.6% levels become most relevant through confluence. A 23.6% level that sits directly on prior resistance turned support carries more weight than either factor alone. Supply and demand zones are one of the strongest confluence tools to combine with Fibonacci retracement levels when building a complete entry thesis. The highest-probability Fibonacci setups occur when two or more independent technical factors agree on the same price zone. That confluence is what separates a level worth trading from a line the market drifts through.

How to Build a Trade Entry Around a Fibonacci Level

Reaching a Fibonacci level is not a trade signal on its own. Price action confirmation is required before any position is opened. Below is the complete process for turning a retracement level into a high-probability entry.

Step 1: Confirm the Trend

Before drawing any Fibonacci tool, confirm that a clear trend exists on the timeframe being traded. In an uptrend, price makes higher highs and higher lows. In a downtrend, price makes lower highs and lower lows. Using Fibonacci retracement in a ranging market produces misleading signals with no institutional backing. Reading trend direction with price action before applying any technical tool is the correct sequence.

Step 2: Draw the Tool and Set Alerts

After identifying the most recent significant swing high and swing low, draw the Fibonacci retracement tool on the chart. Set price alerts at the 38.2%, 50%, and 61.8% levels. This keeps the setup visible without requiring constant chart monitoring throughout the trading session.

Step 3: Wait for a Confirming Candlestick

When price reaches a key Fibonacci level, look for a candlestick signal before entering. The most reliable confirmation signals are: - A bullish engulfing candle at a retracement level in an uptrend - A pin bar with a long lower wick rejecting the level and closing bullish - A bearish engulfing candle at a retracement level in a downtrend - A pin bar with a long upper wick rejecting the level and closing bearish

Step 4: Enter and Place the Stop Loss

In an uptrend, enter at the close of the confirming bullish candle when price reacts from the Fibonacci level. The stop loss goes 5 to 10 pips below the swing low anchor point, not at the edge of the Fibonacci level itself. Placing the stop inside the zone is one of the most costly stop loss mistakes in Fibonacci trading. Normal price noise around a level will clip a stop that is positioned too close before the intended move begins.

Step 5: Set the Target

The first target is the 0% Fibonacci level, which is the original swing high for long trades or the original swing low for short trades. A second target can project beyond the original swing point using Fibonacci extension levels. Asia Forex Mentor's guide to Fibonacci extensions covers how to identify the next price target once the original swing is broken. For a trade entered at the 61.8% level with a stop beyond the swing low, a return to the original swing high typically produces a risk-to-reward ratio between 1:1.4 and 1:1.5. Because the 61.8% entry is a deep pullback, the reward to the swing high is naturally smaller, which is why Asia Forex Mentor uses Fibonacci extension targets beyond the swing high to push the ratio higher on trades that keep running.

A Practical Trade Example

Consider GBP/USD in an uptrend on the 4-hour chart. Price rallies from 1.2500 to 1.2700, a 200-pip move. The 61.8% retracement sits at 1.2576 (200 pips multiplied by 0.618 equals 123 pips, subtracted from the swing high of 1.2700). Price pulls back to 1.2576 and forms a bullish pin bar with a long lower wick. The entry is at the close of that pin bar. The stop goes 10 pips below the swing low at 1.2490. The first target is 1.2700. This structure creates a risk of approximately 86 pips and a potential reward of approximately 124 pips, a ratio of about 1:1.4 to the swing high. Once price breaks through the swing high, Fibonacci extension levels open up a larger target and a better ratio. That is where Fibonacci extension levels become the next tool in the sequence.

Common Fibonacci Retracement Mistakes to Avoid

Most Fibonacci failures trace back to a small set of repeated errors. Knowing what they are prevents the losses that come with learning them the hard way.

Using It in a Ranging Market

Fibonacci retracement is a trend-continuation tool. It requires a clear, directional move to measure. In a choppy, sideways market, there is no meaningful swing high and swing low to anchor the tool. Price drifts through Fibonacci levels with no reaction because no institutional momentum exists to reverse from them.

Anchoring to the Wrong Swing Point

Every Fibonacci level on the chart is only as accurate as the swing points used to draw it. Anchoring the tool to a minor candlestick wick instead of a clean structural pivot produces levels that hold no institutional significance. Use only the most prominent turning point visible on the chart. Cross-check the same swing on one timeframe higher to confirm it is structurally meaningful.

Entering at Every Level Mechanically

Not every Fibonacci level holds every time. Entering mechanically at the 23.6%, 38.2%, 50%, 61.8%, and 78.6% levels on every pullback turns a disciplined method into an undisciplined one. Focus on the 61.8% level first. Combine it with at least one additional confluence factor before committing to a position.

Ignoring Confluence

A Fibonacci level alone is not a trade. The highest-probability setups occur when the Fibonacci level aligns with at least one independent factor: prior horizontal support or resistance, a relevant moving average, a supply and demand zone, or a price action signal. Treating any Fibonacci level as a guaranteed bounce in isolation produces repeated losses over time.

Placing the Stop Too Close

Setting the stop loss inside the Fibonacci zone instead of beyond the anchor swing point guarantees that market noise removes the trade before the real move develops. The stop belongs beyond the full swing point. This is a non-negotiable rule. An 86-pip stop positioned correctly is far more effective than a 20-pip stop positioned at the wrong location. Also Read: Mastering Fibonacci Extension for Precise Trade Exits

Conclusion

Fibonacci retracement gives forex traders a systematic, repeatable way to identify high-probability entry points in trending markets. The tool takes minutes to learn. Applying it correctly, with the right swing points, at the right levels, with confirmed price action and a properly placed stop, takes more time but produces consistent results when the rules are followed. The method works because institutional traders worldwide use the same levels. That shared behavior creates order clusters that give Fibonacci zones real market weight. Retail traders who understand this stop fighting institutional order flow and start aligning with it. Asia Forex Mentor has refined this approach across more than 100,000 traders in 50+ countries. The consistent finding is that Fibonacci retracement works best as part of a complete framework. A level on a chart without a confirmation signal, a stop, and a defined target is not a trade. For traders who want to build a complete, rules-based system around these principles, Asia Forex Mentor's free training covers the full entry method step by step. Access the free training here.

Frequently Asked Questions

What is Fibonacci retracement in forex trading?

Fibonacci retracement is a technical tool that plots horizontal lines on a forex chart at key percentage levels derived from the Fibonacci number sequence. These levels (23.6%, 38.2%, 50%, 61.8%, and 78.6%) mark zones where price may pause or reverse during a pullback in a trending market. Institutional traders use these levels to plan limit entries and cluster orders. That collective behavior is why price so frequently reacts at Fibonacci zones.

How do you use Fibonacci retracement step by step?

First, confirm that a clear trend exists on the chart being analyzed. Identify the most recent significant swing low and swing high. In an uptrend, click the swing low and drag the Fibonacci tool up to the swing high. Then wait for price to pull back to the 38.2%, 50%, or 61.8% level and look for a confirming candlestick before entering in the direction of the original trend. Place the stop beyond the swing low and target the original swing high.

What is the best Fibonacci retracement level for forex trading?

The 61.8% retracement level is widely considered the most reliable level in forex. It comes directly from the golden ratio (0.618) and attracts the highest concentration of institutional order flow. Banks and algorithmic trading systems frequently cluster limit orders around this zone. When the 61.8% level aligns with prior horizontal structure or a supply and demand zone, the setup becomes even more compelling.

How do you identify a swing high and swing low for Fibonacci?

A swing high is a price peak with at least two lower highs on both sides of it. A swing low is a price trough with at least two higher lows on both sides of it. Look for clear, prominent turning points on the chart. The more visible the swing, the more traders globally see the same anchor point. Minor candlestick wicks or short-term noise spikes should never be used as Fibonacci anchor points.

Does Fibonacci retracement work in forex markets?

Yes, Fibonacci retracement works in forex because institutional traders, banks, and algorithmic systems collectively act on the same levels. When enough market participants place orders at the 61.8% or 38.2% zones, price responds to that combined order flow. The tool is most reliable in trending markets with clearly defined swing points. In choppy or ranging markets, Fibonacci levels are unreliable because no directional momentum exists to resume.

What is the difference between Fibonacci retracement and Fibonacci extension?

Fibonacci retracement measures pullback levels within a completed price move and helps identify entry points. Fibonacci extension projects where price may travel beyond the original swing high or low after the pullback ends and helps identify profit targets. Both tools use the same swing high and swing low anchor points but serve different purposes at different stages of a trade. Retracement finds the entry; extension finds the exit.

How should the stop loss be placed on a Fibonacci retracement trade?

The stop loss goes beyond the anchor swing point, not inside the Fibonacci zone. For a long trade at the 61.8% retracement in an uptrend, place the stop 5 to 10 pips below the swing low. Placing the stop directly at the Fibonacci level or inside the zone exposes the trade to being removed by normal market noise before the intended move begins. The stop belongs beyond the full structure of the swing.

Can Fibonacci retracement be used on any timeframe?

Fibonacci retracement works on all timeframes but produces the most reliable signals on the 4-hour and daily charts. Higher timeframe levels attract more institutional attention because more participants worldwide see and act on the same structure. On lower timeframes like the 5-minute or 15-minute chart, price noise around Fibonacci levels increases significantly. Many professional traders identify Fibonacci setups on the daily chart and use the 1-hour or 4-hour chart to time the entry with precision.
ezekiel chew asiaforexmentor

About Ezekiel Chew

Ezekiel Chew, founder and head of training at Asia Forex Mentor, is a renowned forex expert, frequently invited to speak at major industry events. Known for his deep market insights, Ezekiel is one of the top traders committed to supporting the trading community. Making six figures per trade, he also trains traders working in banks, fund management, and prop trading firms.

RELATED ARTICLES

How to Use Fibonacci Retracement Step by Step in 2026

4.0
Overall Trust Index

Written by:

Updated:

August 13, 2026
Most traders learn how to use Fibonacci retracement and immediately draw it wrong. This tool comes from a mathematical sequence first documented in 1202, and institutional traders use it daily to plan entries at precise price levels. The majority of retail traders miss the one placement rule that makes every level on the chart either meaningful or useless.

ABOUT THIS GUIDE

This guide covers Fibonacci retracement from the ground up for forex traders: what it is, how to draw it correctly, what each level means, which levels institutional traders act on, and how to build a complete trade entry with a stop and target around a single retracement level.
 

QUICK ANSWER

Fibonacci retracement divides a price move into key percentage levels (23.6%, 38.2%, 50%, 61.8%, and 78.6%) where price may pause or reverse during a pullback. To use it, identify a clear swing high and swing low, apply the tool from the swing low to the swing high in an uptrend, then wait for price action confirmation before entering in the direction of the trend.

What Fibonacci Retracement Is and Why Price Respects These Levels

Fibonacci retracement is a technical analysis tool that marks horizontal lines on a price chart at percentage levels derived from the Fibonacci number sequence. The sequence produces a set of ratios. The most important one approaches 0.618 and is known as the golden ratio. That figure appears across natural structures, architecture, and financial markets. Price respects Fibonacci levels not because of mathematics but because of behavior. Banks, hedge funds, and institutional trading desks have used Fibonacci retracement for decades as a core part of entry planning. When enough market participants act on the same level, price responds to the combined weight of their orders. Forex markets move in waves. Price trends in one direction, pulls back, and then resumes the original trend. Fibonacci retracement marks where those pullbacks are most likely to find order clusters. The levels are not predictions. They are zones where institutional participants have chosen to act, which gives those zones real weight. Asia Forex Mentor has trained more than 100,000 traders across 50+ countries in applying Fibonacci retracement within a rules-based entry framework. The consistent finding is that the levels hold because the market's biggest participants expect them to. Understanding the psychology behind each level makes the tool far more powerful than simply memorizing the percentages.

How to Draw Fibonacci Retracement Correctly

Getting the placement right is the single most important Fibonacci skill. A precise drawing produces reliable levels. An imprecise drawing produces noise that leads to losing trades. Most retail traders make one placement mistake that invalidates every level drawn afterward.

The Swing High and Swing Low

A swing high is a price peak with at least two lower highs on either side of it. A swing low is a price trough with at least two higher lows on either side of it. These two points are the anchor points for any Fibonacci retracement drawing. Understanding how to identify a valid swing high and swing low using market structure is the foundation of the method. Do not use every minor candlestick wick as a swing point. Look for clear, visible turning points on the chart. The more prominent the swing, the more traders worldwide see the same anchor. More eyes on the same anchor means more orders clustering at the same retracement levels, which makes those levels far more reliable.

How to Draw Fibonacci Retracement in an Uptrend

In an uptrend, the tool is applied from the bottom of the move to the top. Here are the steps to follow on any charting platform, including MetaTrader and TradingView: 1. Identify the most recent significant swing low. This is the starting point of the upward move being measured. 2. Identify the swing high that ended the rally. This is the top of the measured move. 3. Click the swing low first, then drag the Fibonacci tool up to the swing high. 4. Confirm the tool shows 0 at the swing low and 100 at the swing high. The tool then plots retracement levels downward from the swing high at 23.6%, 38.2%, 50%, 61.8%, and 78.6%. Price is expected to pull back toward one of these levels before continuing higher.

How to Draw Fibonacci Retracement in a Downtrend

In a downtrend, the anchor points swap and the tool is applied from the top of the move to the bottom. Follow these steps: 1. Identify the swing high. This is the starting point of the downward move being measured. 2. Identify the swing low. This is the bottom of the move. 3. Click the swing high first, then drag the Fibonacci tool down to the swing low. 4. Confirm the tool shows 0 at the swing high and 100 at the swing low. The retracement levels then mark potential areas where the downtrend resumes after a temporary bounce upward. Most charting platforms handle the math automatically once the anchor points are set correctly.

What Each Fibonacci Level Means

Each Fibonacci level marks a different depth of pullback and attracts a different degree of institutional attention. The table below summarizes all five levels before the most important ones are explained in detail. Here is what each retracement level signals in a trending forex market:
Level Pullback Depth What It Signals
23.6% Very shallow Extremely strong trend; buyers are aggressive and not waiting for a discount
38.2% Moderate Healthy trend with strong directional bias; common institutional entry zone
50% Mid-point Psychological decision zone; not a Fibonacci ratio but widely respected
61.8% Deep The golden ratio; highest concentration of institutional order flow
78.6% Very deep Trend technically intact but showing strain; higher-risk entry

The 38.2% Level

The 38.2% retracement is common in fast-moving, healthy trends. It represents a moderate pullback that still signals strong directional momentum. Professional traders in trending markets frequently use this level for entries when price is unlikely to offer a deeper discount. A confirming candlestick at 38.2% in a strong trend is one of the cleaner setups available.

The 50% Level

The 50% level does not come from the Fibonacci sequence, but markets treat it as a key zone anyway. It represents the exact midpoint of the measured move and carries significant psychological weight. When price reaches the midpoint of a major rally or decline, traders worldwide see a decision point. The 50% level often aligns with prior horizontal structure, which reinforces its significance further.

The 61.8% Level

The 61.8% level is the most important Fibonacci retracement level in forex. It is derived directly from the golden ratio (0.618) and attracts the highest concentration of institutional limit orders in trending markets. Banks and algorithmic trading systems frequently cluster entries at this zone. When the 61.8% level aligns with prior support, a key moving average, or a supply and demand zone, the result is a high-probability setup that Asia Forex Mentor's framework prioritizes above all other retracement entries.

The 78.6% Level

The 78.6% retracement marks a deep pullback that tests whether the original trend has enough momentum to resume. A move to this level raises the question of whether the trend is still valid. Entries at 78.6% carry more risk. If price continues past this level, it almost always completes a full retracement of the original move, which would invalidate the trend entirely.

The Levels Institutional Traders Watch Most

Not every Fibonacci level receives equal institutional attention. Understanding which levels attract the heaviest order flow helps traders focus on setups with real backing rather than monitoring every line on the chart. The 61.8% level is the most actively monitored by professional traders. Algorithmic systems at major banks and hedge funds frequently place limit buy orders in uptrends at this retracement and limit sell orders in downtrends at the equivalent zone. That combined order weight means price either reverses sharply from the 61.8% area or consolidates there before the trend resumes. Either way, the zone shows clear institutional activity. The 38.2% level comes second. In fast-moving trends, institutions that missed an initial breakout watch the first 38.2% pullback for a re-entry opportunity. This pattern appears consistently on EUR/USD, GBP/USD, and USD/JPY across the 4-hour and daily timeframes. Retailers who know this can enter alongside institutional flow rather than chasing price. The 50% level forces a clear decision. Price at the midpoint of a significant move pushes institutions to commit to one direction. Heavy buying or selling from that zone creates fast directional momentum, which is why the 50% level frequently produces clean, quick bounces. The 23.6% and 78.6% levels become most relevant through confluence. A 23.6% level that sits directly on prior resistance turned support carries more weight than either factor alone. Supply and demand zones are one of the strongest confluence tools to combine with Fibonacci retracement levels when building a complete entry thesis. The highest-probability Fibonacci setups occur when two or more independent technical factors agree on the same price zone. That confluence is what separates a level worth trading from a line the market drifts through.

How to Build a Trade Entry Around a Fibonacci Level

Reaching a Fibonacci level is not a trade signal on its own. Price action confirmation is required before any position is opened. Below is the complete process for turning a retracement level into a high-probability entry.

Step 1: Confirm the Trend

Before drawing any Fibonacci tool, confirm that a clear trend exists on the timeframe being traded. In an uptrend, price makes higher highs and higher lows. In a downtrend, price makes lower highs and lower lows. Using Fibonacci retracement in a ranging market produces misleading signals with no institutional backing. Reading trend direction with price action before applying any technical tool is the correct sequence.

Step 2: Draw the Tool and Set Alerts

After identifying the most recent significant swing high and swing low, draw the Fibonacci retracement tool on the chart. Set price alerts at the 38.2%, 50%, and 61.8% levels. This keeps the setup visible without requiring constant chart monitoring throughout the trading session.

Step 3: Wait for a Confirming Candlestick

When price reaches a key Fibonacci level, look for a candlestick signal before entering. The most reliable confirmation signals are: - A bullish engulfing candle at a retracement level in an uptrend - A pin bar with a long lower wick rejecting the level and closing bullish - A bearish engulfing candle at a retracement level in a downtrend - A pin bar with a long upper wick rejecting the level and closing bearish

Step 4: Enter and Place the Stop Loss

In an uptrend, enter at the close of the confirming bullish candle when price reacts from the Fibonacci level. The stop loss goes 5 to 10 pips below the swing low anchor point, not at the edge of the Fibonacci level itself. Placing the stop inside the zone is one of the most costly stop loss mistakes in Fibonacci trading. Normal price noise around a level will clip a stop that is positioned too close before the intended move begins.

Step 5: Set the Target

The first target is the 0% Fibonacci level, which is the original swing high for long trades or the original swing low for short trades. A second target can project beyond the original swing point using Fibonacci extension levels. Asia Forex Mentor's guide to Fibonacci extensions covers how to identify the next price target once the original swing is broken. For a trade entered at the 61.8% level with a stop beyond the swing low, a return to the original swing high typically produces a risk-to-reward ratio between 1:1.4 and 1:1.5. Because the 61.8% entry is a deep pullback, the reward to the swing high is naturally smaller, which is why Asia Forex Mentor uses Fibonacci extension targets beyond the swing high to push the ratio higher on trades that keep running.

A Practical Trade Example

Consider GBP/USD in an uptrend on the 4-hour chart. Price rallies from 1.2500 to 1.2700, a 200-pip move. The 61.8% retracement sits at 1.2576 (200 pips multiplied by 0.618 equals 123 pips, subtracted from the swing high of 1.2700). Price pulls back to 1.2576 and forms a bullish pin bar with a long lower wick. The entry is at the close of that pin bar. The stop goes 10 pips below the swing low at 1.2490. The first target is 1.2700. This structure creates a risk of approximately 86 pips and a potential reward of approximately 124 pips, a ratio of about 1:1.4 to the swing high. Once price breaks through the swing high, Fibonacci extension levels open up a larger target and a better ratio. That is where Fibonacci extension levels become the next tool in the sequence.

Common Fibonacci Retracement Mistakes to Avoid

Most Fibonacci failures trace back to a small set of repeated errors. Knowing what they are prevents the losses that come with learning them the hard way.

Using It in a Ranging Market

Fibonacci retracement is a trend-continuation tool. It requires a clear, directional move to measure. In a choppy, sideways market, there is no meaningful swing high and swing low to anchor the tool. Price drifts through Fibonacci levels with no reaction because no institutional momentum exists to reverse from them.

Anchoring to the Wrong Swing Point

Every Fibonacci level on the chart is only as accurate as the swing points used to draw it. Anchoring the tool to a minor candlestick wick instead of a clean structural pivot produces levels that hold no institutional significance. Use only the most prominent turning point visible on the chart. Cross-check the same swing on one timeframe higher to confirm it is structurally meaningful.

Entering at Every Level Mechanically

Not every Fibonacci level holds every time. Entering mechanically at the 23.6%, 38.2%, 50%, 61.8%, and 78.6% levels on every pullback turns a disciplined method into an undisciplined one. Focus on the 61.8% level first. Combine it with at least one additional confluence factor before committing to a position.

Ignoring Confluence

A Fibonacci level alone is not a trade. The highest-probability setups occur when the Fibonacci level aligns with at least one independent factor: prior horizontal support or resistance, a relevant moving average, a supply and demand zone, or a price action signal. Treating any Fibonacci level as a guaranteed bounce in isolation produces repeated losses over time.

Placing the Stop Too Close

Setting the stop loss inside the Fibonacci zone instead of beyond the anchor swing point guarantees that market noise removes the trade before the real move develops. The stop belongs beyond the full swing point. This is a non-negotiable rule. An 86-pip stop positioned correctly is far more effective than a 20-pip stop positioned at the wrong location. Also Read: Mastering Fibonacci Extension for Precise Trade Exits

Conclusion

Fibonacci retracement gives forex traders a systematic, repeatable way to identify high-probability entry points in trending markets. The tool takes minutes to learn. Applying it correctly, with the right swing points, at the right levels, with confirmed price action and a properly placed stop, takes more time but produces consistent results when the rules are followed. The method works because institutional traders worldwide use the same levels. That shared behavior creates order clusters that give Fibonacci zones real market weight. Retail traders who understand this stop fighting institutional order flow and start aligning with it. Asia Forex Mentor has refined this approach across more than 100,000 traders in 50+ countries. The consistent finding is that Fibonacci retracement works best as part of a complete framework. A level on a chart without a confirmation signal, a stop, and a defined target is not a trade. For traders who want to build a complete, rules-based system around these principles, Asia Forex Mentor's free training covers the full entry method step by step. Access the free training here.

Frequently Asked Questions

What is Fibonacci retracement in forex trading?

Fibonacci retracement is a technical tool that plots horizontal lines on a forex chart at key percentage levels derived from the Fibonacci number sequence. These levels (23.6%, 38.2%, 50%, 61.8%, and 78.6%) mark zones where price may pause or reverse during a pullback in a trending market. Institutional traders use these levels to plan limit entries and cluster orders. That collective behavior is why price so frequently reacts at Fibonacci zones.

How do you use Fibonacci retracement step by step?

First, confirm that a clear trend exists on the chart being analyzed. Identify the most recent significant swing low and swing high. In an uptrend, click the swing low and drag the Fibonacci tool up to the swing high. Then wait for price to pull back to the 38.2%, 50%, or 61.8% level and look for a confirming candlestick before entering in the direction of the original trend. Place the stop beyond the swing low and target the original swing high.

What is the best Fibonacci retracement level for forex trading?

The 61.8% retracement level is widely considered the most reliable level in forex. It comes directly from the golden ratio (0.618) and attracts the highest concentration of institutional order flow. Banks and algorithmic trading systems frequently cluster limit orders around this zone. When the 61.8% level aligns with prior horizontal structure or a supply and demand zone, the setup becomes even more compelling.

How do you identify a swing high and swing low for Fibonacci?

A swing high is a price peak with at least two lower highs on both sides of it. A swing low is a price trough with at least two higher lows on both sides of it. Look for clear, prominent turning points on the chart. The more visible the swing, the more traders globally see the same anchor point. Minor candlestick wicks or short-term noise spikes should never be used as Fibonacci anchor points.

Does Fibonacci retracement work in forex markets?

Yes, Fibonacci retracement works in forex because institutional traders, banks, and algorithmic systems collectively act on the same levels. When enough market participants place orders at the 61.8% or 38.2% zones, price responds to that combined order flow. The tool is most reliable in trending markets with clearly defined swing points. In choppy or ranging markets, Fibonacci levels are unreliable because no directional momentum exists to resume.

What is the difference between Fibonacci retracement and Fibonacci extension?

Fibonacci retracement measures pullback levels within a completed price move and helps identify entry points. Fibonacci extension projects where price may travel beyond the original swing high or low after the pullback ends and helps identify profit targets. Both tools use the same swing high and swing low anchor points but serve different purposes at different stages of a trade. Retracement finds the entry; extension finds the exit.

How should the stop loss be placed on a Fibonacci retracement trade?

The stop loss goes beyond the anchor swing point, not inside the Fibonacci zone. For a long trade at the 61.8% retracement in an uptrend, place the stop 5 to 10 pips below the swing low. Placing the stop directly at the Fibonacci level or inside the zone exposes the trade to being removed by normal market noise before the intended move begins. The stop belongs beyond the full structure of the swing.

Can Fibonacci retracement be used on any timeframe?

Fibonacci retracement works on all timeframes but produces the most reliable signals on the 4-hour and daily charts. Higher timeframe levels attract more institutional attention because more participants worldwide see and act on the same structure. On lower timeframes like the 5-minute or 15-minute chart, price noise around Fibonacci levels increases significantly. Many professional traders identify Fibonacci setups on the daily chart and use the 1-hour or 4-hour chart to time the entry with precision.

ezekiel chew asiaforexmentor

About Ezekiel Chew

Ezekiel Chew, founder and head of training at Asia Forex Mentor, is a renowned forex expert, frequently invited to speak at major industry events. Known for his deep market insights, Ezekiel is one of the top traders committed to supporting the trading community. Making six figures per trade, he also trains traders working in banks, fund management, and prop trading firms.

RELATED ARTICLES

Join the Live Event
Get Your Free Ticket Now

I consent to receiving emails and/or text message reminders for this event.

REGISTER FOR THE MASTERCLASS!