
The world of candlestick patterns is vast and varied, providing traders with essential insights into market movements. One such pattern that can offer significant trading opportunities is the Bullish Belt Hold Pattern. This article will delve into the details of this pattern, including how to spot and trade it effectively.
Candlestick patterns are crucial tools in technical analysis, helping traders identify potential trend reversals and make informed trading decisions. The Bullish Belt Hold Pattern is a strong single candlestick pattern that can indicate a bullish reversal. Understanding this pattern, along with its characteristics and trading strategies, can enhance your ability to navigate the financial markets.
What is the Bullish Belt Hold Pattern?
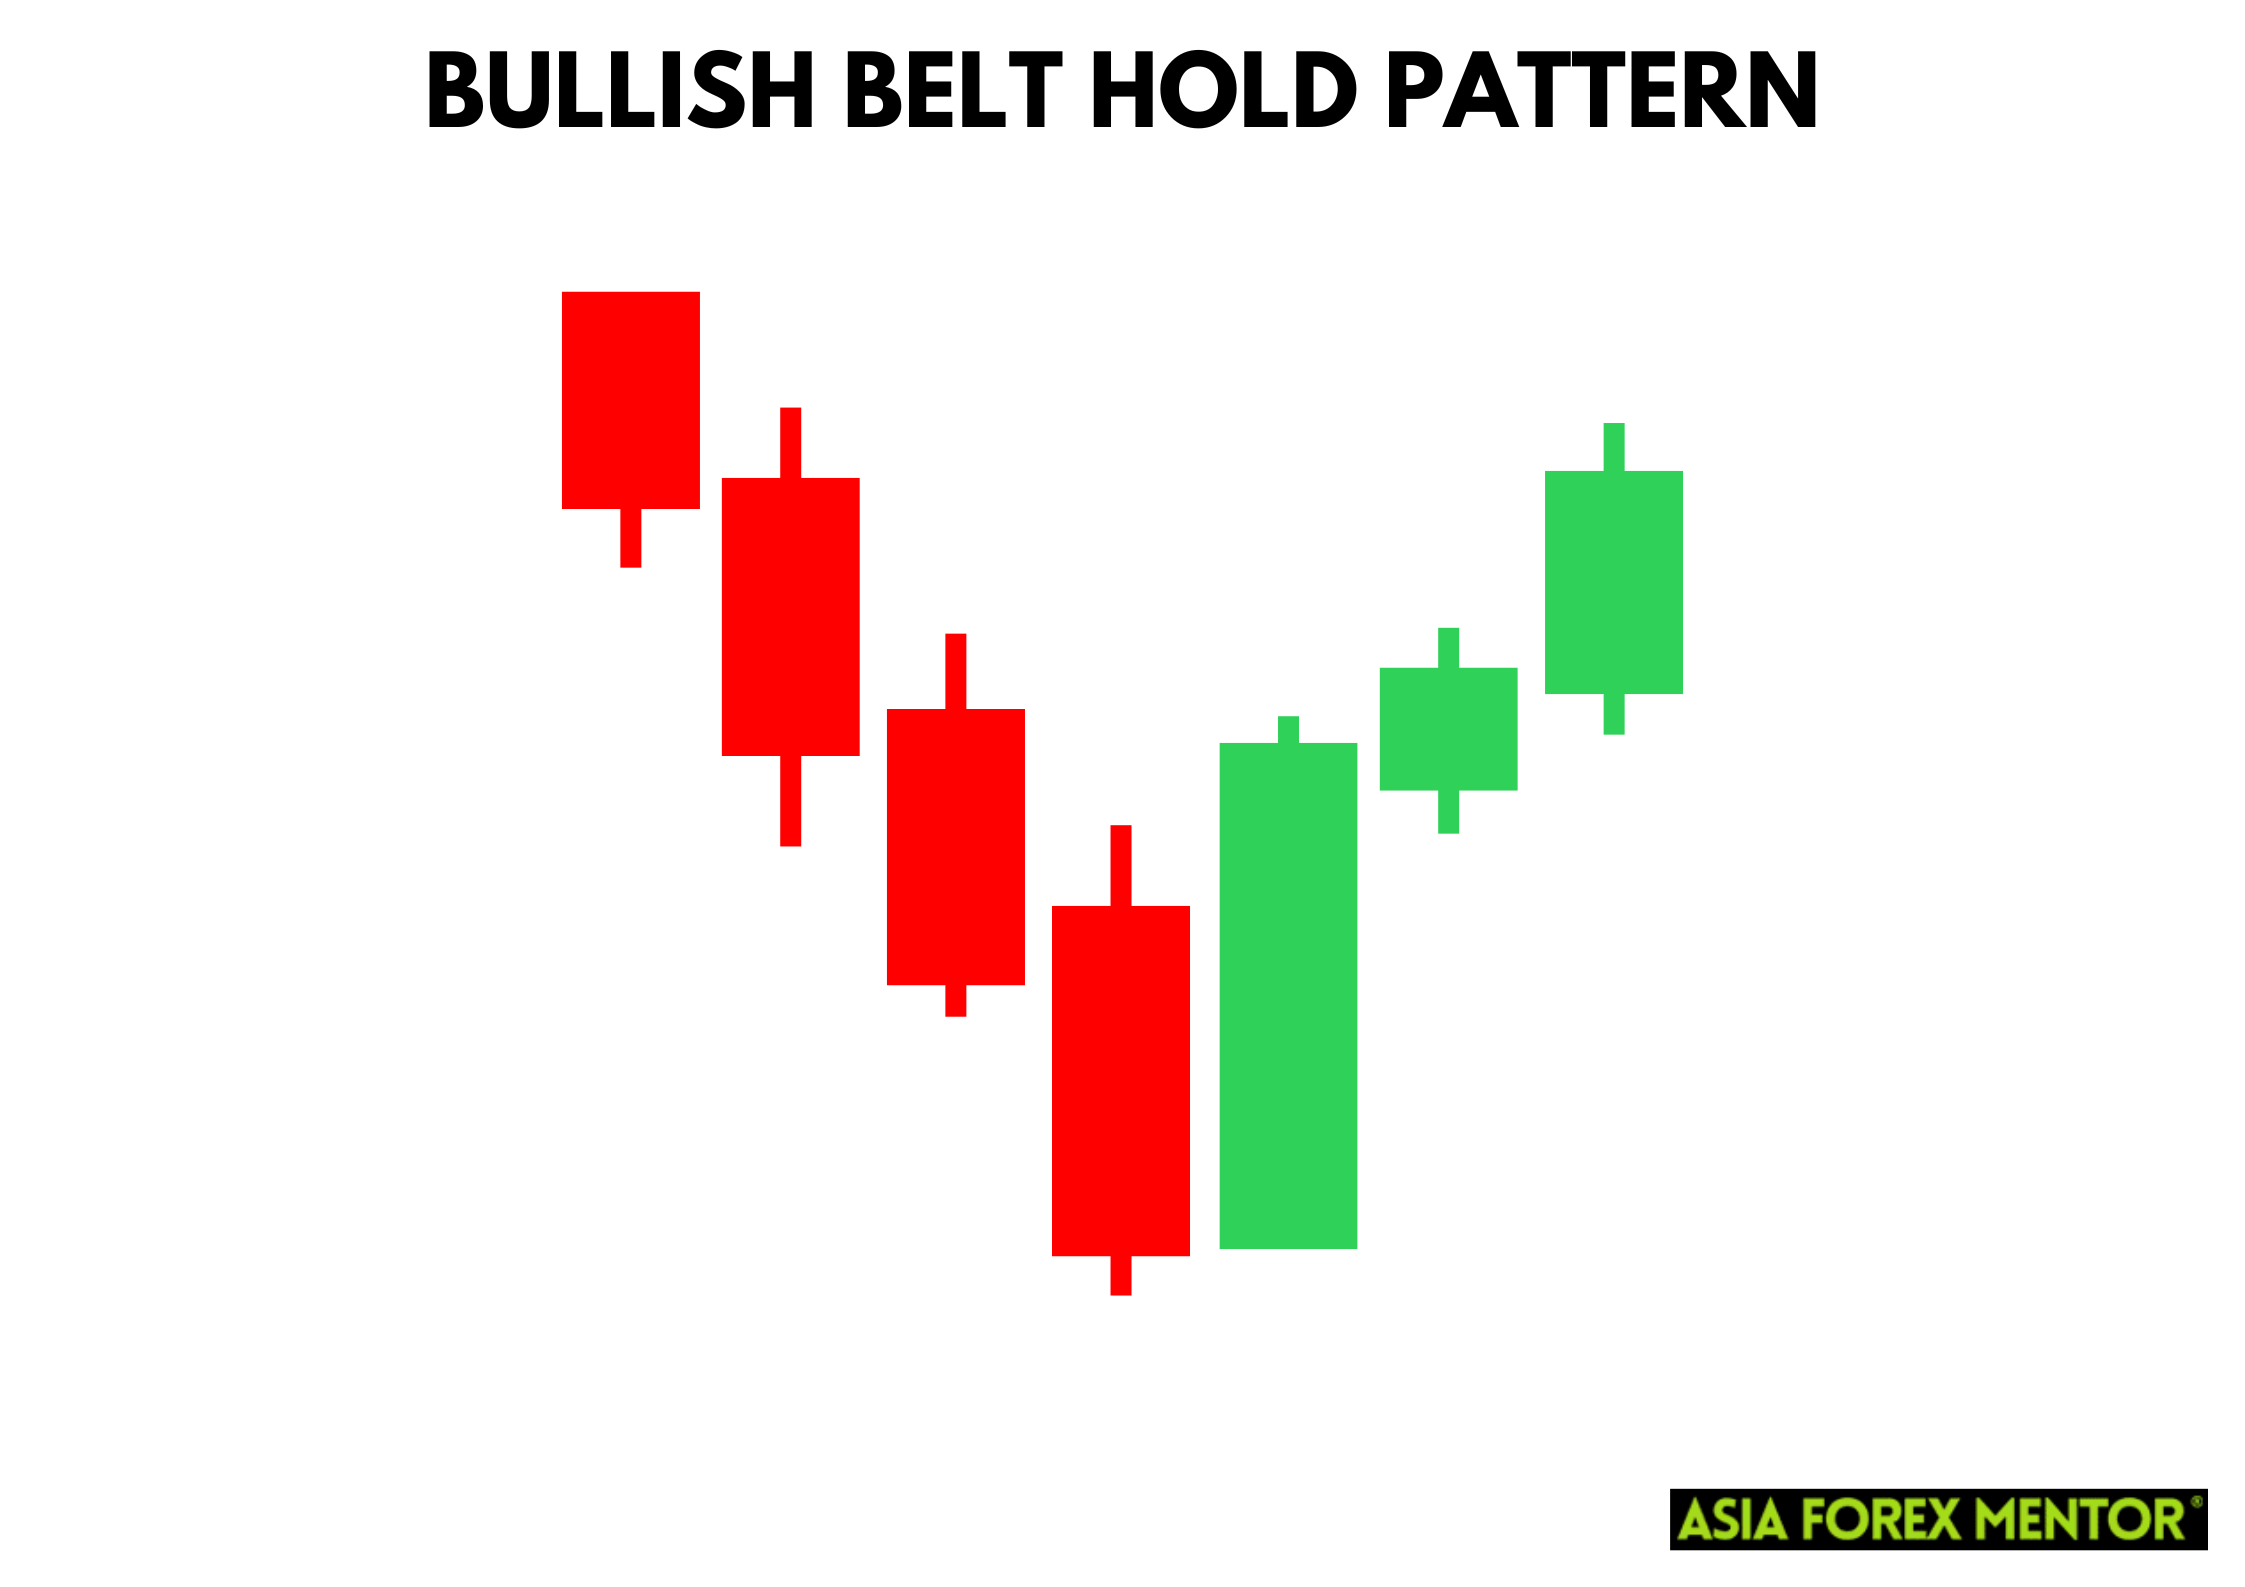
The Bullish Belt Hold Pattern is a type of candlestick pattern that signals a potential bullish reversal. It typically appears after a downtrend, indicating that buyers are starting to gain control. This pattern consists of a long white candlestick with little to no upper shadow, opening at or near the low of the day and closing at or near the high. The absence of a significant upper shadow highlights the strength of the bulls in pushing the price higher throughout the trading session.
Also Read: Mastering Japanese Candlestick Patterns
How to Spot the Bullish Belt Hold Pattern
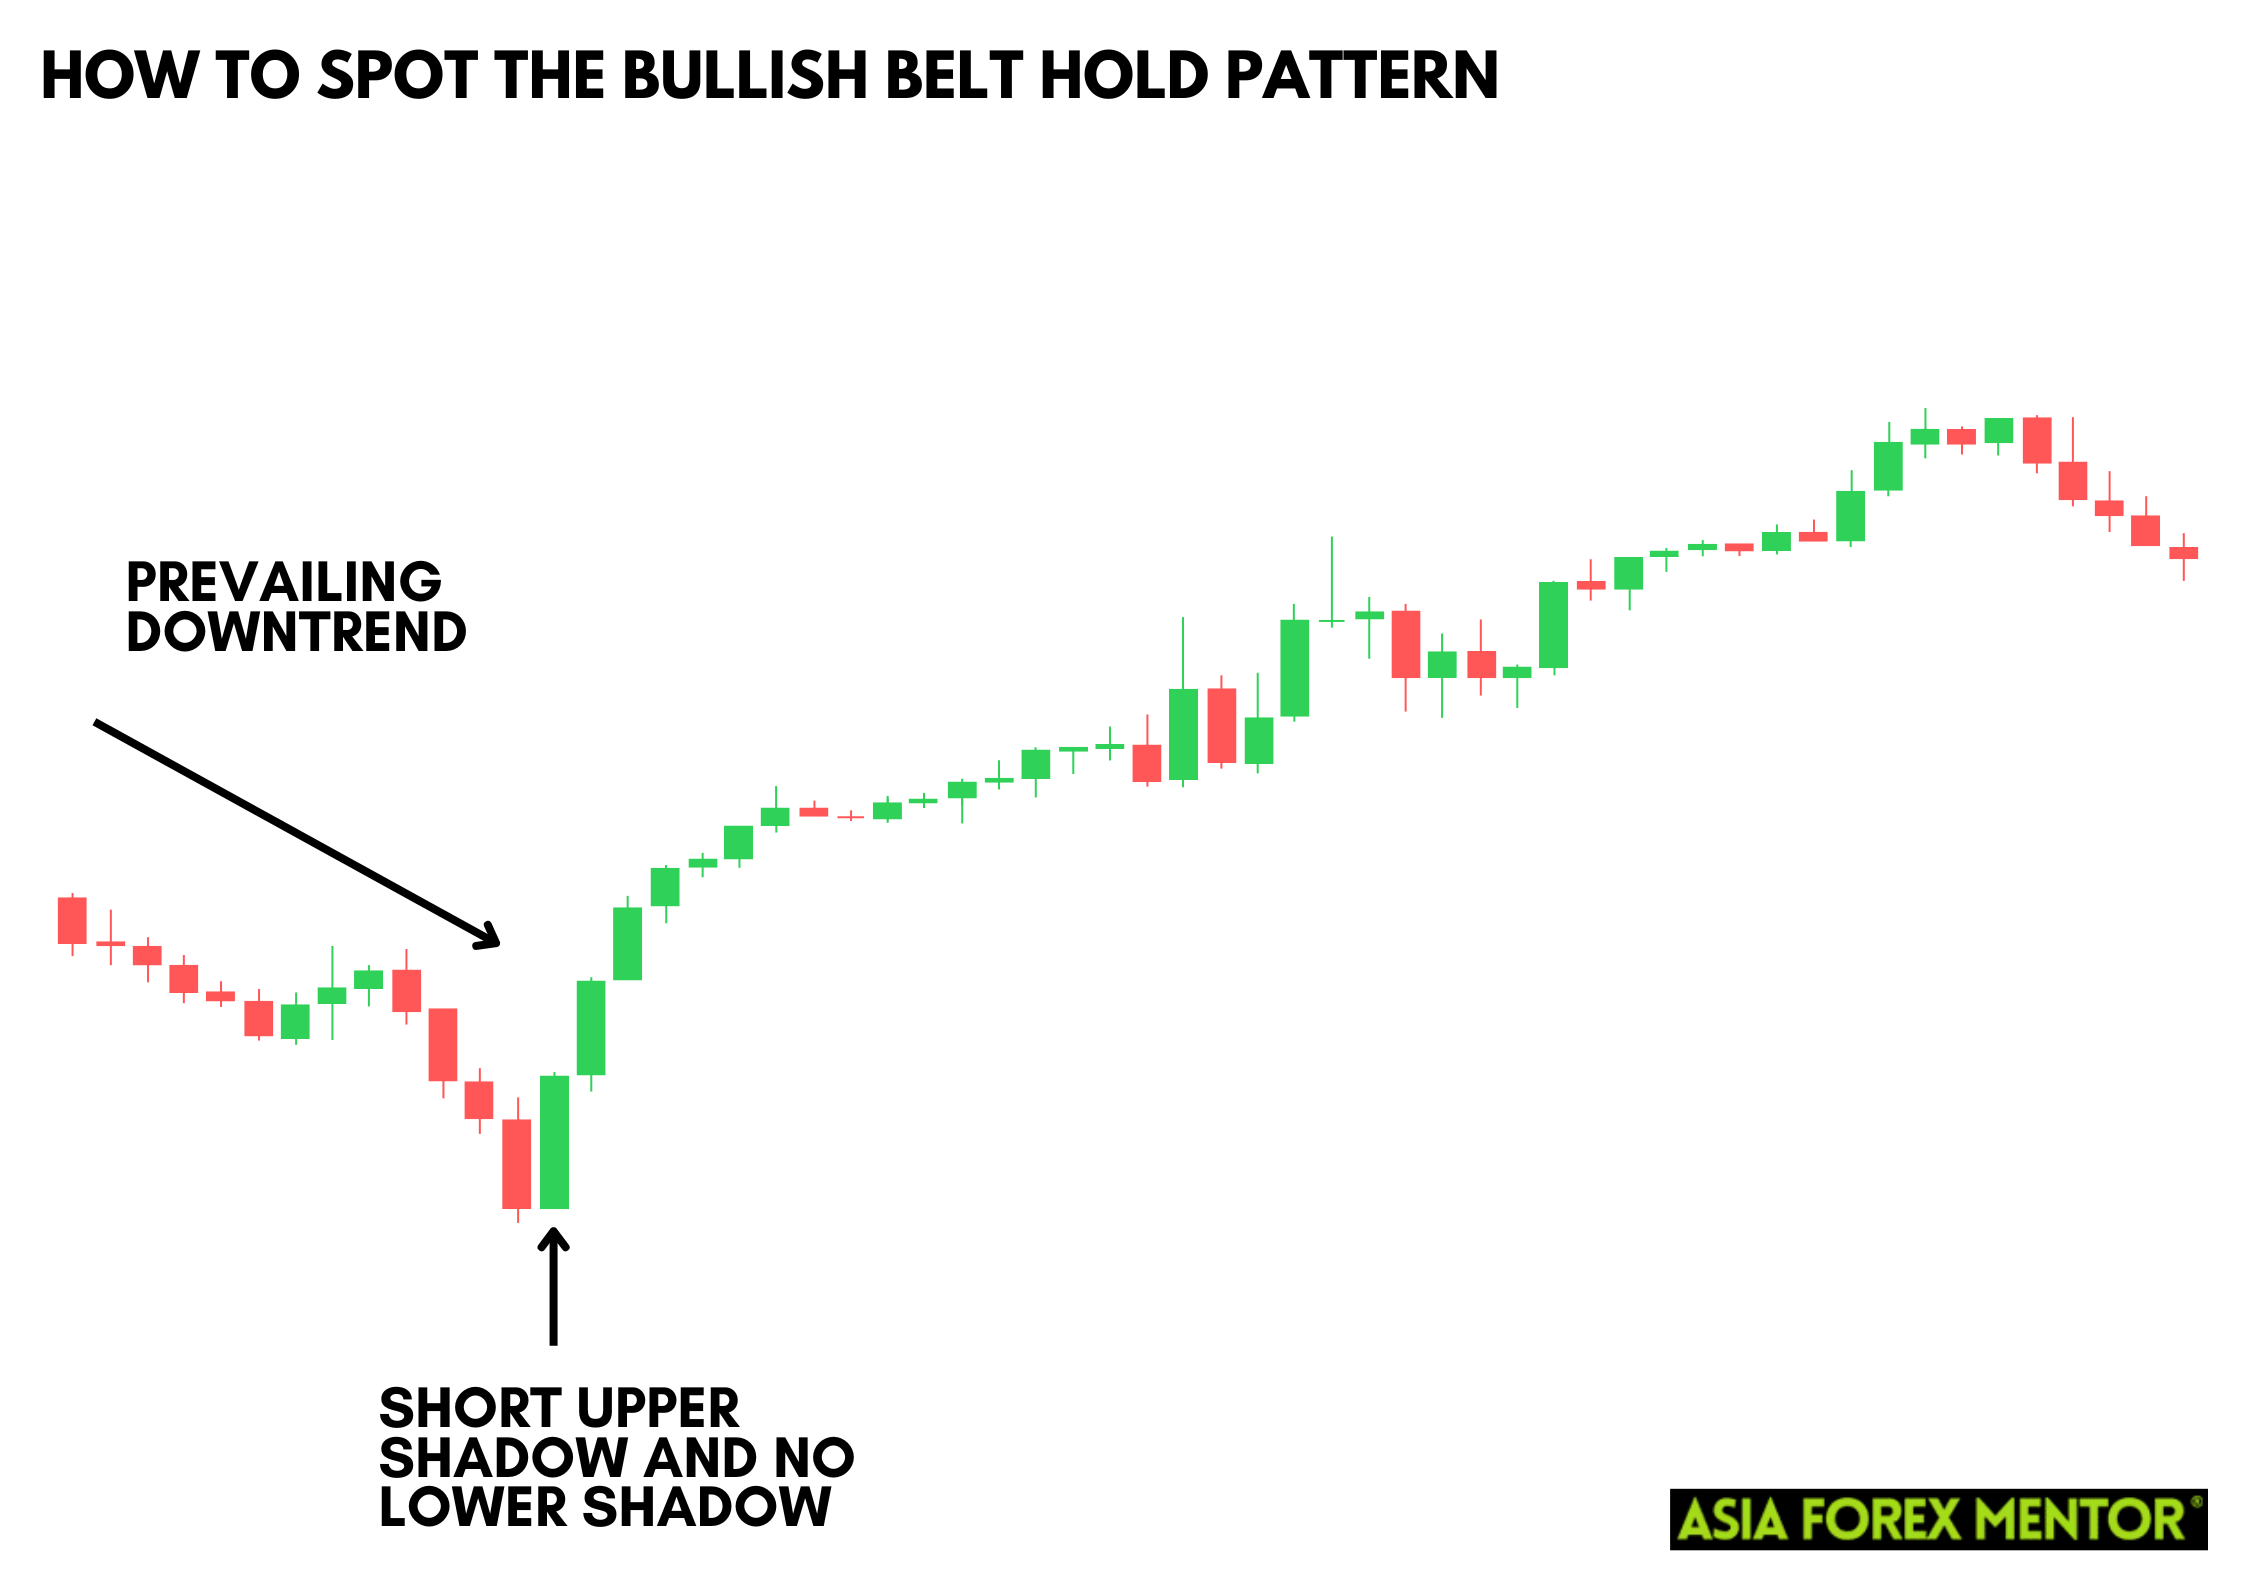
To identify a Bullish Belt Hold Pattern, follow these key steps:
- Look for a prevailing downtrend.
- Identify a long white candlestick with a short upper shadow and no lower shadow.
- Ensure that the candlestick opens near the lowest price of the day and closes near the highest price.
Spotting this pattern requires careful analysis of price charts and an understanding of previous candlestick formations.
How to Trade the Bullish Belt Hold Pattern
Entry Point
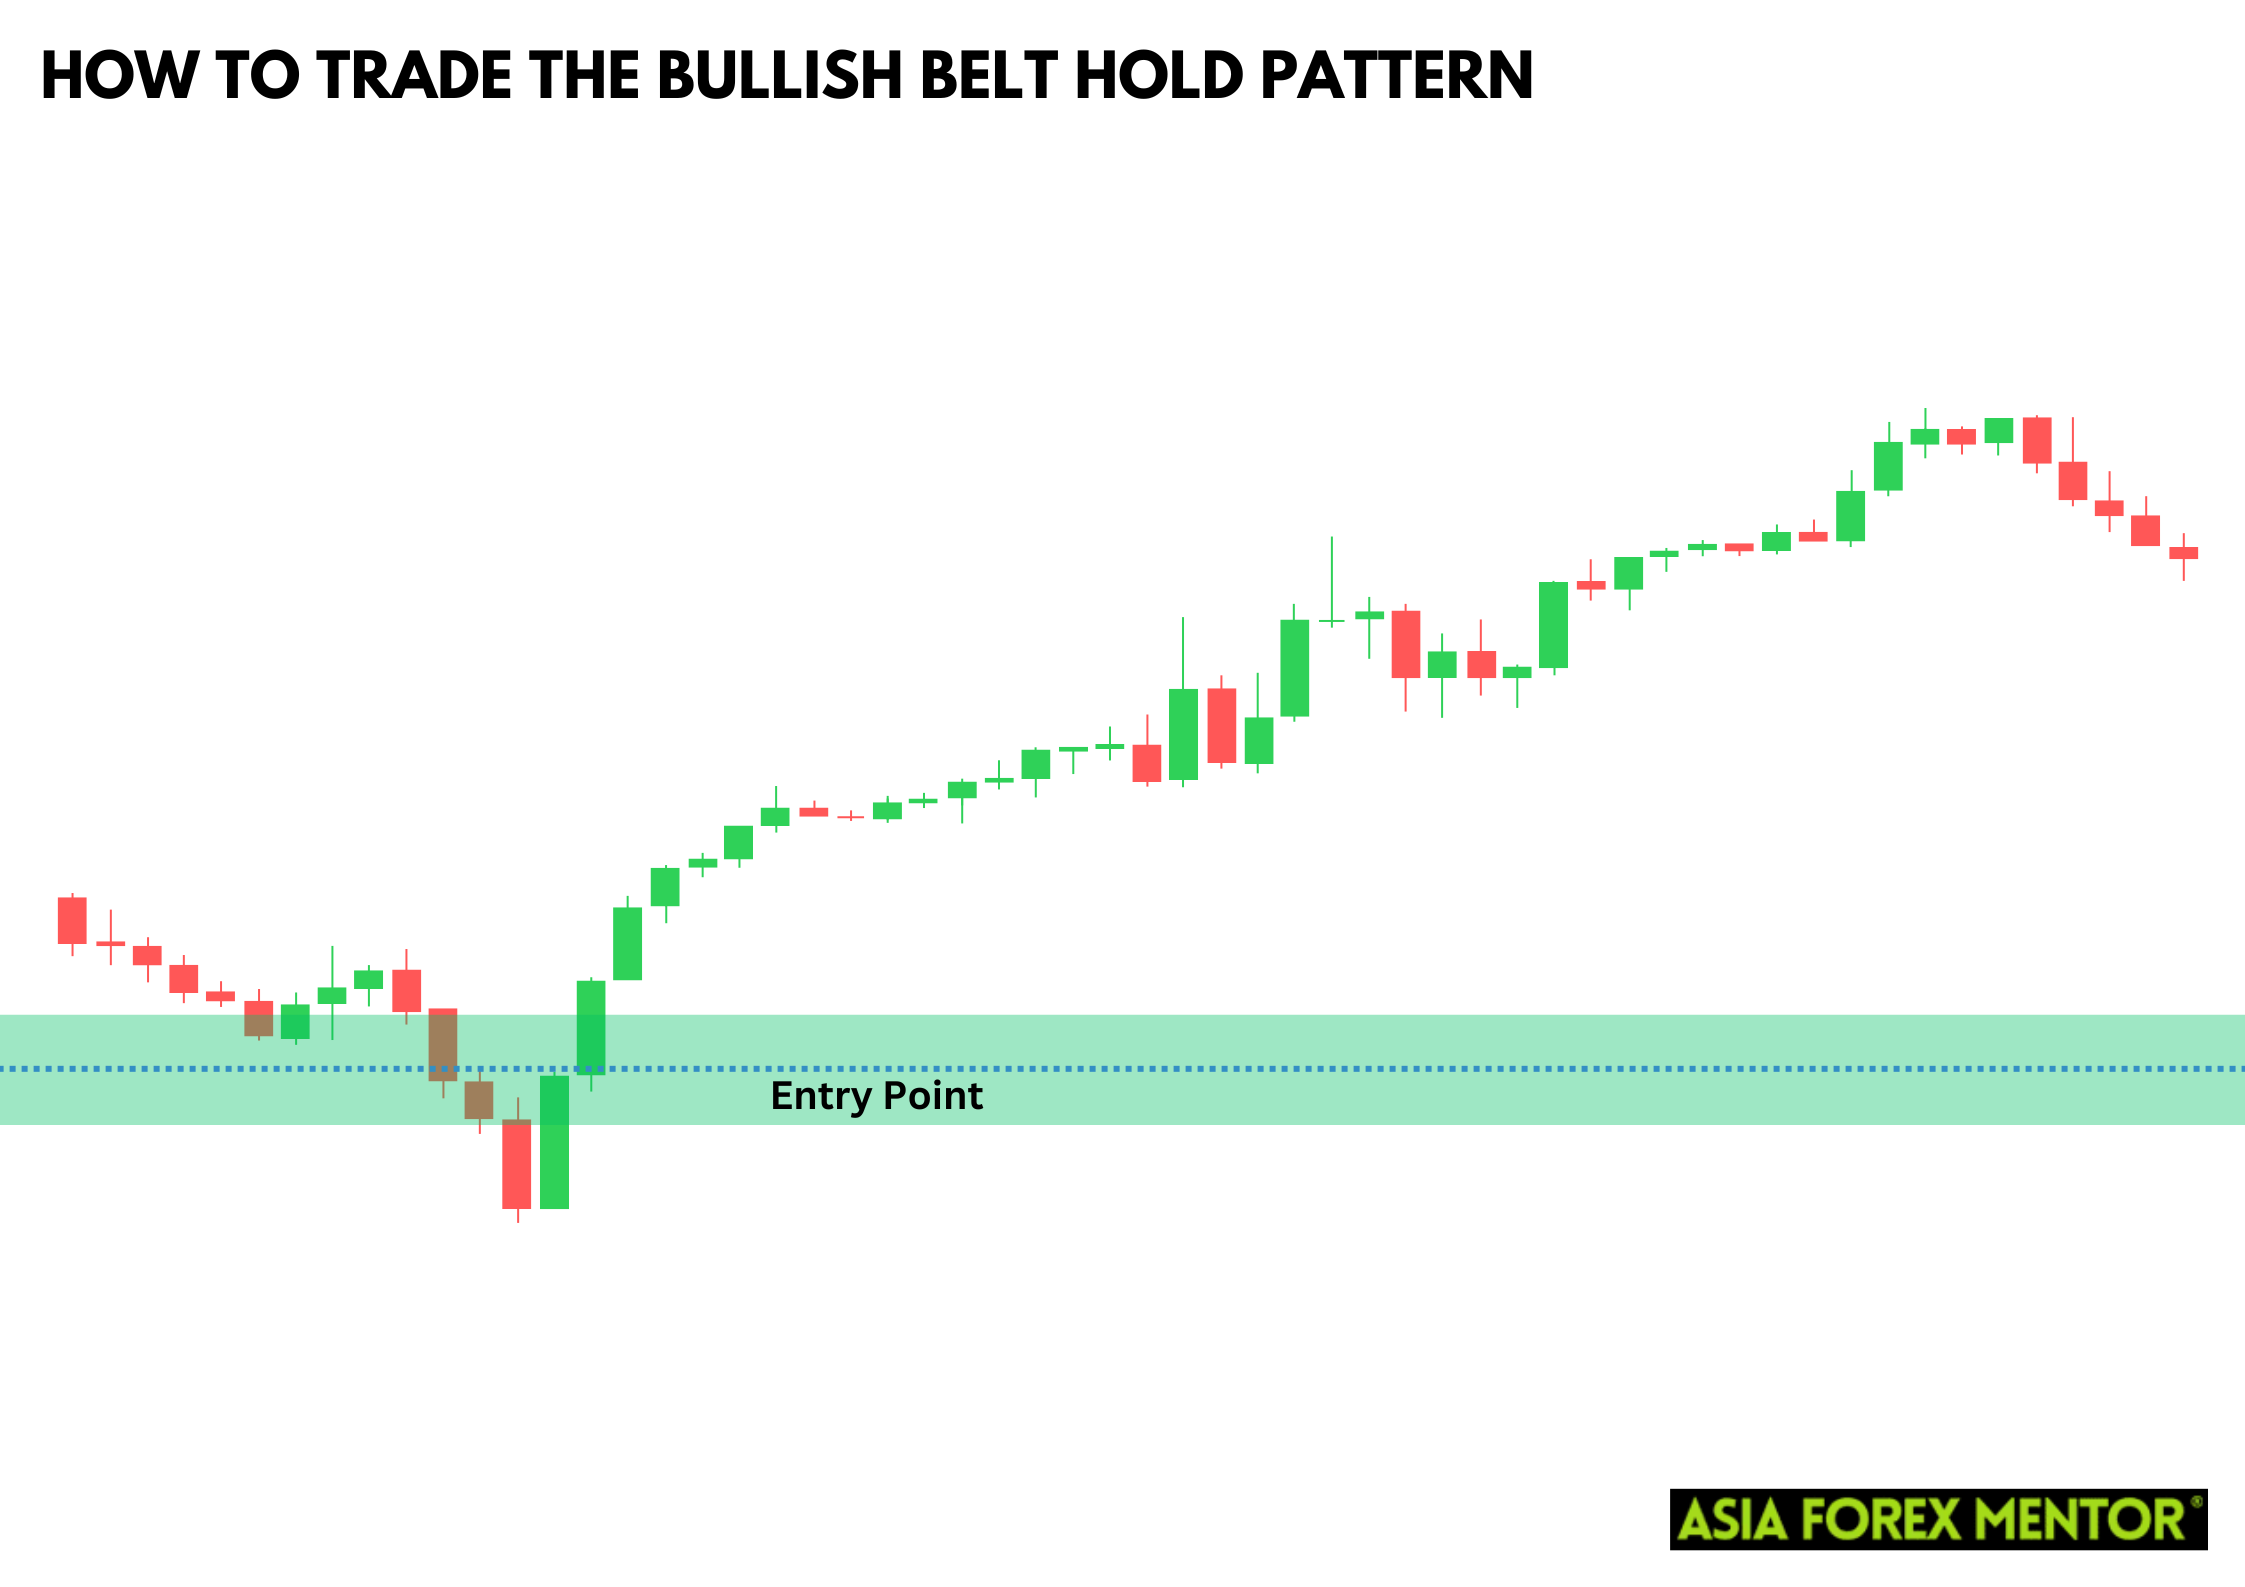
The entry point for trading the Bullish Belt Hold Pattern is typically just above the candle's closing price. This ensures that the upward momentum continues and reduces the risk of false signals.
Stop Loss
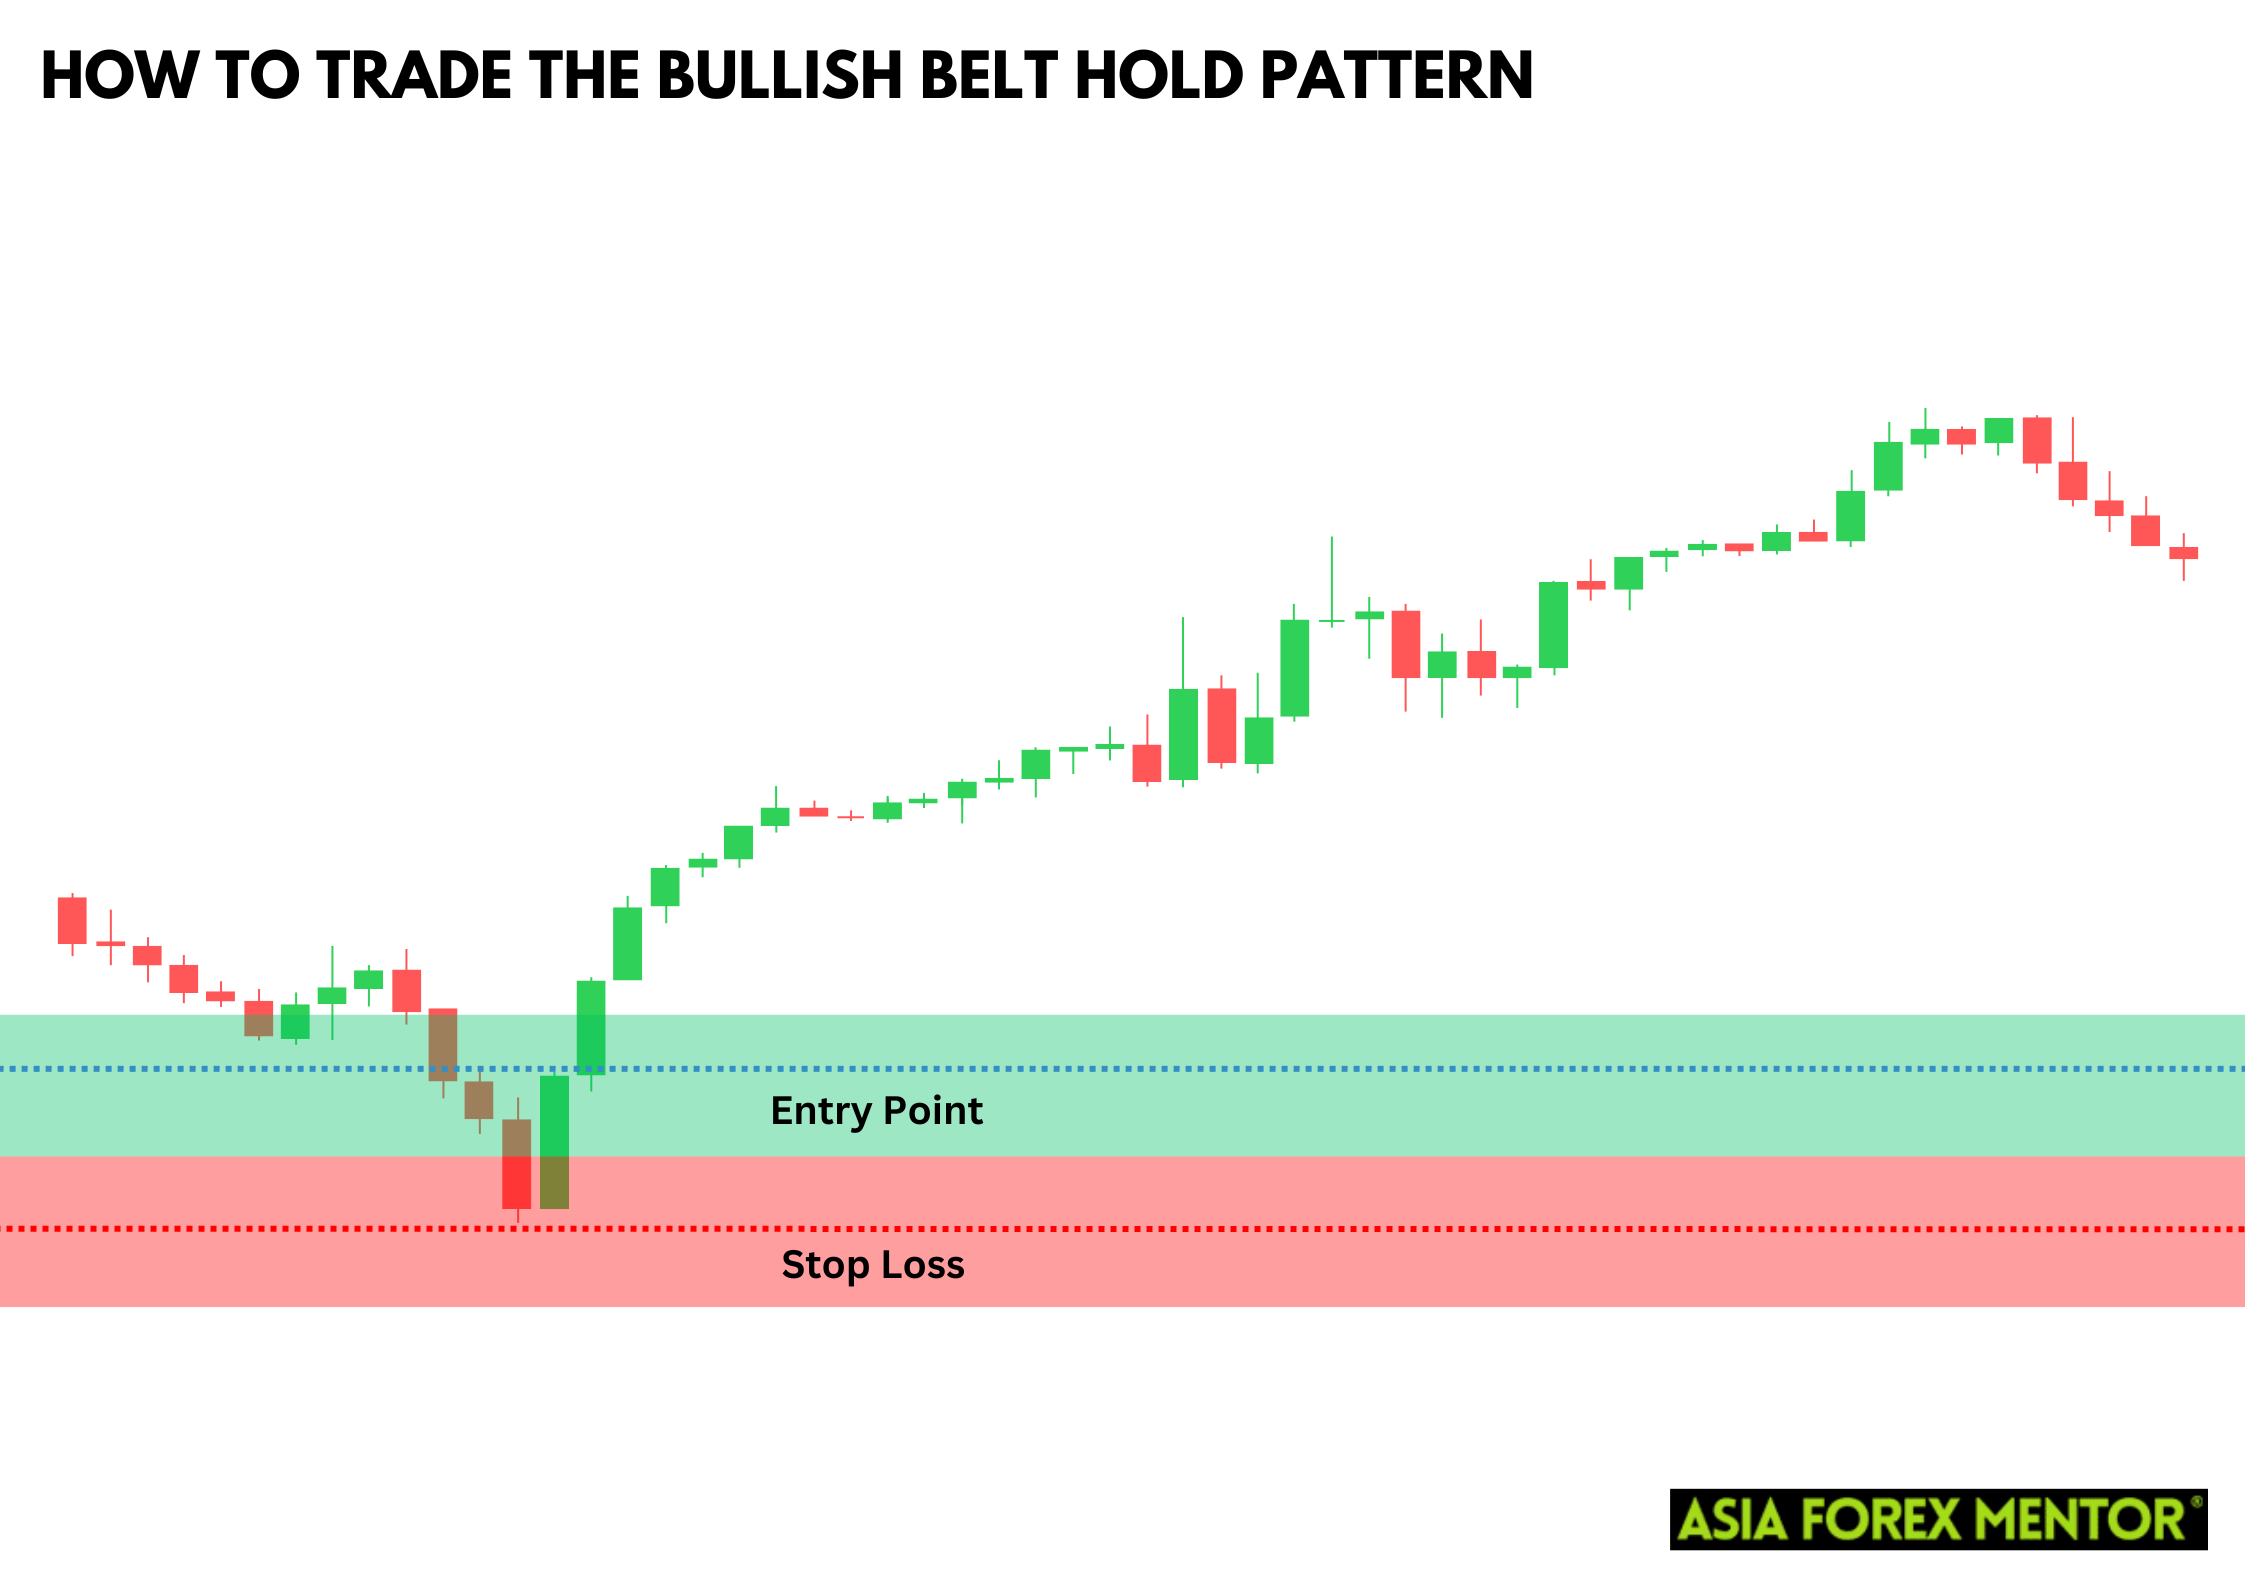
Place a stop loss just below the candle's opening price. This level acts as a safeguard against unexpected market reversals and limits potential losses.
Profit Target
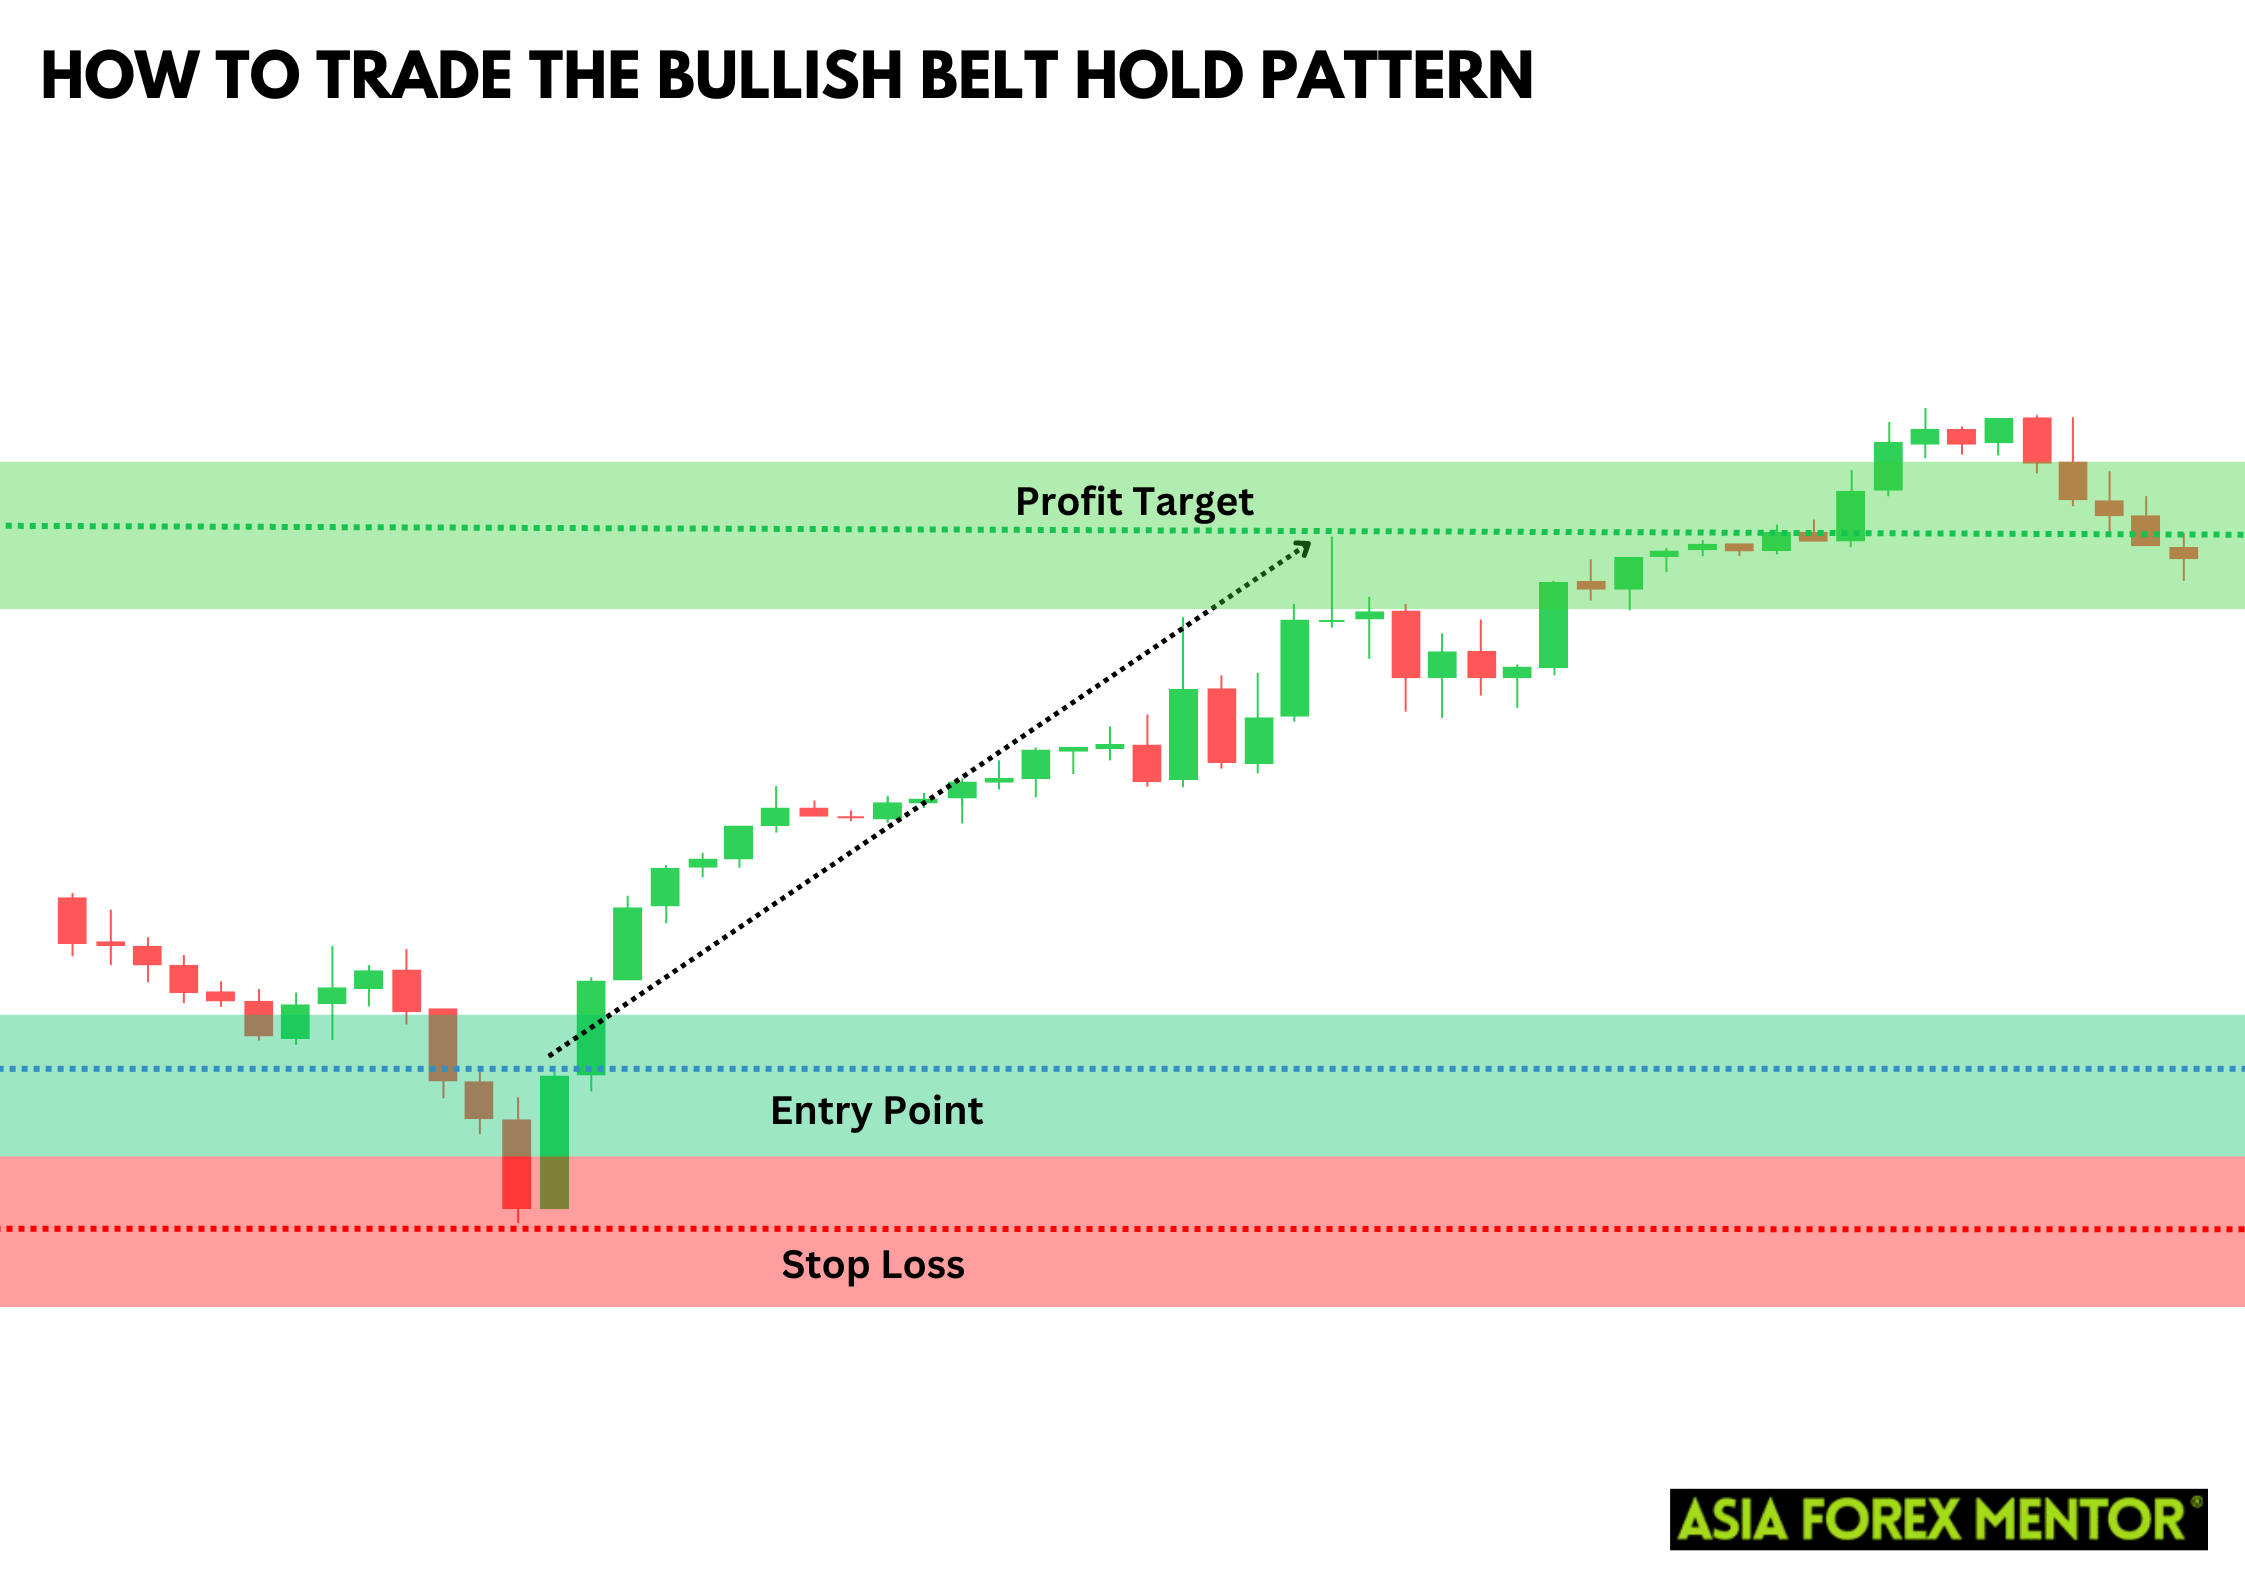
Set your profit target based on the next significant resistance level or a predefined risk-reward ratio. Monitoring the price action and adjusting your targets based on market conditions can also be beneficial.
Pros and Cons of the Bullish Belt Hold Pattern
Pros
- The pattern is easy to identify and interpret.
- It often indicates a strong bullish reversal.
- Requires analysis of only one candlestick for a signal.
Cons
- Like all patterns, it can produce false signals, especially in highly volatile markets.
- It often requires additional confirmation from other indicators or patterns.
Indicators to Use to Confirm the Pattern
To increase the reliability of the Bullish Belt Hold Pattern, use additional technical indicators such as:
Moving Averages
Moving averages are essential tools in confirming the direction of the trend when trading the Bullish Belt Hold Pattern. By smoothing out price data, moving averages help identify the overall trend direction and provide dynamic support and resistance levels. For instance, a bullish belt hold forming above a rising 50-day moving average can signal a stronger reversal potential, as the price is aligned with the long-term trend. Traders often look for a belt hold pattern that closes above significant moving averages to confirm the bullish sentiment, thus enhancing the pattern's credibility and reducing the chances of false signals.
Support and Resistance Levels
Support and resistance levels are critical in interpreting the Bullish Belt Hold Pattern. These levels indicate where the price has historically had difficulty moving past, either on the upside (resistance) or the downside (support). When a bullish belt hold pattern forms near a key support level, it suggests a higher likelihood of a trend reversal, as the pattern reinforces the strength of the support. Traders should look for the pattern to form near these levels and confirm with subsequent price action that the support is holding, thereby providing a more reliable entry point for a long position.
Relative Strength Index (RSI)
The Relative Strength Index (RSI) is a momentum oscillator that measures the speed and change of price movements. It helps in identifying overbought or oversold conditions in the market. When the Bullish Belt Hold Pattern appears while the RSI is in the oversold territory, it strengthens the case for a potential bullish reversal. The RSI provides an additional layer of confirmation by indicating that the selling pressure is exhausted and a reversal might be imminent. Combining the RSI with the bullish belt hold pattern can enhance the reliability of the signal and help traders avoid entering trades based on false patterns.
Conclusion
The Bullish Belt Hold Pattern is a valuable tool in a trader's arsenal, signaling potential bullish reversals in the market. By understanding its formation, identifying it on price charts, and using additional confirmation indicators, traders can make more informed and effective trading decisions.
Also Read: How to Trade the Flat Top Pattern
To further enhance your understanding of candlestick patterns, we invite you to watch our YouTube video on the Bearish Marubozu. This video delves into the key characteristics, identification techniques, and effective trading strategies for the Bearish Marubozu, a pattern that signals strong bearish sentiment, similar in importance to the Bullish Belt Hold.
FAQs
What is the difference between a Bullish Belt Hold Pattern and a Bearish Belt Hold Pattern?
The Bullish Belt Hold Pattern signals a potential bullish reversal after a downtrend, characterized by a long white candlestick with no lower shadow. Conversely, the Bearish Belt Hold Pattern signals a potential bearish reversal after an uptrend, characterized by a long black candlestick with no upper shadow.
Can the Bullish Belt Hold Pattern appear in various timeframes?
Yes, the Bullish Belt Hold Pattern can appear in various timeframes, from intraday charts to daily, weekly, or monthly charts. However, the reliability of the pattern tends to increase with higher timeframes.
How can I avoid false signals when trading the Bullish Belt Hold Pattern?
To avoid false signals, use additional confirmation indicators like moving averages, support and resistance levels, and the Relative Strength Index (RSI). Also, ensure proper risk management by setting stop-loss orders and maintaining a favorable risk-reward ratio.


