
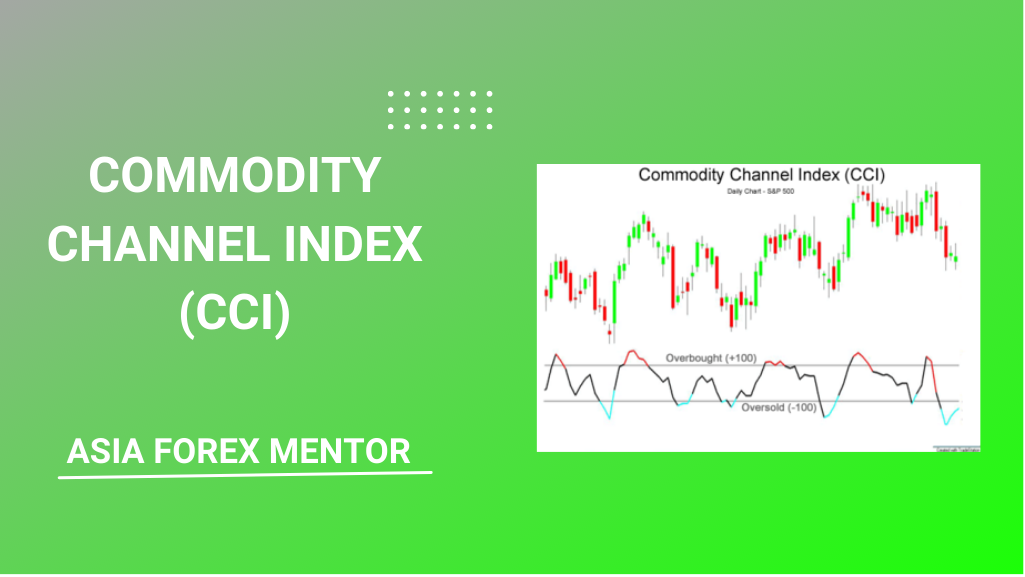
Donald Lambert introduced the CCI – Commodity channel Index in 1980. It is a versatile indicator reflecting the price momentum. The indicator can identify the possible start of a new trend and identify any weakness in the current trend and provides an exit signal. The indicator also helps the forex trader to identify any divergences and convergences and provides buy and sell signals as a leading indicator.
Contents
- Commodity Channel Index – Indicator Settings
- Trading Setup
- Technical Analysis – CCI Trading Overbought And Oversold Levels
- Trading Divergence and Convergence With Commodity Channel Index CCI
- CCI – Multiple Time Frame Trading Strategy
- Utilizing Tools For Additional Confirmation
- Conclusion
The indicator CCI stands for commodity channel index but can be used not only for commodities but also to trade the stock market, commodities, forex, and all financial trading instrument. The main purpose of the indicator is to determine if the price has reached overbought or oversold levels. But the indicator is capable of providing entry, exit signals and acts as a leading indicator. The indicator works well in all chart time frames including the intraday and daily, weekly and monthly price charts. So, it is well suited for multi-timeframe trading strategies. Traders with a top-down trading approach will benefit from using this technical indicator.
The indicator can be used by new and advanced forex traders. New forex traders can apply the indicator to identify the entry and exit points easily, while advanced forex traders can apply complex trading strategies.
Also Read: How To Trade Futures
Commodity Channel Index – Indicator Settings
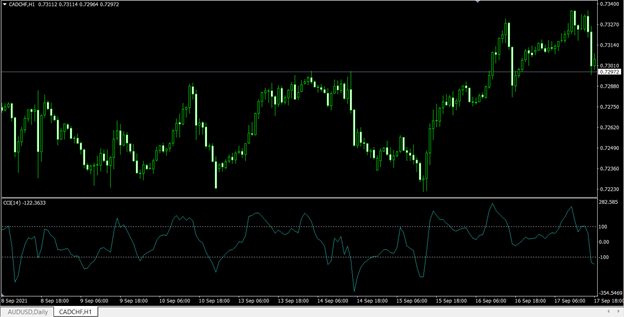
The CCI indicator takes the current price and the average prices and measures the difference between them. The result is an unbounded oscillator with no upper or lower limits. The indicator settings provide input values of the period to be measured. The period refers to the period to calculate the average prices. Normally a value of 14 produces the best results, a higher number results in smother values while a lower number produces frequent signals.
The indicator uses typical prices for calculations, however other input options are not used by technical traders. The indicator provides an option to set a fixed minimum or maximum limit, however, most traders avoid them and allow the indicator to be unbounded. The indicator comes with default levels of +100 and -100 marked. However, it is recommended to add a 0 level for reference.
Also Read: Power Hour Stocks
Trading Setup
The CCI – Commodity channel index helps the trader to identify the beginning of a new trend. If CCI moves from 0 levels to the upside and goes beyond +100 it indicates the beginning of a bullish price trend. So, traders should place a BUY position with a stop loss below the swing low. If the indicator reverses and moves below the +100 trades should look for an exit. Since the indicator is an oscillator traders should wait for the prices to repeat the process and BUY again cyclically.
Similarly, if the indicator values move from new zero or above and cross the -100 level to the downside it indicates a bearish signal. Technical traders should enter a SELL position with a stop loss above the previous swing high. For best trading results traders can enter during pullbacks to maximize the profits. For example, if the indicator values move above +100 and indicate a bullish signal, the trade should wait for a pull in price and enter during this pullback.
Traders tend to enter the market once the indicator values move above the Zero line. Though this trading strategy may produce results, it may produce many false starts. The best method is to wait for the price to cross the +100 level or -100 level and trade confirmed signals through the entry may be a bit delayed it will result in a trade only when a trend is established.
Technical Analysis – CCI Trading Overbought And Oversold Levels
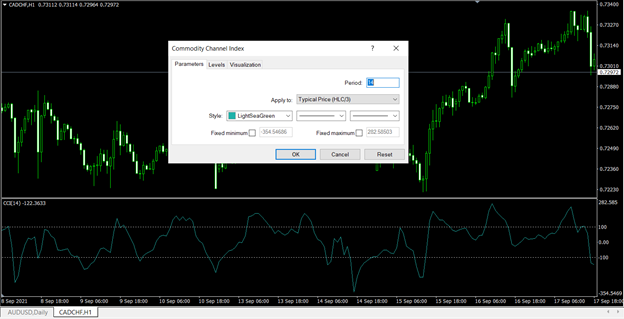
The primary method of CCI – commodity channel index indicator is to identify the oversold and overbought market conditions. The overbought or oversold conditions provide the best trading environment and help the technical traders to identify potential reversal zones. Once the reversal zone is identified then the next task is to identify the best entry point.
The CCI indicator is an unbounded indicator with no upper and lower limits, hence it may not be possible to look at the indicator and identify the oversold and overbought conditions. A trading instrument may reverse its direction at +150 while the other may move ahead till +250 and one another may reverse from +350 levels.
Traders should use previous historical data to identify the potential oversold and overbought levels. Suppose if an instrument reversed at +250 in the past it may act as a reference point but it would require additional confirmation by using price action.
The best method is to wait until the price moves from extreme values and falls below 0 or the extreme 100 levels. When CCI values reverse from +200 levels and moves below +100 it indicates a bearish signal. So, traders can enter a SELL position with a stop loss above the previous swing high. Similarly, if CCI values reverse from -250 and cross the -100 to the upward direction it indicates a bullish signal. Traders should consider this buy signal and place a stop loss below the previous swing low.
Also Read: Scalping Forex
Trading Divergence and Convergence With Commodity Channel Index CCI
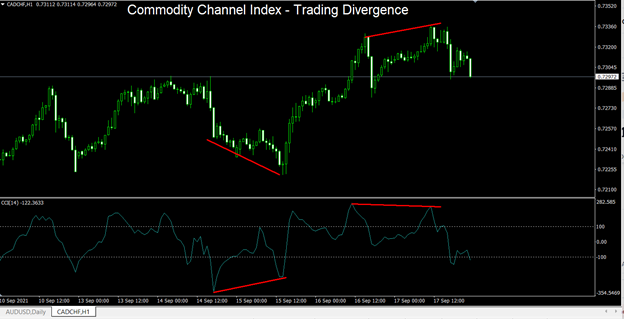
The CCI – Commodity channel index indicator acts as a leading indicator as it detects and displays the convergence and divergence. The above chart shows the price-making series of lower lows, while the CCI makes higher lows. The indicator thus shows the lack of downward momentum and the presence of upward pressure indicating an impending upward move.
Further, in the second instance, the price makes a series of higher highs, while the indicator makes lower lows. This provides the essential information of underlying weakness in price. Traders can consider this as a SELL signal and wait for confirmation using price action and enter the trade.
CCI Multiple Time Frame Trading Strategy
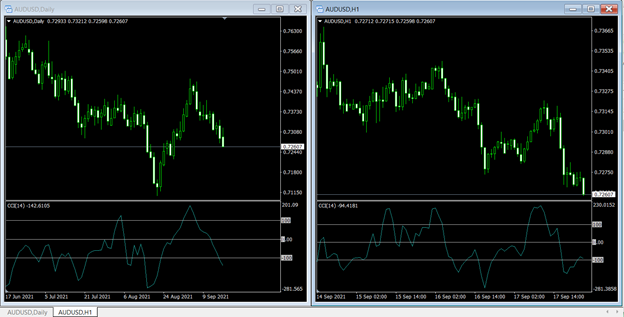
The CCI – commodity channel can be applied for a top-down trading approach and is truly and multi-timeframe technical indicator. The trend identified in higher time frames tends to stay longer and is stable. However longer-term trading signals also have wider stop loss compared to the short-term trading signals.
Traders using the multi-timeframe trading approach should identify a price reversal or the beginning of a new trend in a higher time frame chart and then move to a lower time frame chart and take positions only in the direction of the higher time frame trend. For example, if the Daily CCI values indicate a bearish trading signal, traders should move to the hourly Commodity channel index chart and look for bearish trading signals, and exit upon the opposite trading signals.
Utilizing Tools For Additional Confirmation
The main limitation of the CCI – is because of the unbounded oscillator values, it is difficult to identify the overbought and oversold levels of a trading instrument by looking at the CCI values. As a result, reversal entries may be delayed.
The best CCI buy signal is to enter the BUY trade only after the indicator values are above +100. however, the entry may be delayed and results in late entry frequently, on the other hand, it provides more stable signals. The price for better signals may be in the form of delayed entry
Traders using the zero line to enter may not be able to get the best results, though the signals may be early they result in many false signals. So, traders must use additional tools for confirmation as the commodity channel index oscillator is not a stand-alone indicator. Since it is a momentum-based oscillator, it should not be combined with other momentum-based indicators.
The best confirmation is achieved by using the price action together with trading volumes. The increased trading volumes during convergence and divergence and also while the indicator values move beyond + 100 or -100 indicates a strong price move. This price move may indicate the strength of the trend and help the trader to enter with confidence.
Conclusion
The CCI – Commodity channel works on all trading instruments and is not only meant for trading commodities. The indicator is versatile and can help the technical analyst to identify the entry point and exit point and provides overbought and oversold conditions. Divergence and convergence trading possibilities of the indicator make it a leading technical indicator.
The indicator is an unbounded momentum oscillator and uses the typical price for indicator calculations. It can be used by new and advanced forex traders and can be applied to any chart time frame. Like any other technical indicator, it has limitations and should be traded in confluence with other technical indicators.


