Trading in the world of Forex presents numerous opportunities and challenges. It is a realm characterized by volatility, complexity, and a profusion of terminologies and patterns that help decipher market trends. Among these myriad patterns and signals, the ‘dragonfly doji' stands out as a key pattern for investors to understand.
The dragonfly doji, named due to its peculiar resemblance to a dragonfly, is a potent symbol on a candlestick chart. Its appearance provides significant insight into the dynamics of the market, often pointing towards an upcoming reversal in the trend. To fully harness the potential of this pattern, traders need a profound understanding of the dragonfly doji – its characteristics, implications, and potential pitfalls. This article aims to provide an in-depth look into the dragonfly doji, making it accessible and understandable to the general public, especially those involved in Forex.
What is a Dragonfly Doji?
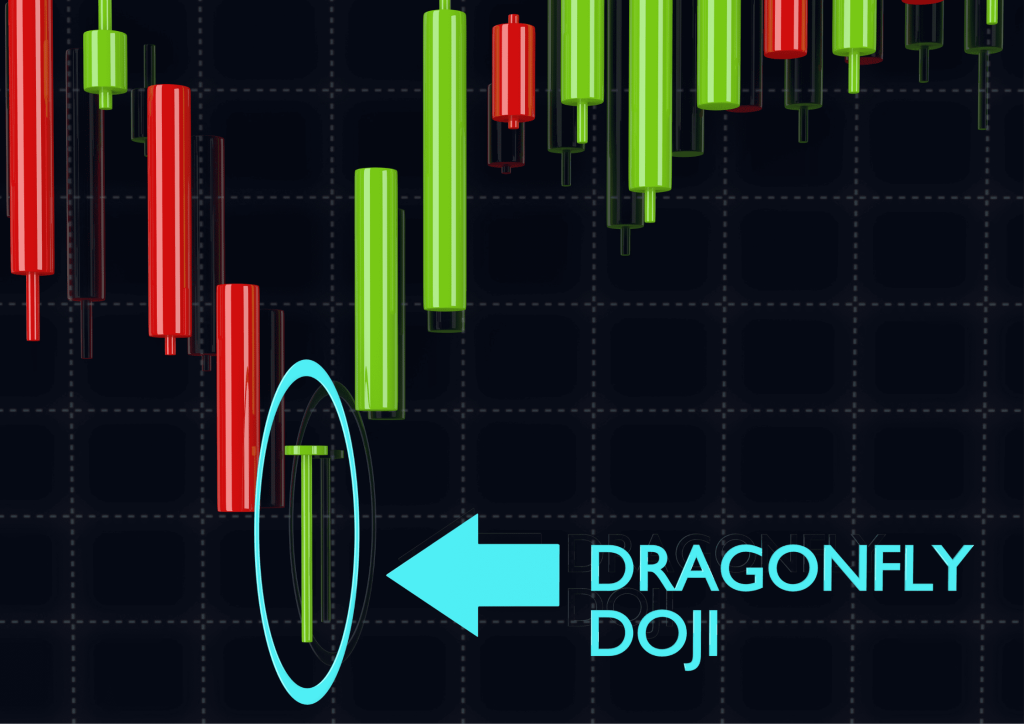
The dragonfly doji is a specific type of candlestick pattern used in technical analysis to predict potential price reversals in the market. The pattern, as indicated by its name, resembles a dragonfly, a slim-bodied insect known for its delicate and symmetrical appearance. Similarly, the dragonfly doji candlestick pattern displays symmetry, offering a unique visual representation of market sentiment.
Appearing at the bottom of a downtrend, a dragonfly doji pattern signifies that the market's bears may be losing their grip, hinting at a possible bullish reversal. It is defined by a long lower shadow (also known as a wick or tail) and an absence, or near absence, of an upper shadow and real body. Essentially, this implies that the opening price, closing price, and high of the session are the same or very close, forming a small or non-existent body at the upper end of the candlestick.
While the dragonfly doji primarily hints at bullish reversals, it shouldn't be confused with the gravestone doji, its counterpart that typically appears at the top of an uptrend and suggests a bearish reversal. It's the placement and context of these patterns that often differentiate their implications.
Key Features of the Dragonfly Doji
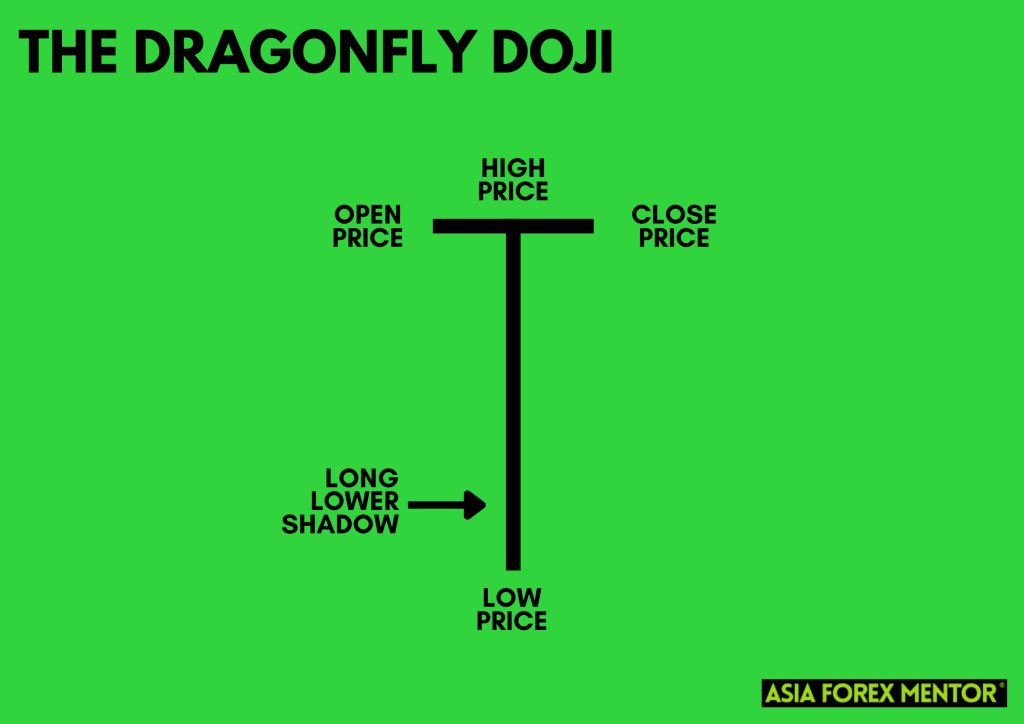
Recognizing a dragonfly doji amidst a myriad of other candlestick patterns is straightforward, thanks to its distinctive attributes. This pattern is characteristically marked by its ‘T' shape on a candlestick chart, created due to the opening, lower trading, and rallying to close at or near the same price as the opening.
One of the essential features of the dragonfly doji is its long lower shadow. This shadow or wick symbolizes a period of trading where the bears managed to drive the prices down. However, by the time of closing, the bulls rallied, pushing the price back to the opening level, creating the distinct lower shadow that epitomizes the dragonfly doji candle.
Another key feature of this pattern is the absence of an upper shadow, indicating that buyers controlled the price action from the open to close. While this absence might seem unusual compared to other candlestick patterns, it's a norm in the formation of the dragonfly doji, representing an intense struggle and eventual victory of the buyers over the sellers.
The formation of a dragonfly doji pattern reflects a significant shift in the market dynamics. It depicts a strong comeback by the bulls in a session initially dominated by the bears. Understanding these key features allows traders to spot the formation of a dragonfly doji promptly, facilitating swift and informed decision-making.
The Dragonfly Doji Vs. Other Candle Patterns
Candlestick patterns come in a multitude of shapes and sizes, each offering a distinct outlook on the market's sentiment and future course. The dragonfly doji is one such pattern. While its unique attributes differentiate it from others, it's crucial to understand how it contrasts with similar candlestick patterns like the gravestone doji and the traditional doji candle.
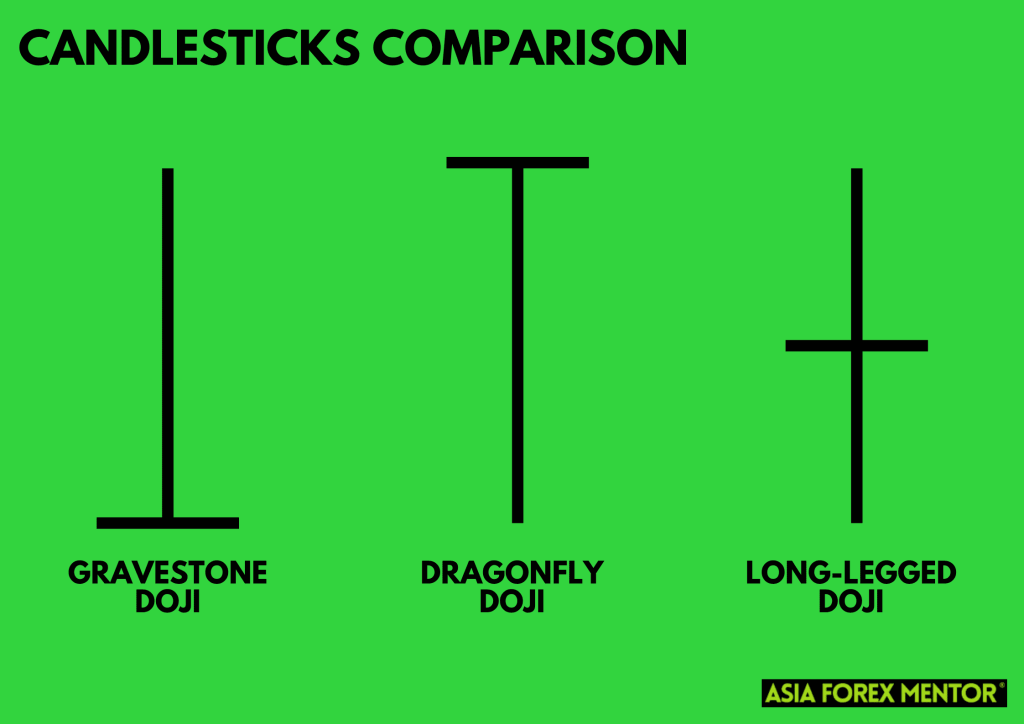
A gravestone doji, unlike the dragonfly doji, appears at the top of an uptrend. It indicates that the bulls have lost control, and the bears might soon dominate, suggesting a potential bearish reversal. Visually, the gravestone doji has a long upper shadow with no or a tiny lower shadow, essentially the opposite of the dragonfly doji.
The long-legged doji candle is another pattern that often gets confused with the dragonfly doji. It features long upper and lower shadows, reflecting a session of indecisiveness where neither the bulls nor the bears could gain control. In stark contrast, the dragonfly doji points towards a clear shift in power from the sellers to the buyers, even after a period of initial bearish activity.
Understanding these nuances is pivotal for traders to correctly interpret the patterns and make informed trading decisions.
Also Read: The Doji Ultimate Guide
The Dragonfly Doji in the Context of a Bearish Candlestick
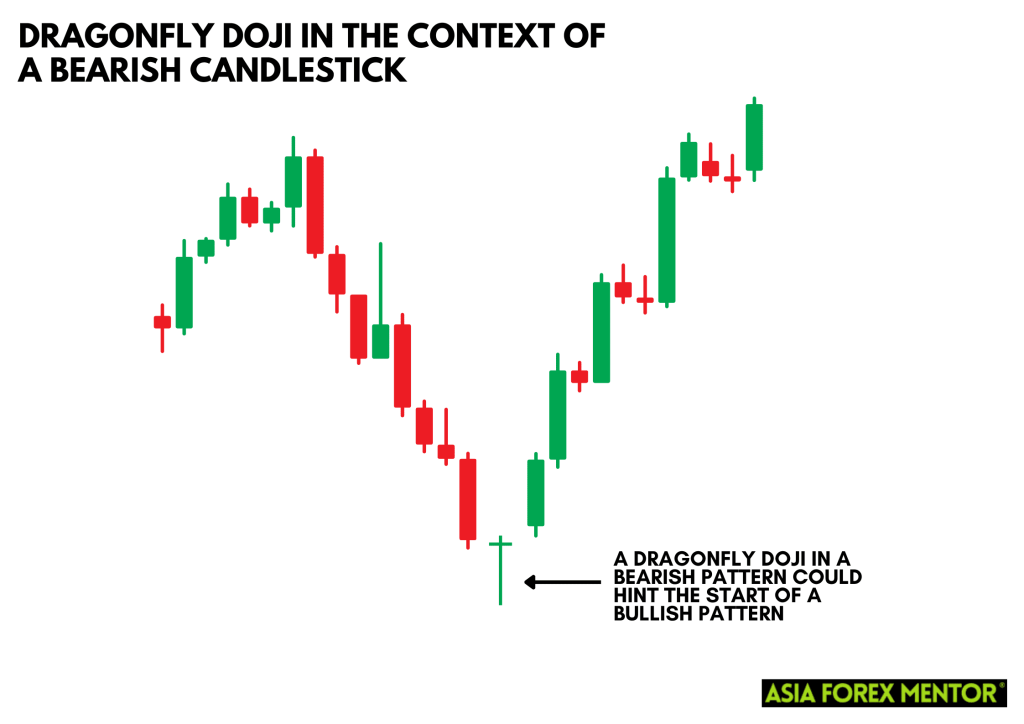
The impact of a dragonfly doji is amplified when seen in the context of preceding candlestick patterns. Specifically, when a dragonfly doji follows a bearish candlestick, it often serves as a bullish signal, hinting at the end of a downtrend and the potential onset of an uptrend.
The appearance of a dragonfly doji after a bearish candlestick implies a significant change in market sentiment. The bearish candlestick shows the dominance of sellers, driving the price down. However, the formation of a dragonfly doji immediately after suggests that the sellers are losing their grip, and the buyers are ready to take over the market. The once-dominant bears fail to keep the prices down, and the bulls manage to rally the prices back to the opening level, creating a potent signal for a bullish reversal.
However, traders should always look for confirmation in the form of a subsequent bullish candlestick to validate the reversal signal.
Also Read: How to Read Candlesticks Like a Pro
Limitations of the Dragonfly Doji Pattern
Despite being a powerful tool in a trader's arsenal, the dragonfly doji has its limitations. Like any technical analysis tool, it should not be used in isolation to make trading decisions.
A single dragonfly doji is not a foolproof indicator of a bullish reversal. It's a hint, a sign, but not an absolute prediction. Hence, traders need to use it in conjunction with other candlestick patterns, trend analysis, and technical indicators for a more holistic understanding of the market.
Additionally, while the dragonfly doji primarily signals a bullish reversal, it is not exclusively so. In certain situations, it might appear as a continuation pattern, indicating a pause in the downtrend before it continues. This phenomenon is more common in highly volatile markets and emphasizes the importance of confirmation from subsequent candles and other indicators.
Understanding these limitations allows traders to incorporate the dragonfly doji into a more comprehensive, multi-faceted trading strategy, reducing risks and enhancing the potential for successful trades.
The Importance of the Dragonfly Doji in Forex Trading
Forex trading involves dealing with a highly volatile and liquid market. Here, the importance of understanding candlestick patterns, particularly the dragonfly doji, is paramount. The dragonfly doji, with its unique characteristics, provides Forex traders with a critical predictive tool to navigate this dynamic landscape.
In the context of Forex trading, the appearance of a dragonfly doji at the bottom of a downtrend signals that selling pressure is diminishing and a potential trend reversal might be imminent. Such cues are extremely valuable to traders as they give them early indications about possible shifts in market sentiment. Given the vast scale and quick shifts of the Forex market, catching these reversals at the right moment can lead to profitable trades.
Moreover, the presence of a dragonfly doji in Forex trading can influence traders' strategies. For instance, traders might choose to close out short positions upon spotting a dragonfly doji, anticipating a bullish reversal. Alternatively, traders could consider entering a long position if the dragonfly doji is confirmed by subsequent bullish candles.
The Psychology Behind the Dragonfly Doji

A dragonfly doji is not just a pattern on a chart; it's a reflection of the psychological state of the market at a given point in time. By studying a dragonfly doji, traders can glean valuable insights into the emotional tug-of-war between the bulls and the bears.
When a dragonfly doji forms after a series of bearish candles, it indicates that despite sellers initially driving the prices down, the buyers managed to push them back up to the opening level. This shift signifies that the sellers are losing their dominance and the buyers are gaining strength. It suggests a potential change in market sentiment from bearish to bullish.
The long lower shadow represents the fear and pessimism that drove prices down during the session. However, the absence of a body and an upper shadow indicates a resurgence of optimism and buying pressure. This battle and ultimate turnaround capture the shifting psychology of the market, making the dragonfly doji a potent symbol of a potential trend reversal.
Using Technical Indicators with the Dragonfly Doji
While the dragonfly doji is a powerful pattern, it can be further strengthened when used in conjunction with technical indicators. By cross-referencing the insights from the dragonfly doji with other technical tools, traders can confirm their predictions, reducing false signals and bolstering their trading strategy.
For instance, the Relative Strength Index (RSI) is a momentum oscillator that can help confirm a dragonfly doji's bullish reversal signal. If the RSI is in the oversold territory when the dragonfly doji forms, it suggests that the bearish momentum is losing steam and a reversal is likely.
Another valuable tool is the Moving Average Convergence Divergence (MACD). If the MACD line crosses above the signal line around the time a dragonfly doji appears, it serves as further confirmation of a potential bullish reversal.
Volume is another crucial factor to consider. A significant increase in volume during the formation of a dragonfly doji could indicate a stronger signal, as it shows a high level of trader participation in the price reversal.
These are just a few examples of how technical indicators can work in harmony with the dragonfly doji to improve the accuracy of your trading predictions. Remember, no single tool or pattern can provide infallible predictions; instead, a balanced and multifaceted approach is key to successful trading.
Conclusion
Understanding the dragonfly doji pattern is essential for any trader, particularly those employing candlestick charts in their analysis. This pattern provides valuable insights into the shift in market dynamics from sellers to buyers, often signaling a potential bullish reversal.
However, like all trading strategies, it's vital not to rely solely on the dragonfly doji for trading decisions. The dragonfly doji should always be used in conjunction with other technical indicators and analysis tools to improve its accuracy. Also, remember that while the dragonfly doji is often a bullish signal, the confirmation of the next candle and other market factors should be considered to avoid potential trading pitfalls.
In essence, the dragonfly doji, like other candlestick patterns, provides a lens through which to view and interpret market sentiment. It is another tool in the trader's kit, helping them decipher the nuanced language of the markets and navigate the ever-fluctuating world of Forex. By mastering these candlestick patterns, traders can better predict market trends and make informed decisions to optimize their trading success.
FAQs
How do I identify a dragonfly doji on a candlestick chart?
A dragonfly doji is a distinctive pattern that appears on a candlestick chart. It is characterized by a long lower shadow, which suggests that prices fell significantly during the trading period but rebounded to close at or near the opening price. The ‘body' of the candlestick, which represents the difference between the opening and closing prices, is almost non-existent or very small. This gives the pattern a ‘T' shape, which resembles a dragonfly, hence the name. It's essential to note that a dragonfly doji typically appears at the bottom of a downtrend, signaling a potential bullish reversal.
Can I use the dragonfly doji as a standalone indicator to make my trading decisions?
While the dragonfly doji is a powerful pattern, it's crucial to use it in conjunction with other technical analysis tools for the most accurate predictions. This can include other candlestick patterns, trend analysis, volume data, and technical indicators like the Relative Strength Index (RSI) or the Moving Average Convergence Divergence (MACD). It's also a good practice to look for confirmation from the next candle or candles before making a trade decision based on a dragonfly doji.
What does a dragonfly doji tell us about the market sentiment?
A dragonfly doji represents a shift in market sentiment from bearish to bullish. It indicates that despite a period of selling pressure, the buyers managed to push the prices back up to the opening level by the end of the trading period. This is evidenced by the long lower shadow and the lack of a body or an upper shadow. When seen at the bottom of a downtrend, it often suggests that the sellers are losing control, and a bullish reversal may be on the horizon. However, always remember to seek confirmation from subsequent trading periods to verify the reversal signal.