Elliott Wave
The term Elliott Wave Theory refers to a theory in technical analysis used to describe price movements in the financial market. The theory was developed by Ralph Nelson Elliott after he observed and identified recurring, fractal wave patterns. Waves can be identified in stock price movements and in consumer behaviour. Investors trying to profit from a market trend could be described as riding a wave. A large, strong movement by homeowners to replace their existing mortgages with new ones that have better terms is called a refinancing wave. The Elliot wave theory can appear to be very confusing to some, especially the beginners as it has several degrees of waves that a trader must be able to tell apart. Apart from that, the counting of the waves is not to mention, also extremely subjective. However, the benefits of by learning such advanced market analysis can be much greater in terms of win rate as you understand how the market moves and be more likely to making the right decisions.
Elliott Wave – Quick Setup Tutorial
Content
- Basics of Elliott wave theory
- Advanced Elliott wave theory
- Trade rules
- Pros and cons
- Analysis
- Conclusion
- Info
Basics of Elliott wave theory
In order to understand how the market behaves in terms of the Elliott Wave theory, you must first understand the basics. In the Elliott Wave theory, the market moves in waves in 2 phases, motive and corrective. The motive phase is usually made up of 5 waves, which will be labelled 1 through 5. Wave 1 is the starting of a new trend. Wave 2 is a retracement of Wave 1, but it cannot exceed 100% of Wave. Wave 3 is a projection after Wave 2 and is usually the longest out of the 5 waves and always travels beyond Wave 1. Wave 4 is a retracement of Wave 3, however, it must not exceed 100% of Wave 3. Wave 5 is a projection of Wave 4 and it may be projected beyond Wave 3 or it may be truncated.
The Corrective phase, on the other hand, is made up of 3 waves, a, b and c. Wave a is the first initial wave that projects in the opposing direction as the motive trend. Wave b is a retracement of Wave a and Wave c. However, corrective phases tend to come in 2 styles, sharp and sideways. Or what we call, an alternation. This is due to fact that there is resistance from the trend of one larger degree. Hence, as a general rule, corrections never come in 5 waves of the same degree as the trend. These roughly sums up the basic knowledge and understanding of the Elliott Wave theory.
Also read: Bull Flag Bear Flag And Pennants
Advanced Elliott wave theory
In the advanced section, we will cover in depth regarding motive and corrective phases. Most impulses in a motive contains extensions, an elongated impulse with exaggerated subdivisions. The formation of extensions tends to take place in 1 of the 3 impulses of a motive phase, 1,3 and 5. This minor detail of extension is important as it gives traders the hint on the expected length of upcoming waves. Since the extension would take place in only 1 of the 3 impulses of the Motive phase, it serves as an important guide. For example, if Wave 1 and 3 are of equal lengths, then Wave 5 would highly likely be extended.
Diagonals can be found in the motive phase as well. Diagonals are a motive pattern yet not an impulse. They are usually made up of a 5 wave structure in alignment to the main trend, in which Wave four always moves into the price territory of Wave 1, or what we call in layman terms, an overlap into Wave 1. Furthermore, all of the waves in the diagonal pattern are made of a 3 waved subdivision, producing an overall count of 3-3-3-3-3. There are 2 kinds of diagonals, leading and ending. As the name suggests, an ending diagonal typically occurs in the fifth impulse wave of the motive phase. While on the other hand, a leading diagonal typically occurs in the first impulse wave of the motive phase. However, it is able to occur in wave a of the corrective phase as well. There are generally two types of diagonals that can form, they are expanding and contracting. As the name suggests, the contracting diagonal takes the shape of a wedge within 2 converging trendlines while the expanding diagonal takes shape within 2 diverging trendlines. One key characteristic to take note about is that ending expanding diagonals tend to have false break outs nearing the reversal price point at the end of the pattern.
There are 3 more patterns that form in the corrective phase according to the Elliott Wave theory. They are flats, zigzags and triangles. A flat is formed with the structure of 3-3-5, a zigzag is formed with a structure of 5-3-5 and a triangle is formed with a structure of 3-3-3-3-3. More often than not, especially in the sideways alternation of the corrective phase, the patterns occur in combinations. They can be combined with the same or different types of corrective patterns. For example, a double or triple zigzag, or even a flat-zigzag-triangle.
Zigzags are pretty standard in their formations. They are typically a 3 waved movement in the opposing direction of the general trend. Even then, it may consist of subdivisions of waves.
There are 3 types of flats, a normal flat, an expanded flat and a running flat. A normal flat is similar to a zigzag just that its Wave a tends to retrace to a lesser extent than a zigzag. This is due to overwhelming force from the general trend, only allowing 3 waves to complete its formation. An expanded flat occurs when the retracement of wave b from wave a is greater than wave a itself. Note that wave c of the normal and expanded flat tend to propel at equal or exceeding lengths as compared to wave a. Lastly, a running flat occurs when the wave b retraces and exceeds at a greater length than wave a while the wave c projects at a lesser length than wave a.
Triangles usually reflect a balance of bulls and bears in the market, causing the prices to move sideways with decreasing volume and volatility. Generally, there are 3 kinds of triangle formations, namely contracting also known as a symmetrical triangle, barrier also known as ascending or descending triangle and expanding triangle. The expanding triangle is just an inverted triangle within 2 diverging trendlines.
Also read: Cup And Handle A Complete Guide
Trade rules
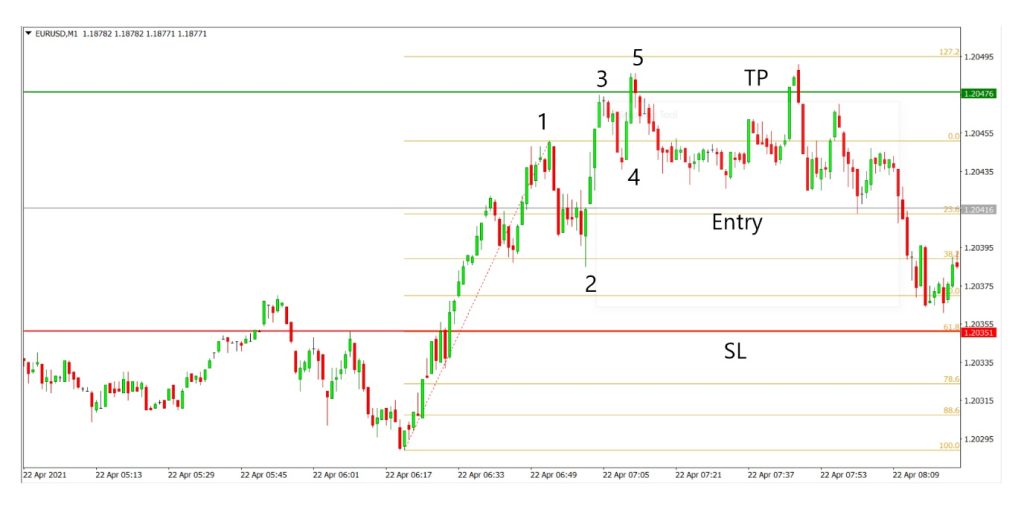
To trade with the basics of the Elliott Wave theory we will first wait for the reversal of the trend via a trendline as well as the formation of Wave 1 and 2. Next, we will enter via price action at the beginning of wave 3 and set our stoploss below 61.8% of Wave 1 and set our profit target at the first weakening signal of wave 5 towards the corrective phase. This set up applies for both bullish and bearish markets.
Pros and cons
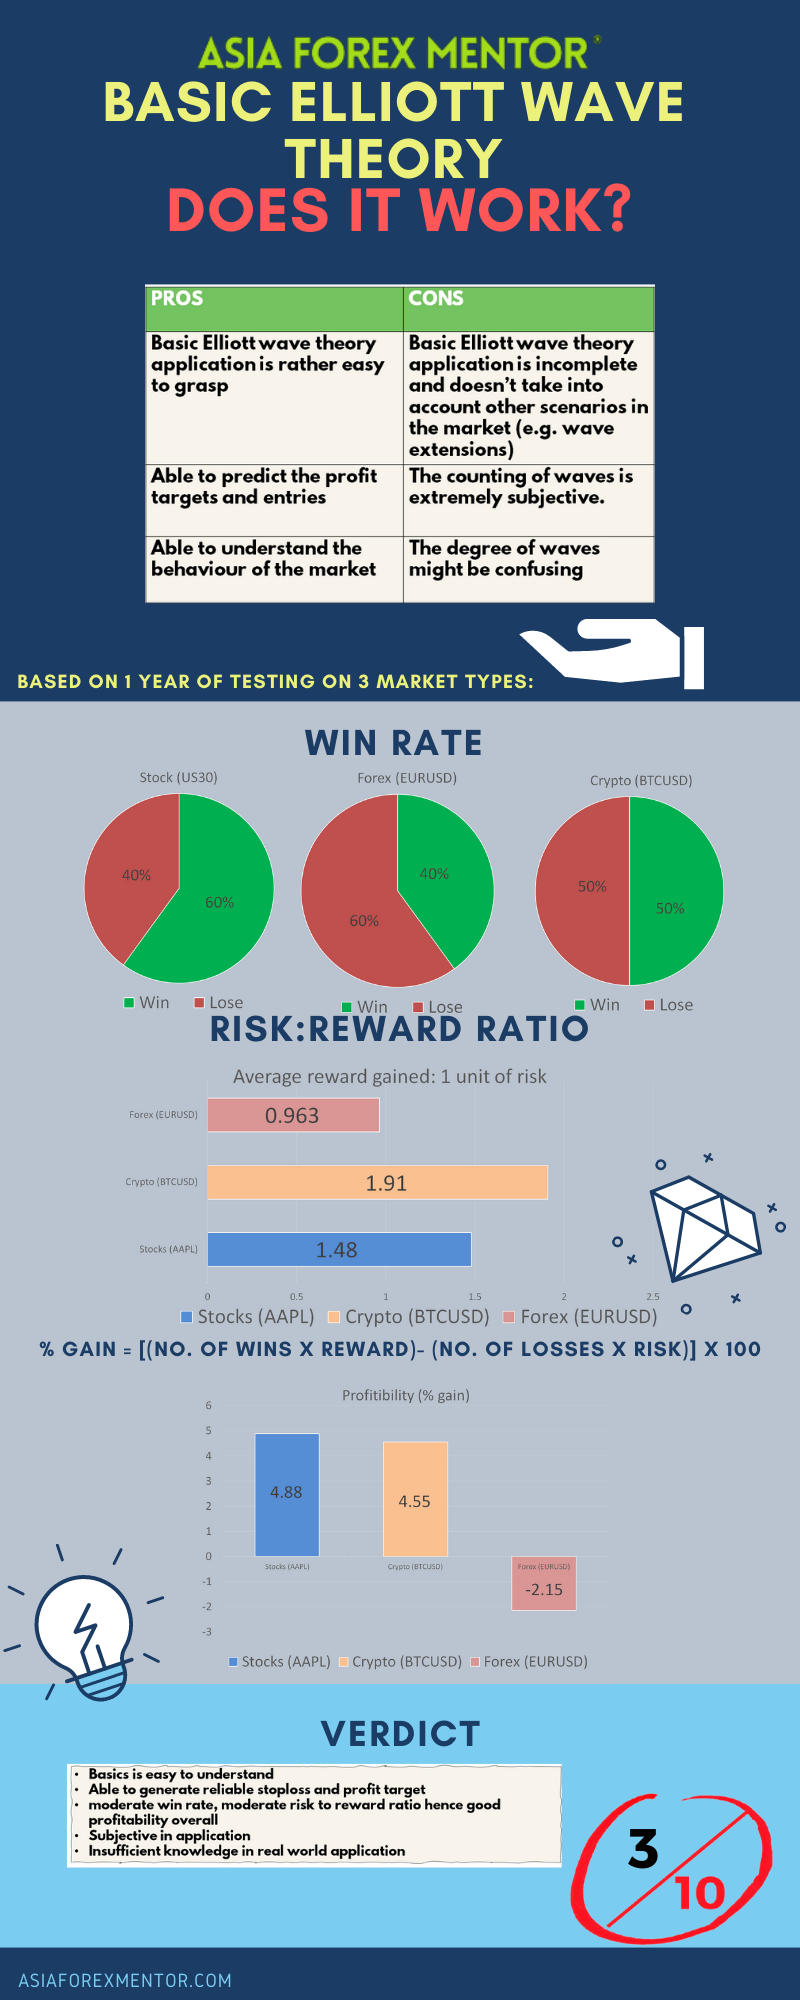
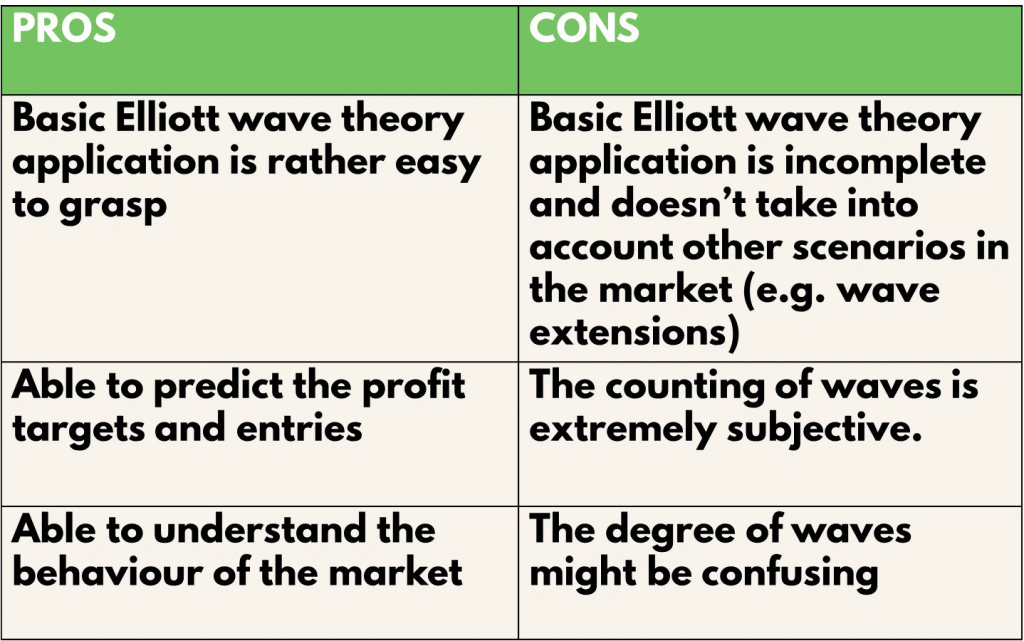
The benefits of using the basic Elliott Wave Theory are that it is easy to grasp and learn, giving beginners a good knowledge of the market’s behaviour. It also provides a rather simple system to identify stoploss and profit taking levels. Furthermore, it builds the foundation of understanding the market giving confidence to all sorts of traders of different calibres. However, it the basic theory is nonetheless insufficient for the real-world application to the markets which will in the long run, become a handicap to traders since there are much more scenarios that they wouldn’t know and hence wouldn’t take into consideration. Also, though the theory is easy to grasp, the application of it such as the counting of waves may in fact appear to be confusing and subjective to some, hindering their confidence in executing the trades.
Also read: Day Trader Salary And Their Profit Target
Analysis
To find out the profitability of the Basic Elliott Wave theory trading strategy, we decided to do a back test based on the past 10 trades from 11 Jul 21 on the M1 timeframe. The rules for entry will be the same as what was mentioned above. We will be back testing this throughout 3 types of trading vehicles, namely, EURUSD for forex, US30(DJI) for stocks and BTCUSD for cryptocurrency. For simplicity, we will assume that all trades taken have a risk of 1% of the account.
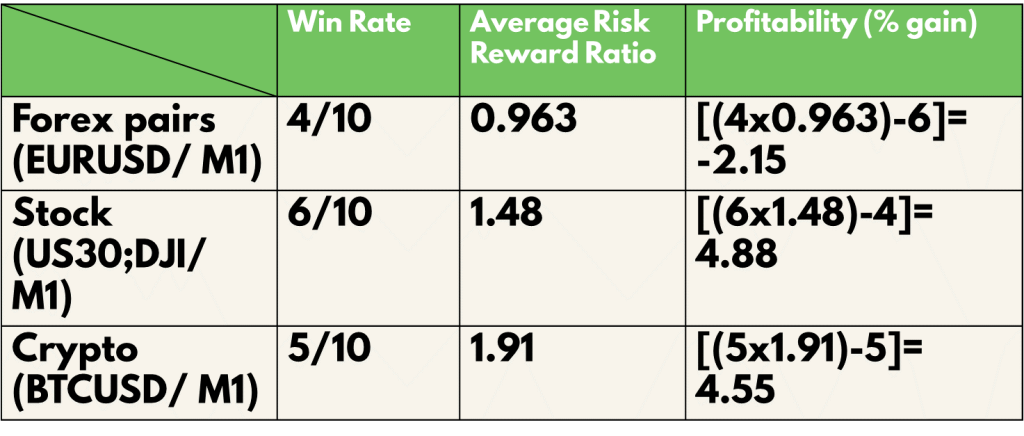
Definitions: Avg Risk reward ratio= ( Total risk reward ratio of winning trades/ total no. of wins) Profitability (% gain)= (no. of wins* reward)- (no of losses* 1) [ Risk is 1%]
An example of the application of the strategy is as shown:
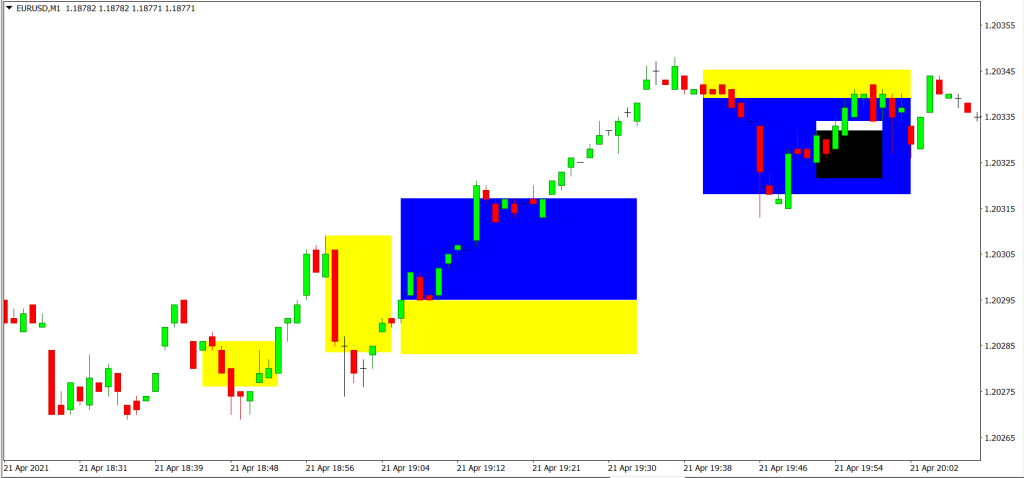
For the backtest results, trades with blue and yellow zones indicate an overall win with the blue zone as reward and the yellow zone as the risk taken.
As shown in our backtest, the win rate of this strategy for EURUSD (Forex) is 40%, AAPL (Stocks) is 60% and BTC (Crypto) is 50%
The average risk reward ratio of this strategy for EURUSD (Forex) is 0.963, US30 (Stocks) is 1.48 and BTC (Crypto) is 1.91.
The profitability of this strategy for EURUSD (Forex) is -2.15, AAPL (Stocks) is 4.88 and BTC (Crypto) is 4.55.
Conclusion
In conclusion, the basics of the Elliott Wave Theory though insufficient in the real-world market context, it is able to provide a decent win rate in any time frame. On top of that, it provides a good risk reward ratio for certain trading vehicles, giving a decent profitability rating for them as well. As for Forex trading, greater in depth understanding of the market is needed and hence the basic Elliott Wave theory wouldn’t cut it. However, the Elliott Wave theory merely provides a foundation for market analysis. When coupled with indicators and price action, it is bound to reap larger wins with higher win rate, with the advanced and complete understanding of course. In my opinion, the basics of the Elliott Wave theory is like the dictionary, guiding you for books with tougher vocabulary, in this case, giving guidance on reading market movements in any kind of trading vehicle you wished to excel in. Thus, it is definitely an indispensable skill to have and master to kick start your trading journey with a clear direction of the market at the back of your head.
Info