Learn To Trade Forex • Best Forex Trading Course • AsiaForexMentor

Bull flag, Bear Flag and Pennants – The Verdict

Written by

Ezekiel Chew

Updated on

January 29, 2024

i
Its a default text

Bull flag, Bear Flag and Pennants – The Verdict

Written by:

Last updated on:

January 29, 2024


Bull flag, Bear Flag and Pennants - The Verdict

Introduction to bull flag, bear flag and pennants:

In technical analysis, a pennant is a type of continuation pattern formed when there is a large movement in a security, known as the flagpole, followed by a consolidation period with converging trend lines, the pennant, followed by a breakout movement in the same direction as the initial large movement, which represents the second half of the flagpole. On the other hand, a flag is a price pattern that, in a shorter time frame, moves counter to the prevailing price trend observed in a longer time frame on a price chart. It is named because of the way it reminds the viewer of a flag on a flagpole. The flag and pennant patterns are commonly used as a confirmation for a strong trend continuation. There are typically two types of flag, the bull flag and the bear flag. The pattern serves to provide valuable information as it may increase the probability of trades taken by traders of every calibre. As the name suggests, the flag and pennant patterns usually occur as a consolidation in a steep gradient break out. Hence, this gives rise to the observable “pole” in the patterns. Though the pennant may resemble a triangle formation, the difference between the two patterns is the probability of the direction the price action is going to take.

Bull flag, bear flag and Pennants – Quick Setup Tutorial

Content

  1. Types of flag and pennant pattern
  2. Identification of flag and pennant
  3. How to use the flag and pennant
  4. Pros and cons of the flag and pennant pattern strategy
  5. Flag and Pennant Pattern Analysis
  6. Conclusion for bull flag, bear flag and pennants
  7. Infographic

Types of flag and pennant pattern

There are typically two types of flag and pennant patterns, mainly: Bullish and Bearish.

The bull flag pattern consists of an upright pole coupled with a downward channel formed at the tip of the pole.
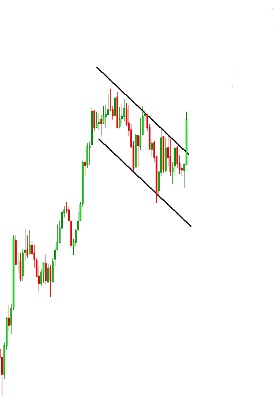
 

Bull Flag pattern
Bull Flag pattern

The Bear flag pattern on the other hand consists of an inverted pole coupled with an upward channel at the bottom of the pole.
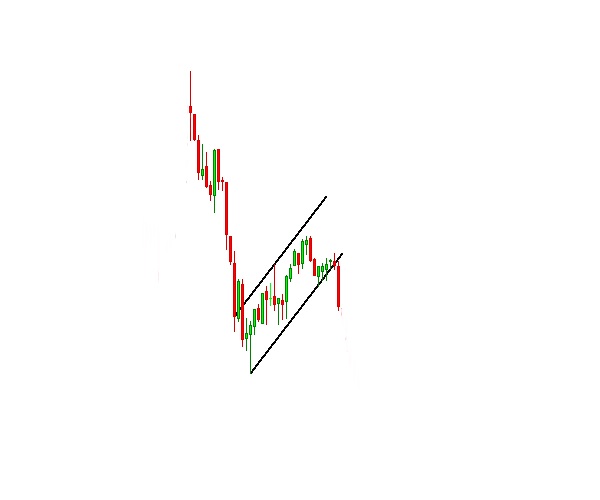
Bearish Flag Pattern

The Bullish Pennant pattern consists of an upright pole coupled with two converging trendlines forming a triangle at the tip of the pole
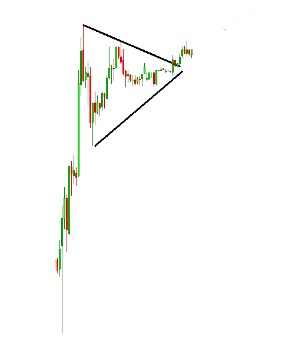
Bullish Pennant Pattern

The Bearish Pennant pattern consists of an inverted pole coupled with two converging trendlines forming a triangle at the end of the pole.
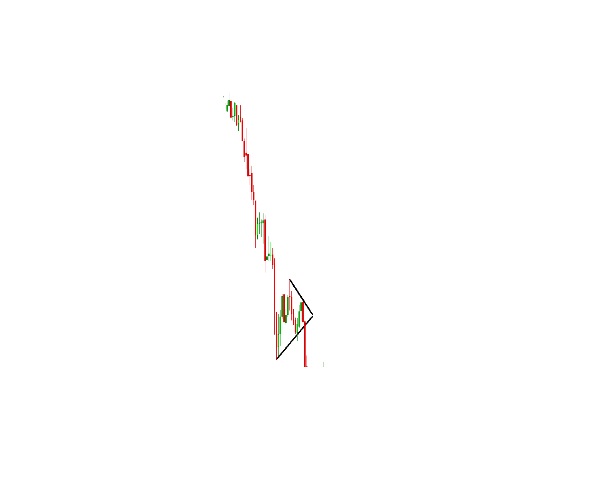
Bearish Pennant Pattern

Back to top

Identification of flag and pennant

A flag or pennant pattern can be found forming after a huge reversal or a break out forming the pole of the pattern. The pole is usually at least twice as large as the consolidation that is about to be formed. However, the price forming the flag pole is allowed to rest but as long as it follows a steep gradient, it is still to be counted as a valid pole. It is also important to note that if the consolidation, the formation of the pennant or flag is too huge with respect to the pole, it is not to be counted as a flag and pennant pattern.

Also read: Fibonacci Trading Strategy

Back to top

How to use the flag and pennant

The application of the flag and pennant patterns stems from the chart pattern that they consist of. For the Flag patterns it is equivalent to playing a channel break out whereas for the Pennant pattern, it is the same as playing a triangle breakout. However, the only difference is the added probability to the direction in which the price action will take. As such for the entry, we will be entering on the high or low of the candle that breaks the flag channel or the pennant triangle on a close.
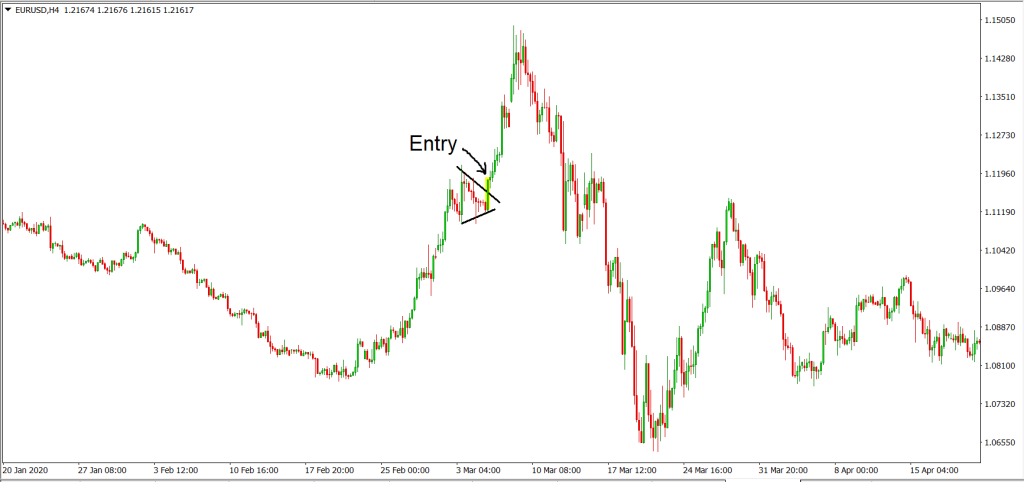
flag and pennant

When playing a Flag pattern, the stop loss can be determined by taking half of the vertical width of the channel in terms of pips after entry. As for the Pennant pattern, the stop loss can be determined by half of the vertical height of the triangle after entry.
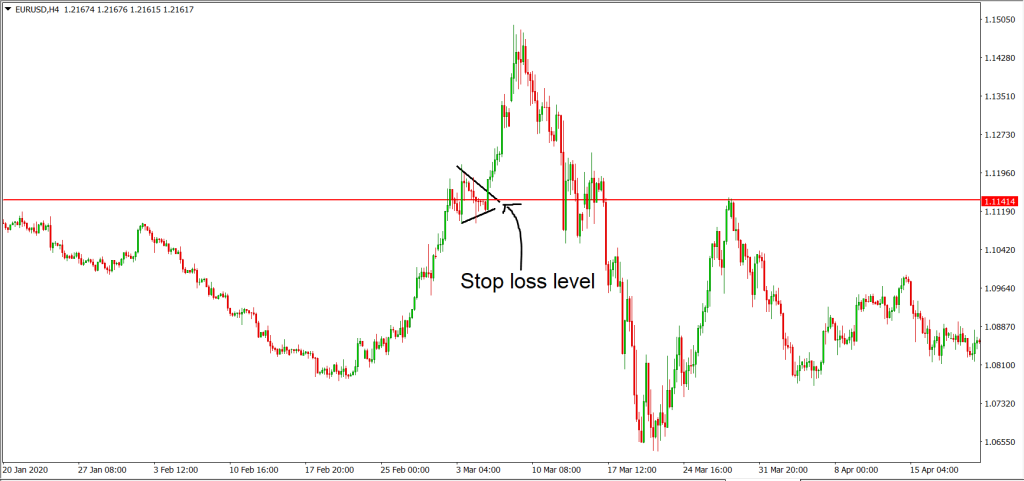
flag and pennant - Stop loss level

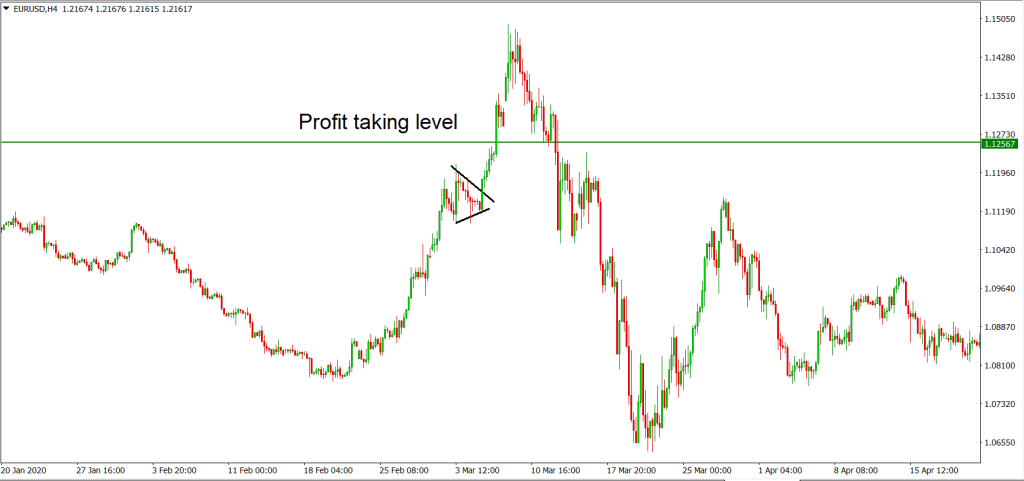
When playing a flag pattern, the profit taking level can be determined by the vertical width of the channel in terms of pips, from the top trendline of the downward channel. On the other hand, the profit taking level of the pennant pattern can be determined by the vertical height of the pennant in in terms of pips from the top trendline of the triangle.
flag and pennant - Profit taking level

Back to top

Pros and cons of the flag and pennant pattern strategy

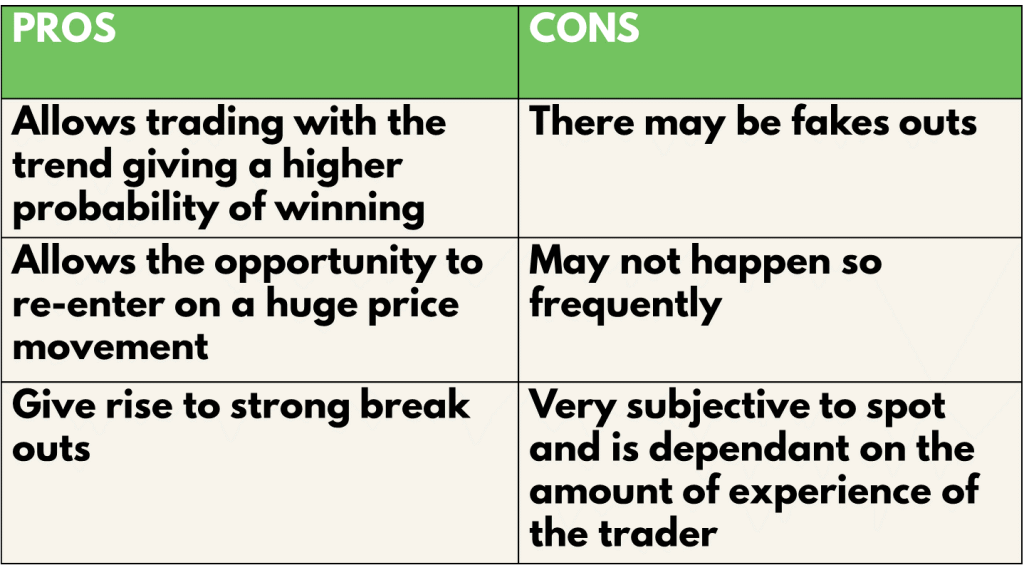
The Flag and pennant pattern strategy allows the trader to be trading with the trend since it is a trend continuation pattern which renders a higher win rate. On top of that, the strategy gives a second chance to re-enter on a huge move that the trader missed out on the first time. To top that off, the consolidation of the flag and pennant pattern often gives rise to huge and powerful breakouts, though not as strong as the one that forms the pole. However, this pattern strategy is prone to many fake outs towards the end of the consolidation. Hence, it is important to confirm the breaking out of the pattern with a candle close above the trend line or channel. Subsequently, the flag and pennant pattern doesn’t naturally form in the market often, especially in higher timeframes. Even if it does form, it may be subjective to spot by traders.
Pros and cons of the flag and pennant pattern strategy

Back to top

Flag and Pennant Pattern Analysis

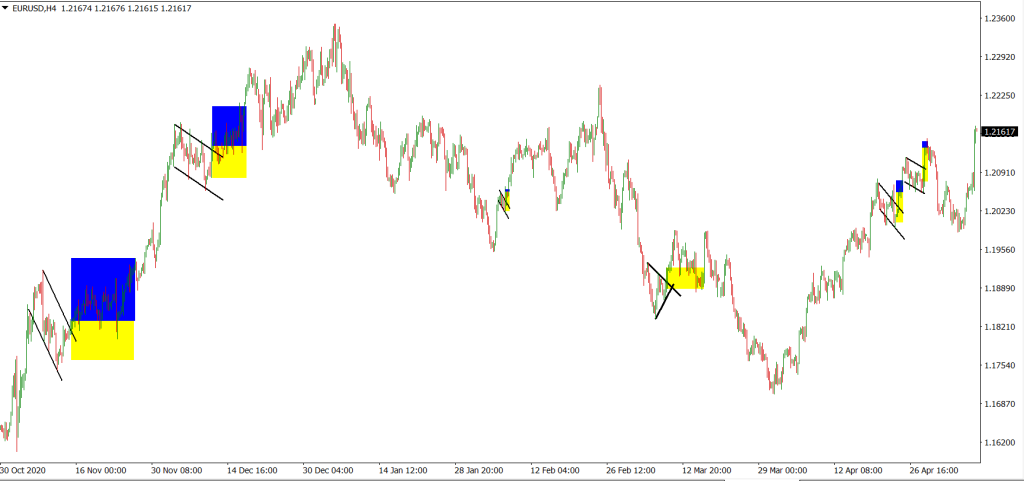
To find out the profitability of the flag and pennant pattern strategy, we decided to do a back test based on the past 10 trades from 9 May 21 on the H4 timeframe. The rules for entry will be the same as what was mentioned above. We will be back testing this throughout 3 types of trading vehicles, namely, EURUSD for forex, AAPL for stocks and BTCUSD for cryptocurrency. For simplicity, we will assume that all trades taken have a risk of 1% of the account.

Definitions:  Avg Risk reward ratio= ( Total risk reward ratio of winning trades/ total no. of wins)                Profitability (% gain)= (no. of wins* reward)- (no of losses* 1) [ Risk is 1%]

An example of the application of the strategy:
Flag and Pennant Pattern Analysis

For the Backtest results, trades with blue and yellow zones indicate an overall win with the blue zone as reward and the yellow zone as the risk taken.

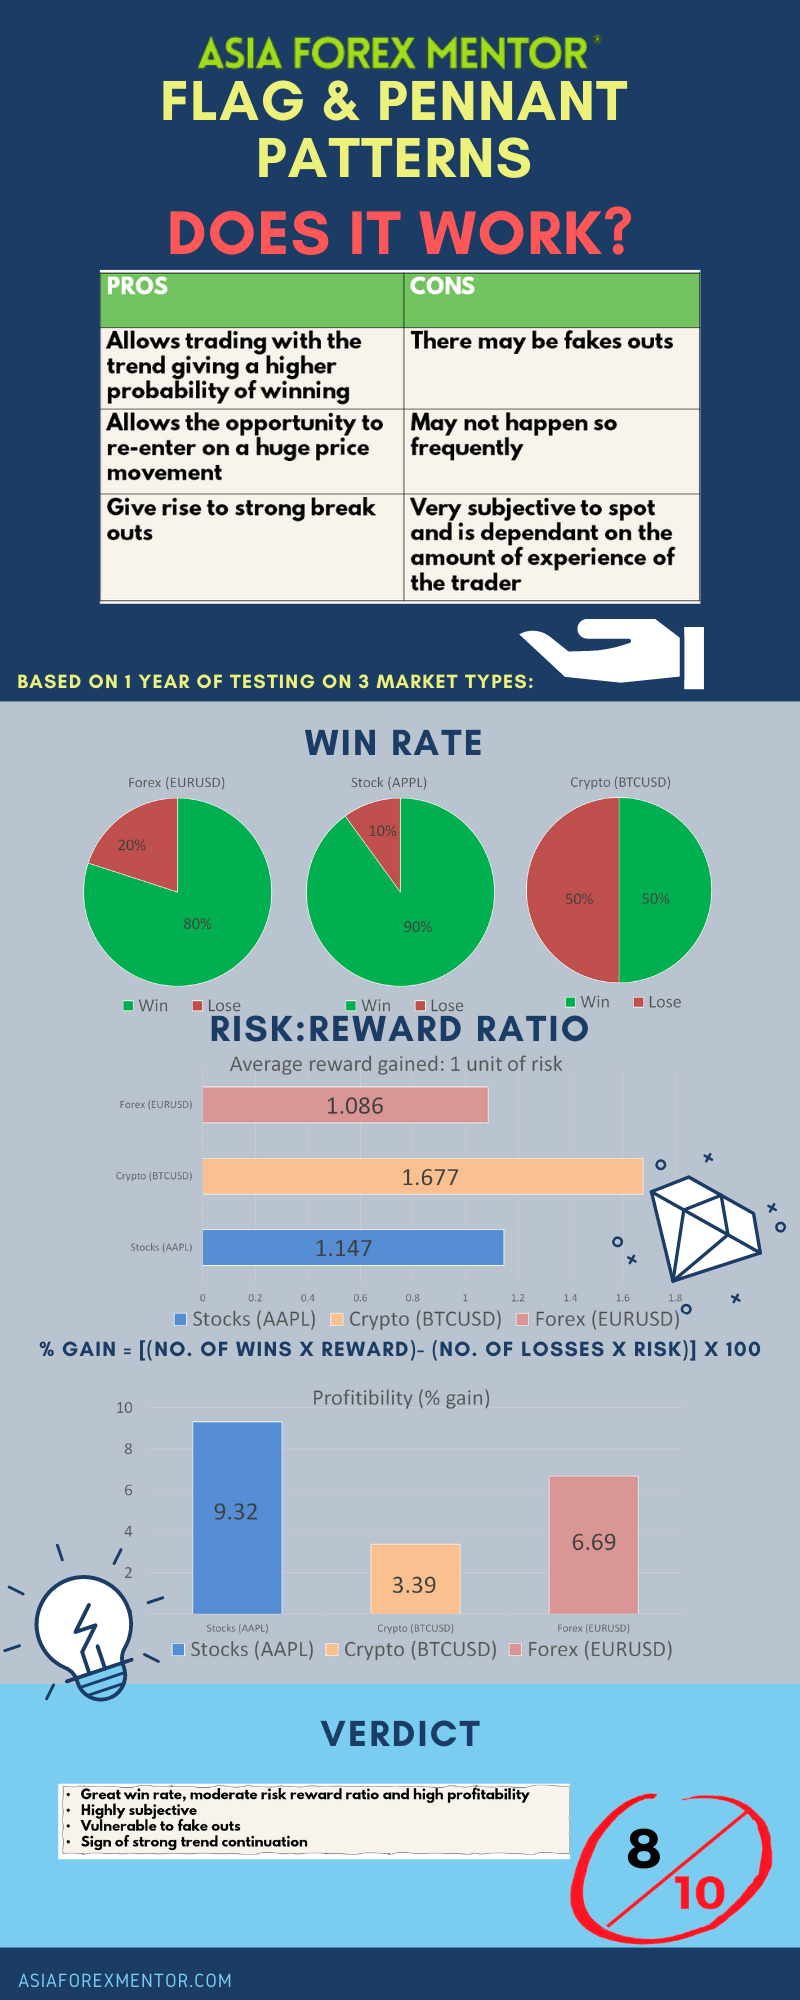
As shown in our backtest, the win rate of this strategy for EURUSD (Forex) is 80%, AAPL (Stocks) is 90% and BTC (Crypto) is 50%

The average risk reward ratio of this strategy for EURUSD (Forex) is 1.086, AAPL (Stocks) is 1.47 and BTC (Crypto) is 1.677.

The profitability of this strategy for EURUSD (Forex) is 6.69, AAPL (Stocks) is 9.32 and BTC (Crypto) is 3.39.

Also read: Best Forex Pairs to Trade
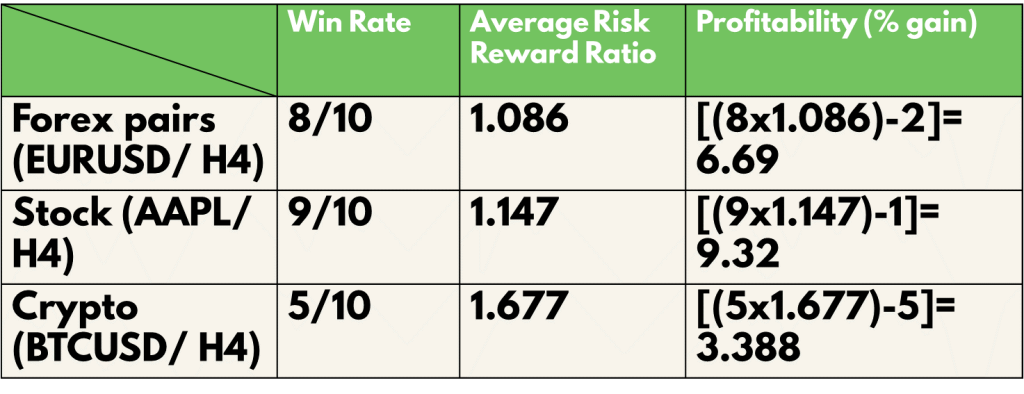
Table Flag - and Pennant Pattern Analysis

Back to top

Conclusion for bull flag, bear flag and pennants

In conclusion, the bull flag, bear flag and pennant pattern strategy is an overall good strategy with a high average win rate, decent average risk to reward ratio and good profitability. However, it does not take occurrence in the market and when it does, it is a must to take advantage of the scenario. This pattern strategy can definitely be improved further with the help of indicators as well as support resistance lines. It is important to note that this strategy is also extremely subjective. Common mistakes traders would make is by confusing the forming of the flag and pennant patterns with ahead and shoulders or some reversal patterns forming ahead. On top of that, the usage of pending orders in this strategy is not recommended as it may lead to fake outs that can destroy one’s account. Patience is an important aspect of this strategy nevertheless.

Also read: Head and Shoulders Pattern

Back to top

Infographic

Bull flag, Bear Flag and Pennants Infographic

Back to top


About Ezekiel Chew​

Ezekiel Chew, founder and head of training at Asia Forex Mentor, is a renowned forex expert, frequently invited to speak at major industry events. Known for his deep market insights, Ezekiel is one of the top traders committed to supporting the trading community. Making six figures per trade, he also trains traders working in banks, fund management, and prop trading firms.

Average True Range Most Traders Use It Wrong

Most traders treat the average true range as a background indicator and use it the same way beginners do: glance at the number and guess at a stop loss. ABOUT THIS GUIDE This guide covers how professional forex traders actually apply the average true range. It goes from ATR stop

Read More

8 Best Day Trading Books That Actually Works

The best day trading books on most recommended lists were written for markets that no longer exist the way they once did. Traders buy the top-rated titles, work through them, and find that the strategies fail in a live account. The problem is rarely the trader. Most lists recommend books

Read More

Position Size Calculator Every Forex Trader Needs

Most traders lose their accounts not because of a bad entry call but because they put too much on the line. The position size calculator is what stops that from happening before an order is ever placed. ABOUT THIS GUIDE This guide covers what a position size calculator actually does,

Read More

How to Draw Trend Lines in Trading the Right Way 2026

Most traders drawing trend lines in trading are connecting random price points and calling it technical analysis, which is why their supposed support turns into thin air the moment price actually touches it. ABOUT THIS GUIDE This guide covers the institutional method for drawing valid trend lines in forex. It

Read More

Head and Shoulders Pattern Forex Guide 2026

Recognizing the head and shoulders pattern and trading it correctly are two entirely different skills. Most forex traders who spot the formation still end up stopped out before the move begins. The pattern appears in virtually every technical analysis curriculum and across all forex pairs and timeframes, yet the entry

Read More

AFM Trading Summit Live

Date: Coming Soon

Join us at the AFM Trading Summit Live and learn from top industry experts through live trading sessions, market insights, and actionable strategies.

Bull flag, Bear Flag and Pennants – The Verdict

4.0
Overall Trust Index

Written by:

Updated:

January 29, 2024


Bull flag, Bear Flag and Pennants - The Verdict

Introduction to bull flag, bear flag and pennants:

In technical analysis, a pennant is a type of continuation pattern formed when there is a large movement in a security, known as the flagpole, followed by a consolidation period with converging trend lines, the pennant, followed by a breakout movement in the same direction as the initial large movement, which represents the second half of the flagpole. On the other hand, a flag is a price pattern that, in a shorter time frame, moves counter to the prevailing price trend observed in a longer time frame on a price chart. It is named because of the way it reminds the viewer of a flag on a flagpole. The flag and pennant patterns are commonly used as a confirmation for a strong trend continuation. There are typically two types of flag, the bull flag and the bear flag. The pattern serves to provide valuable information as it may increase the probability of trades taken by traders of every calibre. As the name suggests, the flag and pennant patterns usually occur as a consolidation in a steep gradient break out. Hence, this gives rise to the observable “pole” in the patterns. Though the pennant may resemble a triangle formation, the difference between the two patterns is the probability of the direction the price action is going to take.

Bull flag, bear flag and Pennants - Quick Setup Tutorial

Content

  1. Types of flag and pennant pattern
  2. Identification of flag and pennant
  3. How to use the flag and pennant
  4. Pros and cons of the flag and pennant pattern strategy
  5. Flag and Pennant Pattern Analysis
  6. Conclusion for bull flag, bear flag and pennants
  7. Infographic

Types of flag and pennant pattern

There are typically two types of flag and pennant patterns, mainly: Bullish and Bearish.

The bull flag pattern consists of an upright pole coupled with a downward channel formed at the tip of the pole.


Bull Flag pattern
Bull Flag pattern

The Bear flag pattern on the other hand consists of an inverted pole coupled with an upward channel at the bottom of the pole.

Bearish Flag Pattern

The Bullish Pennant pattern consists of an upright pole coupled with two converging trendlines forming a triangle at the tip of the pole

Bullish Pennant Pattern

The Bearish Pennant pattern consists of an inverted pole coupled with two converging trendlines forming a triangle at the end of the pole.

Bearish Pennant Pattern

Back to top

Identification of flag and pennant

A flag or pennant pattern can be found forming after a huge reversal or a break out forming the pole of the pattern. The pole is usually at least twice as large as the consolidation that is about to be formed. However, the price forming the flag pole is allowed to rest but as long as it follows a steep gradient, it is still to be counted as a valid pole. It is also important to note that if the consolidation, the formation of the pennant or flag is too huge with respect to the pole, it is not to be counted as a flag and pennant pattern.

Also read: Fibonacci Trading Strategy

Back to top

How to use the flag and pennant

The application of the flag and pennant patterns stems from the chart pattern that they consist of. For the Flag patterns it is equivalent to playing a channel break out whereas for the Pennant pattern, it is the same as playing a triangle breakout. However, the only difference is the added probability to the direction in which the price action will take. As such for the entry, we will be entering on the high or low of the candle that breaks the flag channel or the pennant triangle on a close.

flag and pennant

When playing a Flag pattern, the stop loss can be determined by taking half of the vertical width of the channel in terms of pips after entry. As for the Pennant pattern, the stop loss can be determined by half of the vertical height of the triangle after entry.

flag and pennant - Stop loss level

When playing a flag pattern, the profit taking level can be determined by the vertical width of the channel in terms of pips, from the top trendline of the downward channel. On the other hand, the profit taking level of the pennant pattern can be determined by the vertical height of the pennant in in terms of pips from the top trendline of the triangle.

flag and pennant - Profit taking level

Back to top

Pros and cons of the flag and pennant pattern strategy

The Flag and pennant pattern strategy allows the trader to be trading with the trend since it is a trend continuation pattern which renders a higher win rate. On top of that, the strategy gives a second chance to re-enter on a huge move that the trader missed out on the first time. To top that off, the consolidation of the flag and pennant pattern often gives rise to huge and powerful breakouts, though not as strong as the one that forms the pole. However, this pattern strategy is prone to many fake outs towards the end of the consolidation. Hence, it is important to confirm the breaking out of the pattern with a candle close above the trend line or channel. Subsequently, the flag and pennant pattern doesn’t naturally form in the market often, especially in higher timeframes. Even if it does form, it may be subjective to spot by traders.

Pros and cons of the flag and pennant pattern strategy

Back to top

Flag and Pennant Pattern Analysis

To find out the profitability of the flag and pennant pattern strategy, we decided to do a back test based on the past 10 trades from 9 May 21 on the H4 timeframe. The rules for entry will be the same as what was mentioned above. We will be back testing this throughout 3 types of trading vehicles, namely, EURUSD for forex, AAPL for stocks and BTCUSD for cryptocurrency. For simplicity, we will assume that all trades taken have a risk of 1% of the account.

Definitions:  Avg Risk reward ratio= ( Total risk reward ratio of winning trades/ total no. of wins)                Profitability (% gain)= (no. of wins* reward)- (no of losses* 1) [ Risk is 1%]

An example of the application of the strategy:

Flag and Pennant Pattern Analysis

For the Backtest results, trades with blue and yellow zones indicate an overall win with the blue zone as reward and the yellow zone as the risk taken.

As shown in our backtest, the win rate of this strategy for EURUSD (Forex) is 80%, AAPL (Stocks) is 90% and BTC (Crypto) is 50%

The average risk reward ratio of this strategy for EURUSD (Forex) is 1.086, AAPL (Stocks) is 1.47 and BTC (Crypto) is 1.677.

The profitability of this strategy for EURUSD (Forex) is 6.69, AAPL (Stocks) is 9.32 and BTC (Crypto) is 3.39.

Also read: Best Forex Pairs to Trade

Table Flag - and Pennant Pattern Analysis

Back to top

Conclusion for bull flag, bear flag and pennants

In conclusion, the bull flag, bear flag and pennant pattern strategy is an overall good strategy with a high average win rate, decent average risk to reward ratio and good profitability. However, it does not take occurrence in the market and when it does, it is a must to take advantage of the scenario. This pattern strategy can definitely be improved further with the help of indicators as well as support resistance lines. It is important to note that this strategy is also extremely subjective. Common mistakes traders would make is by confusing the forming of the flag and pennant patterns with ahead and shoulders or some reversal patterns forming ahead. On top of that, the usage of pending orders in this strategy is not recommended as it may lead to fake outs that can destroy one’s account. Patience is an important aspect of this strategy nevertheless.

Also read: Head and Shoulders Pattern

Back to top

Infographic

Bull flag, Bear Flag and Pennants Infographic

Back to top


ezekiel chew asiaforexmentor

About Ezekiel Chew

Ezekiel Chew, founder and head of training at Asia Forex Mentor, is a renowned forex expert, frequently invited to speak at major industry events. Known for his deep market insights, Ezekiel is one of the top traders committed to supporting the trading community. Making six figures per trade, he also trains traders working in banks, fund management, and prop trading firms.

RELATED ARTICLES

Bull flag, Bear Flag and Pennants – The Verdict

4.0
Overall Trust Index

Written by:

Updated:

January 29, 2024


Bull flag, Bear Flag and Pennants - The Verdict

Introduction to bull flag, bear flag and pennants:

In technical analysis, a pennant is a type of continuation pattern formed when there is a large movement in a security, known as the flagpole, followed by a consolidation period with converging trend lines, the pennant, followed by a breakout movement in the same direction as the initial large movement, which represents the second half of the flagpole. On the other hand, a flag is a price pattern that, in a shorter time frame, moves counter to the prevailing price trend observed in a longer time frame on a price chart. It is named because of the way it reminds the viewer of a flag on a flagpole. The flag and pennant patterns are commonly used as a confirmation for a strong trend continuation. There are typically two types of flag, the bull flag and the bear flag. The pattern serves to provide valuable information as it may increase the probability of trades taken by traders of every calibre. As the name suggests, the flag and pennant patterns usually occur as a consolidation in a steep gradient break out. Hence, this gives rise to the observable “pole” in the patterns. Though the pennant may resemble a triangle formation, the difference between the two patterns is the probability of the direction the price action is going to take.

Bull flag, bear flag and Pennants - Quick Setup Tutorial

Content

  1. Types of flag and pennant pattern
  2. Identification of flag and pennant
  3. How to use the flag and pennant
  4. Pros and cons of the flag and pennant pattern strategy
  5. Flag and Pennant Pattern Analysis
  6. Conclusion for bull flag, bear flag and pennants
  7. Infographic

Types of flag and pennant pattern

There are typically two types of flag and pennant patterns, mainly: Bullish and Bearish.

The bull flag pattern consists of an upright pole coupled with a downward channel formed at the tip of the pole.


Bull Flag pattern
Bull Flag pattern

The Bear flag pattern on the other hand consists of an inverted pole coupled with an upward channel at the bottom of the pole.

Bearish Flag Pattern

The Bullish Pennant pattern consists of an upright pole coupled with two converging trendlines forming a triangle at the tip of the pole

Bullish Pennant Pattern

The Bearish Pennant pattern consists of an inverted pole coupled with two converging trendlines forming a triangle at the end of the pole.

Bearish Pennant Pattern

Back to top

Identification of flag and pennant

A flag or pennant pattern can be found forming after a huge reversal or a break out forming the pole of the pattern. The pole is usually at least twice as large as the consolidation that is about to be formed. However, the price forming the flag pole is allowed to rest but as long as it follows a steep gradient, it is still to be counted as a valid pole. It is also important to note that if the consolidation, the formation of the pennant or flag is too huge with respect to the pole, it is not to be counted as a flag and pennant pattern.

Also read: Fibonacci Trading Strategy

Back to top

How to use the flag and pennant

The application of the flag and pennant patterns stems from the chart pattern that they consist of. For the Flag patterns it is equivalent to playing a channel break out whereas for the Pennant pattern, it is the same as playing a triangle breakout. However, the only difference is the added probability to the direction in which the price action will take. As such for the entry, we will be entering on the high or low of the candle that breaks the flag channel or the pennant triangle on a close.

flag and pennant

When playing a Flag pattern, the stop loss can be determined by taking half of the vertical width of the channel in terms of pips after entry. As for the Pennant pattern, the stop loss can be determined by half of the vertical height of the triangle after entry.

flag and pennant - Stop loss level

When playing a flag pattern, the profit taking level can be determined by the vertical width of the channel in terms of pips, from the top trendline of the downward channel. On the other hand, the profit taking level of the pennant pattern can be determined by the vertical height of the pennant in in terms of pips from the top trendline of the triangle.

flag and pennant - Profit taking level

Back to top

Pros and cons of the flag and pennant pattern strategy

The Flag and pennant pattern strategy allows the trader to be trading with the trend since it is a trend continuation pattern which renders a higher win rate. On top of that, the strategy gives a second chance to re-enter on a huge move that the trader missed out on the first time. To top that off, the consolidation of the flag and pennant pattern often gives rise to huge and powerful breakouts, though not as strong as the one that forms the pole. However, this pattern strategy is prone to many fake outs towards the end of the consolidation. Hence, it is important to confirm the breaking out of the pattern with a candle close above the trend line or channel. Subsequently, the flag and pennant pattern doesn’t naturally form in the market often, especially in higher timeframes. Even if it does form, it may be subjective to spot by traders.

Pros and cons of the flag and pennant pattern strategy

Back to top

Flag and Pennant Pattern Analysis

To find out the profitability of the flag and pennant pattern strategy, we decided to do a back test based on the past 10 trades from 9 May 21 on the H4 timeframe. The rules for entry will be the same as what was mentioned above. We will be back testing this throughout 3 types of trading vehicles, namely, EURUSD for forex, AAPL for stocks and BTCUSD for cryptocurrency. For simplicity, we will assume that all trades taken have a risk of 1% of the account.

Definitions:  Avg Risk reward ratio= ( Total risk reward ratio of winning trades/ total no. of wins)                Profitability (% gain)= (no. of wins* reward)- (no of losses* 1) [ Risk is 1%]

An example of the application of the strategy:

Flag and Pennant Pattern Analysis

For the Backtest results, trades with blue and yellow zones indicate an overall win with the blue zone as reward and the yellow zone as the risk taken.

As shown in our backtest, the win rate of this strategy for EURUSD (Forex) is 80%, AAPL (Stocks) is 90% and BTC (Crypto) is 50%

The average risk reward ratio of this strategy for EURUSD (Forex) is 1.086, AAPL (Stocks) is 1.47 and BTC (Crypto) is 1.677.

The profitability of this strategy for EURUSD (Forex) is 6.69, AAPL (Stocks) is 9.32 and BTC (Crypto) is 3.39.

Also read: Best Forex Pairs to Trade

Table Flag - and Pennant Pattern Analysis

Back to top

Conclusion for bull flag, bear flag and pennants

In conclusion, the bull flag, bear flag and pennant pattern strategy is an overall good strategy with a high average win rate, decent average risk to reward ratio and good profitability. However, it does not take occurrence in the market and when it does, it is a must to take advantage of the scenario. This pattern strategy can definitely be improved further with the help of indicators as well as support resistance lines. It is important to note that this strategy is also extremely subjective. Common mistakes traders would make is by confusing the forming of the flag and pennant patterns with ahead and shoulders or some reversal patterns forming ahead. On top of that, the usage of pending orders in this strategy is not recommended as it may lead to fake outs that can destroy one’s account. Patience is an important aspect of this strategy nevertheless.

Also read: Head and Shoulders Pattern

Back to top

Infographic

Bull flag, Bear Flag and Pennants Infographic

Back to top


ezekiel chew asiaforexmentor

About Ezekiel Chew

Ezekiel Chew, founder and head of training at Asia Forex Mentor, is a renowned forex expert, frequently invited to speak at major industry events. Known for his deep market insights, Ezekiel is one of the top traders committed to supporting the trading community. Making six figures per trade, he also trains traders working in banks, fund management, and prop trading firms.

RELATED ARTICLES

Join the Live Event
Get Your Free Ticket Now

I consent to receiving emails and/or text message reminders for this event.

REGISTER FOR THE MASTERCLASS!