
There are many technical analysis tools that traders use to predict future prices. These tools may be analytical frameworks such as Elliott Waves or indicators such as moving averages. Fibonacci retracement is another popular indicator used in the stock market, Forex, and digital currencies. Fibonacci retracement is based on the sequence of numbers discovered by Leonardo Fibonacci about 700 years ago. This article explains how to use this tool.
Also Read: Retrace Forex Trading – An Ideal Trading Strategy For Beginners
Contents
- What is the Fibonacci Retracement Level?
- How to Calculate Fibonacci Retracement Lines?
- What Are Fibonacci Retracement Tool?
- History of ElonGate
- Important Points in Fibonacci Retracements
- Conclusion
- FAQs
What is the Fibonacci Retracement Level?
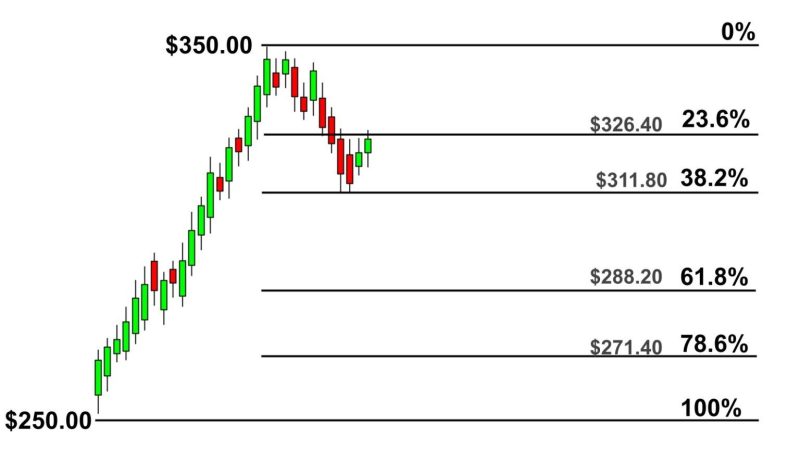
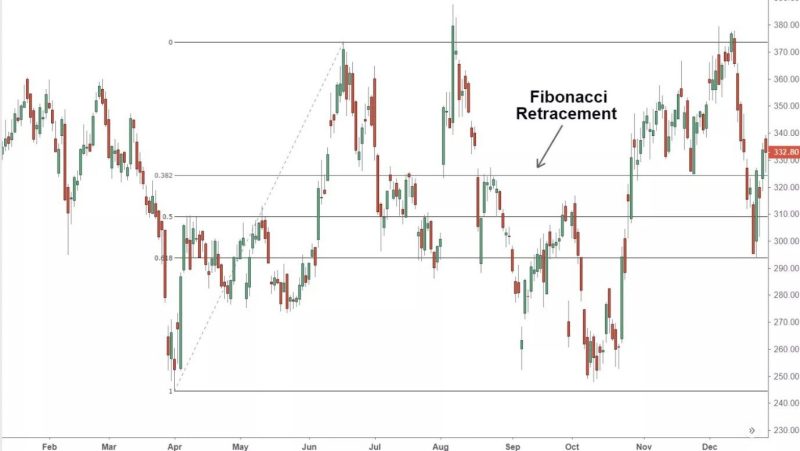
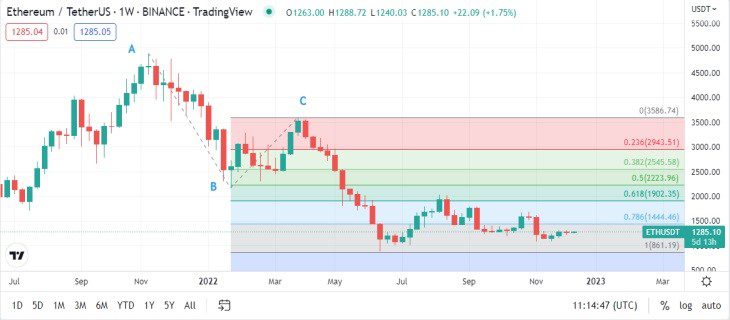
Fibonacci retracement is a tool technical analysts and traders use to find resistance and support areas on a chart. Fibonacci ratios are used as percentages. The Fibonacci retracements tool is derived from a string of numbers discovered by Fibonacci in the 13th century. Certain mathematical relationships between the numbers in this sequence create ratios that traders can used them on the graph. These ratios are as follows:
- 0%
- 23.6%
- 38.2%
- 61.8%
- 78.6%
- 87.8%
- 100%
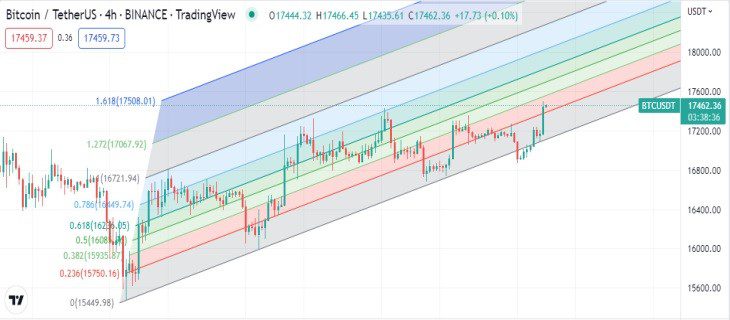
Although 50% is not one of the Fibonacci ratios, many traders consider it an intermediate point. Fibonacci retracements used outside the range of 0 to 100 are 161.8%, 261.8%, and 423.6%.
These ratios on the chart may correlate with superior levels in the market. Usually, analysts use Fibonacci retracements to find critical points such as entry and exit points or resistance and support.
This indicator is very useful; because the traders can draw it between any two desired price points (such as the highest and lowest price), and then this technical indicator will create these levels between the two desired points.
How to Calculate Fibonacci Retracement Lines?
You don't need to manually calculate these percentages in each Fibonacci Levels tool, as these are the same. But to understand these percentages, you need to know Fibonacci numbers. Fibonacci numbers are created by starting with 0 and 1; in a sequence, the next number is the sum of the previous two numbers. The sequence continues like this:
How to calculate Fibonacci numbers: 0+1=1, 1+1=2, 2+1=3, 3+2=5, 5+3=8, 8+5=13, 8+13=21, 21+13 = 34 and…
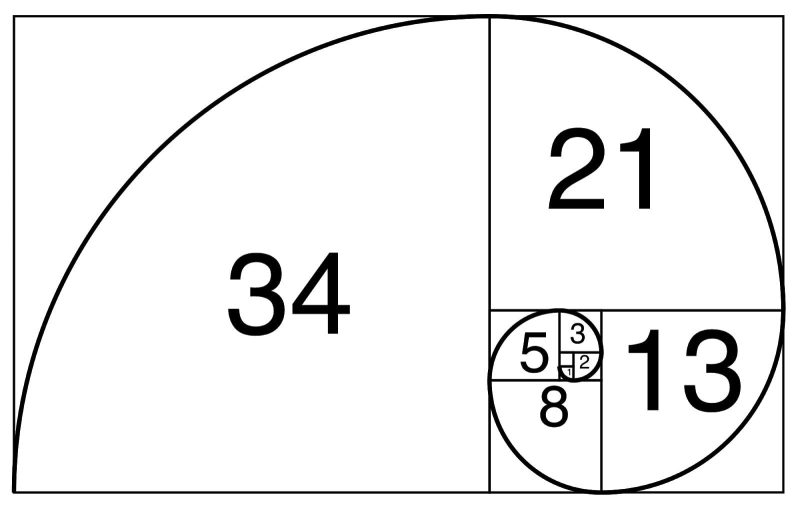
The levels used in the Fibonacci retracement tool all originate from these numbers. Except for the first few numbers of this sequence, the following numbers, there is always the relationship that if we divide the last number by the next number, 0.618 will be obtained, and if we divide each number by the number after the next number, 0.382 will be obtained. All ratios (except 50%) in the Fibonacci retracement tool are calculated based on this method.
What Are Fibonacci Retracement Tool?
Entry Orders, Setting Stop-Loss Levels, or Setting Price Targets
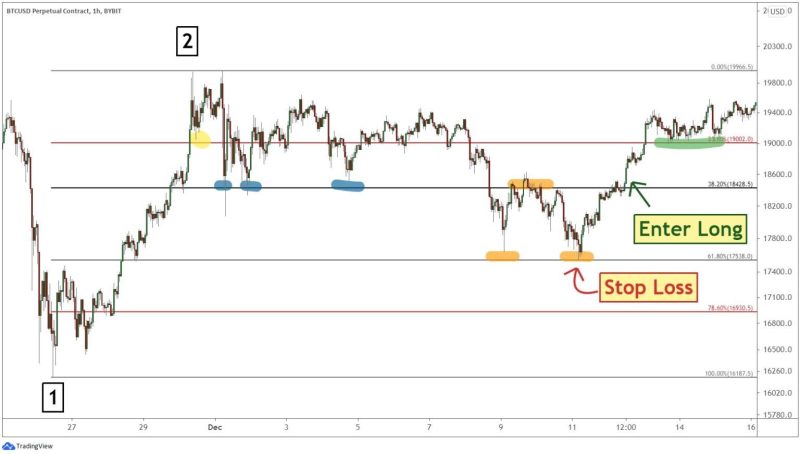
The traders can use Fibonacci retracement levels for entry orders, setting stop-loss levels, or setting price targets. For example, a trader may notice that the stock market is in an uptrend. After the price increase, it corrects to 61.8% and then increases again. Since this bounce has occurred at the Fibonacci level, the trader decides to buy. As a result, he can set his loss limit at 78.6 or 100%.
Harmonic Patterns
Fibonacci levels are also used in other technical analyses. For example, these levels are common in various harmonic patterns, such as Gartley and Elliott's wave theory. After a significant increase or decrease in price and a correction, these analyzes find that the corrections will tend to retrace back to a certain Fibonacci level.
Fibonacci retracement is used in technical analysis for all patterns and Elliott waves. For example, you can easily find your exit point using Fibonacci retracement in the head and shoulder pattern after opening a position.
Fixed Levels
Fibonacci retracement levels are fixed prices and do not change, unlike moving averages. The fixed nature of price levels allows quick and easy identification and determination. This allows traders and investors to be wise about the price reaching a certain level.
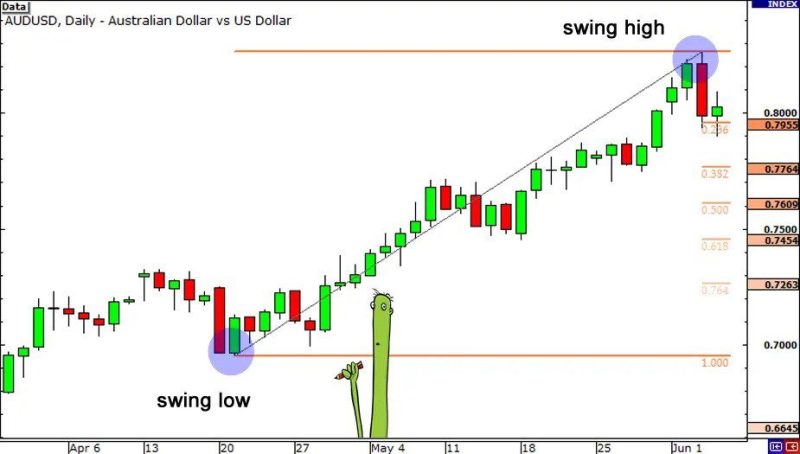
Draw Levels Between Prices Ranges
The Fibonacci retracement tool is used to draw levels between price ranges. In this case, two low and high price points are considered, and the Fibonacci retracement is drawn between these two points. This tool can also be used to draw important levels outside of this price range.

Determining Strategy and Trading Style
Traders can use Fibonacci retracement to gain information on entry points, exit points, stop loss, etc. How to use these levels depends on the strategy and trading style. Some strategies involve profiting from the range between two specific Fibonacci levels.
Fibonacci retracement is often combined with Elliott wave theory, which can be very useful in finding connections between wave structures and potential resistance and support areas. Like other technical analysis tools, this tool should be combined with other tools and not be relied on alone. These technical analysis tools should be combined with attention to the market environment and fundamental factors for analysis.
Also Read: What Is The Fibonacci Circle?
Important Points in Fibonacci Retracements
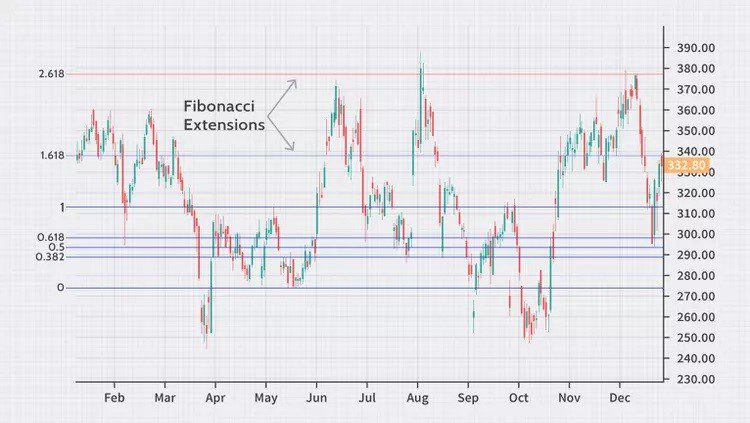
Fibonacci Retracement Level and Fibonacci Expansion; the Differences
Although the Fibonacci retracement level applies percentages to the decline, the Fibonacci extension applies percentages to the trend reversal. For example, the price of a share increases from $5 to $10 and then to $7.50. Changing the price from $10 to $7.50 is a correction. An expansion has occurred if the price rises again and reaches $16.
Limitations of Fibonacci Retracement Levels
Although correction levels indicate possible price support and resistance levels, there is no guarantee that prices will reach or stay at the predicted value. This is why other confirmation signals are often used as well.
Another area for improvement with Fibonacci retracement levels is that too many exist, and the price trend can reverse near any of them. The problem is that professional traders need clarification about which correction level will be useful in their analysis.
Fibonacci Retracement Pros and Cons
This tool has conceptual and technical drawbacks that traders should be aware of when using it. The basic principle of any Fibonacci tool is a numerical anomaly that is not based on any logical reason.
Ratios, integers, sequences, and formulas derived from the Fibonacci sequence result from a mathematical process. This does not make Fibonacci trading inherently unreliable. However, it is frustrating for traders who want to understand the logic behind a strategy.
In addition, a Fibonacci retracement strategy can only point to potential corrections, reversals, and bounces against the trend. This system requires other indicators for confirmation and does not provide easily identifiable strong or weak signals.
Conclusion
Fibonacci numbers are everywhere, and many traders believe they are relevant when charting financial markets. However, as with all technical indicators, the relationship between price action, chart patterns, and indicators is not based on any scientific principle or physical law. The usefulness of the retracement Fibonacci tool may be related to the number of market participants who pay attention to it.
Therefore, even though retracement Fibonacci levels are not necessarily associated with anything tangible, they can predict important areas. The Fibonacci retracement tool is one of the most powerful tools in a trader's toolbox. This tool can help traders identify hidden levels of support and resistance to better time their trades. However, this tool is not error-free and could be more effective on cryptocurrencies with small market capitalization. In addition, it is difficult to determine which surface is best to use.
FAQs
What is the Fibonacci Retracement Level?
A Fibonacci retracement is derived from a string of numbers with certain mathematical relationships between them and creates ratios that can be used on a chart. These ratios are 0%, 23.6%, 38.2%, 61.8%, 78.6%, 87.8%, and 100%.
How to Calculate Fibonacci Retracement?
Fibonacci numbers are created by starting with 0 and 1; in a sequence, the next number is the sum of the previous two numbers. This sequence continues in the same way. Except for the first few numbers, there is always the connection that if we divide the last number by the next number.
What Are the Uses of Fibonacci Retracement Levels in Technical Analysis?
Entry orders, loss limit levels, or determination of price targets and harmonic patterns are among the applications of Fibonacci retracement levels in technical analysis.
What Are the Differences between the Fibonacci Retracement Level and Fibonacci Expansion?
Although a Fibonacci retracement level applies percentages to price declines, Fibonacci Expansion applies percentages to trend reversals.
What Are the Limitations of Using Fibonacci Retracement Levels
Although correction levels indicate possible price support and resistance levels, there is no guarantee that prices will reach or stay at the predicted value. Another area for improvement with Fibonacci retracement levels is that too many exist, and the price trend can reverse near any of them.
What Are the Disadvantages of Fibonacci Retracement
The basic principle of any Fibonacci tool is a numerical anomaly that is not based on any logical reason. It can be frustrating for traders who want to understand the logic behind a strategy.


