Market retracement is a relatively simple concept to define and comprehend. Simply put, it is the time when the price reverses a recent move in either an upward or downward direction. Consider “retracing your steps” or returning the way you came. In essence, a recent price move has been reversed.
Retracements provide the chance to place market entries at a “better price,” as well as the best location for stop losses and enhanced risk-reward scenarios. Retrace entries are viewed as “safer” entry types because they are more cautious than “market entries,” for instance.
The retracement entry is a tool that enables you to do all three of a trader's ultimate objectives: obtain the best entry price, effectively manage risk, and increase returns.
This guide will teach you how the retrace strategy works in forex trading, including examples, pros, and cons.
Also Read: Throwback Trading on Stock Market
Contents
- What Is A Retrace Trading?
- Retrace Trading Using The Fibonacci Retracement Tool
- Advantages Of Retrace Trading
- Limitations Of Retrace Trading
- Bottom Line
- FAQs
What Is A Retrace Trading?
Retracements are short price swings that reverse an overall trend. It is essential to remember that this price reversal occurs for short terms and does not portend a change in the overall trend.
The long-term trend depicted in the chart below is still present despite the retracements. The stock's price is still rising.
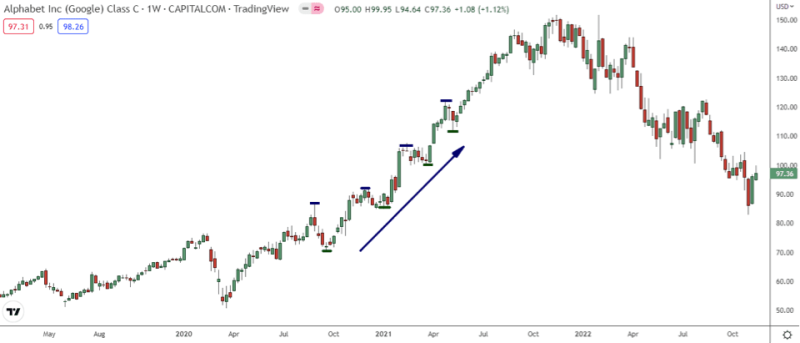
When the price trend rises, it sets a new high (blue); when the stock price declines, it rises before hitting the previous low (red). One of the characteristics of an uptrend is movement in the direction of higher highs and higher lows. The trend is upward while that is happening.
Retrace Trading Using The Fibonacci Retracement Tool
The Fibonacci retracement tool uses the mathematical relationship found in the Fibonacci sequence to plot the percentage retracement level. The support and resistance levels provided by these retrace levels can be used to set price moves.
Trading professionals can use the Fibonacci retracement tool to find support and resistance levels. Many traders can place orders, determine stop-loss levels, and set price retraces using their gathered information.
Fibonacci Retracement Levels As Support And Resistance
Any forex trader will tell you that they support one indicator over another. They will present their case for why their particular preferred indicator is the one you should focus on most. It comes down to using the indicators you have at your disposal to maximize your trading, as you know that many different indicators are useful in forex trading. To create a successful strategy, you must combine them in a way that makes sense.
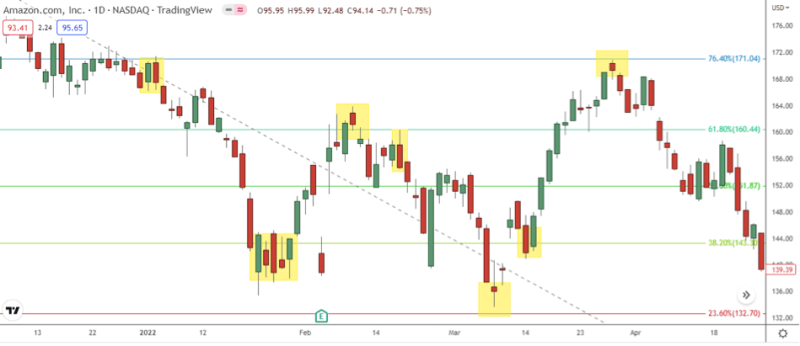
You can quickly see how a given currency pair has performed over the time scale that you've set up for it when you add the Fibonacci retracements across an active chart showing the current moves of the pair. More significantly, you can see any potential areas of support or resistance.
It might be time to place a trade that responds to that data if the most recent candlesticks on the currency pair are touching one of the support or resistance levels depicted on the Fibonacci tool that you have laid out.
Find a recent high or low swing and use that as your starting point to set up the Fibonacci tool. Lines of support and resistance are automatically drawn for you when you drag the Fibonacci tool across the length of the chart you are viewing. These data points can be used to determine the best times to enter a trade.
Also Read: Fibonacci Trading Strategy Full Verdict
Advantages Of Retrace Trading
- Higher Possibility Entries: The price chart will likely continue going the way of the initial move after a pullback or retrace because that is how they work. As a result, if you see a substantial price action signal inside a retracement zone, it's a very high-probability entry since all indications are that the price trend will bounce from that level. The highest-probability way to trade is to wait for a pullback to the level with a signal, though this doesn't always happen.

- Lower Premature Stop-Out Rates: With a retracement, stop-loss placement is more flexible. Essentially, you can move the stop closer to any area of the chart that is most likely to be hit. Stops placed farther from pivotal levels, moving averages, or, for example, farther from the high or low of a pin bar increase the probability that the trade will succeed.
- Greater Risk and Return: Retracement entries, on the other hand, theoretically allow you to set a narrow stop loss for the trade since you're entering near a key level or, in the case of a trade entry trick entry, at a pin bar 50% level. As a result, if you decide to do so, you can set a stop relatively closer than if you entered a trade that did not occur following a pullback or if you did so at the high or low of a pin bar.
Limitations Of Retrace Trading
- Additional Missed Trades: Sometimes, when waiting for a retracement that doesn't materialize, good trades “get away.” Even the best traders will find this annoying, which can test your senses and trading mindset. But believe me when I say that missing out on a few trades is preferable to overtrading; it's not the worst thing in the world.
- Generally, Fewer Trades: Financial markets frequently fail to retrace sufficiently to initiate the more cautious entry that results from a pullback. Instead, they might continue with a few backtracks. As a result, you will have fewer opportunities to trade overall than someone who doesn't primarily watch for price retraces.
Bottom Line
Recognizing retracements is a crucial skill for use in the forex market. They don't have to be at Fibonacci levels to benefit you, but a pullback at a Fibonacci level is frequently twice as powerful. Enter your charting software and choose the Fibonacci retracement tool to draw Fibonacci retracement levels. Draw a line from the current swing high or low to the other. You will receive an automatic calculation and display of the Fibonacci levels.
Two Fibonacci levels on the chart may overlap if you choose two or more swing highs and lows and draw the levels twice for each pair of extremities. This is known as confluence. This may serve as a level of support or resistance that is especially strong. If you have a setup, price retracements from a Fibonacci confluence can present an opportunity for high-yield Forex trading.
FAQs
How do You Identify Retracement in Forex?
Retracement detection can be done by using Fibonacci values. Price retracement levels typically stay around 38,2% 50.0% – 68.15% Fibonacci – retracement levels but are still rising overall. When prices drop below these values, they may signify an inverse trend.
Why do Markets Retrace?
What's the importance of retraping the route? This allows them to enter the market at the cheapest possible price, provide optimal stops and rewards and improve returns. Retracement entries are less expensive than the Market Entry example and are viewed as a more accessible entry type.
How Long does a Retracement Last?
Retracements are usually made in two to three weeks, and reversed actions can last for many months. The candlestick chart shows many indecision candles shaped with long tails and topped. Nevertheless, a reversed candle is shown with alternating patterns, such as engulfing or soldier patterns.
Is Retracement the same as Pullback?
In some cases, a pullback is very similar to retracement. Typically pullbacks occur when pricing drops relatively short in duration: a few consecutive sessions.
Do I Need to Verify a Price Movement Before Entering a Retrace Trade?
While anticipating retrace trading opportunities, you must verify whether the current price movement is a retracement or identify reversals.
In retracement trading, we focus on trend-following entries from a pullback position. Whereas reversal trading reflects counter-trend entries, which are placed against the current trend considering the market has changed the current trend direction.