
Contents
- What is Force Index Indicator?
- How Does Force Index Works?
- Calculation of the Selling Pressure of Rising Force Index
- Interpreting the Positive Force Index and Negative Force Index
- How to Use the Force Index Indicator?
- Meaning of Volume and Flattening Index
- Examples of Force Index
- Final Thoughts
- FAQs
What is Force Index Indicator?
Force Index is one of the oscillator families that fluctuates between positive and negative territory, and deals with technical analysis. It uses volume and price to measure the power responsible for the movement and identification of potential turning points. The Elder Ray index also assesses the power of bulls behind rallies and bears behind declines.
The elder force index indicator has 3 vital components that explain the trading volume, the direction of price change, and the extent to which price changes.
With the elder’s force index in play with a moving average, the result is likely to amount to a substantial change in the bulls and bears power.
With the technical analysis, it is safe to say that Elder was looking towards a great amount of success by combining the moving average, solitary indicator, and his force index.
Force index is the comparison between the current price and the prior price, and the result is multiplied by the volume of that period.
Large force index is in conjunction with strong price moves and high volumes. Note that a force index that is neither high nor low is a result of price moves without volume.
Also Read: How To Use The TDI
How Does Force Index Works?
By calculating the previous day’s close from the present-day close, and multiplying the outcome by the present day’s volume, you get the force index.
The force index is said to be positive when the closing price of the present day is higher than that of yesterday. But the force index is negative if the closing price is lower than the previous day.
A large change in volume and price determines the strength of the force index. Therefore, the value and change in the force index can be influenced independently by both situations.
A histogram represents the raw value of the force index directly and its centerline is fixed at zero. Note that a positive force index would be as a result of a higher market and it is strategized just above the centerline.
While the negative index would be a result of the lower market, and it is strategized just below the centerline.
The force index can be directly on line zero with the unchanged market in position. On the histogram, the raw line that is planted on the day to day creates a jaggedness, but the line gets smoothed out by a moving average.
So, you might want to engage in a 2-day exponential moving average at a minimum. You might also want to get an EMA just for smoothing on a suitable level.
Calculation of the Selling Pressure of Rising Force Index
To calculate a one-period force index use this formula: Force Index (x) = [(current period) – Close (prior period)] x Volume.

The exponential moving average formulates the one-period force index. Previous statistics points are gotten from the formula above are to be used. The indicator is also calculated as an average of the values been succeeded.
The more current statistics carry more weight than the previous ones as the exponential moving average is in place.
The technical indicator is calculated thus: Force Index (n) = n-period exponential moving average of force index (x).
The default setting on the charting software is a 13-period exponential moving average because it was recommended by Alexander Elder. But the setting can be changed depending on the input of the user.
Interpreting the Positive Force Index and Negative Force Index
With the force index generally, when the 2-day EMA is negative traders will have to urge to buy, but sell when it is positive.
There is a principle called the overarching principle of trading that goes in the direction of something called the 13-day EMA of prices. Traders should keep this in mind.
This 13-day EMA principle is known as a long-term indicator. The market bulls exert great force when the indicator crosses above the centerline. While the bears control the market when it is negative.
The divergences between prices and the 13-day EMA of the force index are of importance. Specific points correspond with this divergence and indicate the turning points of the market as vital.
The extent to which the bull or bear triumphs depends on the change between the previous day’s and present day’s close; this is indicated by closing prices of the market.
To give a better approach to the extent to which the bulls and bears triumph, volume is added to the calculation.
How to Use the Force Index Indicator?
The force index is an indicator that can be used in various ways, and confirming the ongoing trend is one of them.

This can be done by using a long and short force index. Most traders prefer 13 to 30 as the number of days for the force index.
During this trend, there are two indexes to be considered. There is an indication that the pair will go upwards when it is over the centerline.
The force index can also be used when combining it with some other indicators, such as the relative strength index and the moving averages.
Also Read: Best Technical Indicators for Day Trading
Meaning of Volume and Flattening Index
As driven by the authority of bulls and bears, the volume of force index shows the degree of propulsion that exists in the market. Combining volume and price to a readable figure is the job of force index as an indicator.
The force index hitting a new high gives way to the continuance of an uptrend. For hitting a new low, the downtrend becomes sustainable while superior strength is given to the bears.
A flattening force index means that a significant change of price in the market is neither back by a declining nor rising volume data.
It also means that the supposed trend is about to take reverse. Taking the meaning from another perspective, flattening force indicates a trend reversal only if high volume correlates with little movement in the prices of things.
Examples of Force Index
These examples would be focused on long and short trades.
For Long Trades
- Trade exited when the EMA becomes neutral or the force index less than
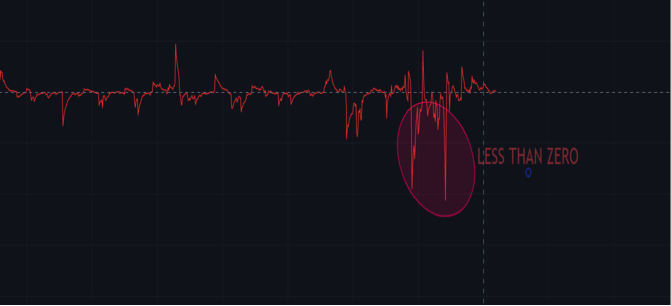
- Force index increase or index EMA positively sloped.
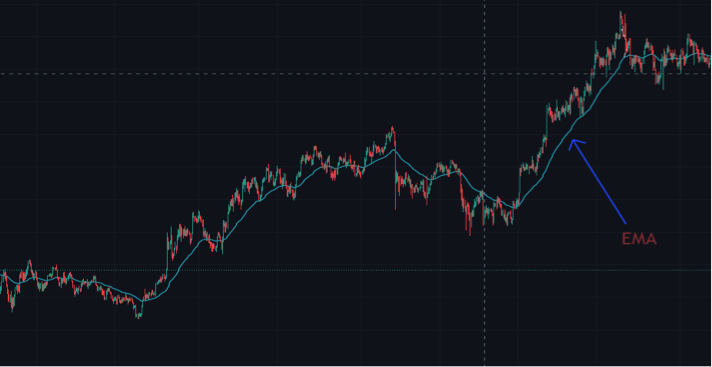
- EMA of price positively sloped.
For Short Trades
- Trade existed when the EMA becomes neutral or greater than zero.
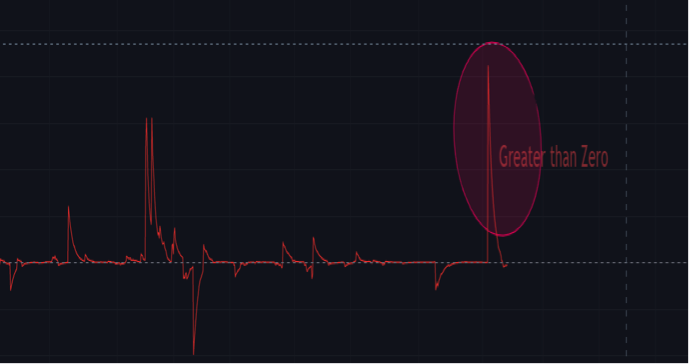
- Falling force index decrease or index EMA negatively sloped
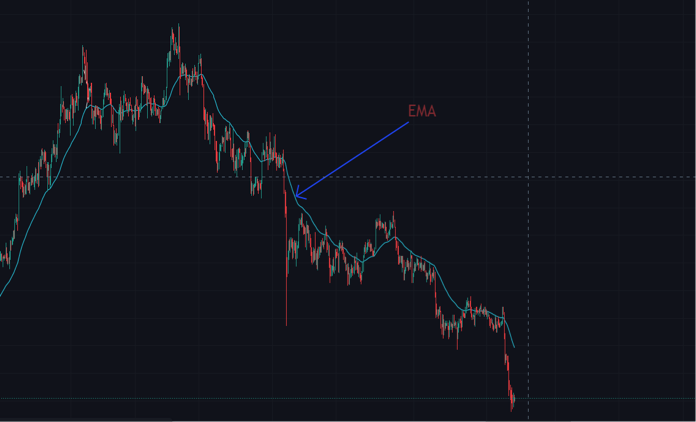
- EMA of price negatively sloped.
Final Thoughts
The Force Index was created to help traders understand how price is likely to move based on volume. Despite being an oscillator, the indicator isn't designed to detect “overbought” or “oversold” conditions. Rather, it is essentially a trend-following phenomenon.
Only the daily chart and higher time compressions should be used with it. On a sub-daily time chart, the inputs such as the daily high and low, aren't captured by default.
Longer-term traders should utilize longer timeframe settings because they may hold positions for weeks or months (e.g., 50 periods or above).
Shorter-term traders, who may hold positions for only a few days, may benefit from shorter period settings (e.g., below 20 periods).
Because oscillators and other indicators that require past data are lagging by nature, the index should not be used on its own.
Other indicators and methodologies, such as moving averages and looking at the price itself, can aid in better filtering signals offered by the force index alone.
FAQs
What does force index do in SQL?
The force indicator works similar to the USE index (index list), except for an expensive table search. A table scan is used to identify data if a table does not contain any of the names of the indexes.
What is Elder’s force index?
The Alexander Elder Force Index is a trend indicator designed to evaluate the current buy-sell activity of a firm. The force index is computed by subtracting yesterday’s closings and now closings and multiplying the results by today’s volumes.
Who developed the force index?
The Force Index is a tool created and developed in the classic book Trading with a Living. Accordingly, a market movement is dependent upon 3 fundamental factors. They are the direction of price change, the extent of the change, and trading volume.
How do I use the EFI indicator?
Using the EFI indicator involves confirming an ongoing trend and combining it with other indicators. These are the two ways to use the force index.


