Harmonic patterns are technical analysis formations that can assist traders in analyzing price activity and forecast where prices may go. A trader can forecast where and how much the cost of an item will move by analyzing harmonic waves in price charts.
Like all other pattern types, Harmonics are most effective when traded after they are produced. A common mistake is to predict the formation of a pattern and start trading based on it before it has fully developed. Harmonics demand patience, but when applied correctly, they offer excellent insight into anticipated future price fluctuations.
This article examines how to spot patterns on trading charts and trade them using our Next Generation online trading platform's sophisticated drawing capabilities.
Also Read: Harmonic Patterns: A Complete Guide
Contents
- What Are Harmonic Patterns?
- Types of Harmonic Patterns
- How to Draw Harmonic Patterns?
- Harmonic Chart Patterns Rules
- Why Are These Patterns Important?
- Best Harmonic Patterns in the Trading world
- Harmonic Pattern Indicators and Fibonacci Ratios
- Bottom Line
- FAQs
What Are Harmonic Patterns?
Harmonic patterns are defined as a pattern created in 1932 by H.M. Gartley. Gartley wrote about a five-part wave called “Gartley” in his book Profit in the Stock market. Larry Petersavent re-written the Fibonacci ratios to make the trade for the Gartley pattern more efficient and more accurate.
Scott Carney developed this pattern, including crabs, bats, sharks, and 5-0. They also gained invaluable knowledge of their trading principles, validity & risk management.
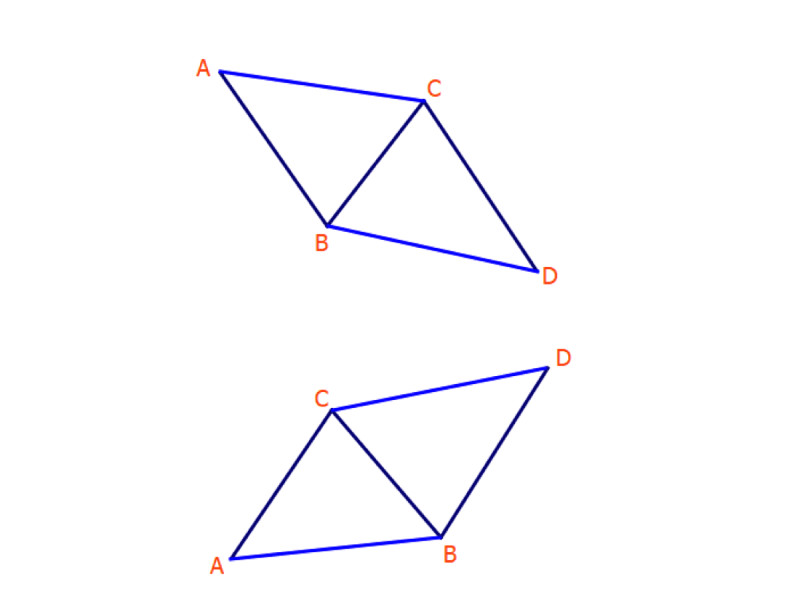
This Gartley pattern below demonstrates a five-point bullish pattern. This structure is similar to a pattern “M” / “W” and defines five pivot points. A Gartley system is constructed of 2 retracements or two impulse swings in a 5-point shape.
The swing is inverse and linked by Fibonacci ratios. The center of a pattern is the “B,” which defines the formation, and the “D” is the point at which trade is initiated. It displays trade entry stops and target levels in D.
This chart demonstrates a 5-point harmonic pattern (Butterfly Bearish). The structure resembles the above 5-point Gartley patterns except for the reverse.
Also Read: Gartley pattern
Types of Harmonic Patterns

While several types of harmonic patterns exist, few have remained in use for some time due to the frequency with which they appear in prices. The following sections will be explored and will show you the difference.
Harmonic AB=CD pattern
The AB=CD pattern operates somewhat differently from the rest. In a bullish pattern AB=CD: The above example shows bearish patterns in AB=CD in the daily gold charts. The proportions were identical. The CD line is the same as line ABC in which dotted lines show possible reverse zones. The chart shows that. When prices close, traders can go short and enter the market once they drop out of the market. ABCD structure can also form Bat Harmonic Pattern.
The Gartley Pattern
A Gartley pattern is a harmonic pattern that precedes an essential low or high. As noted in the previous article, the pattern is a creation of Harold McKinley Gartley. The patterns are based on the number of pages in Jacques de Gaulle's book Profits in stock trading. The pattern usually occurs after corrections occur in a general trend. The bearish Gartley pattern resembles an ‘M' while bearish pattern designs form ‘W.'
Butterfly Pattern
Butterfly patterns are usually found after a trend change and are reversed. Bryce Gilmore conceived it and contained five parts: X, A, B, C, and D in its initial form. Here are the schematics of the butterfly pattern.
The pattern has two forms. The bullish butterfly indicates when a trader should buy, and the bearish butterfly pattern aids in trading and helps to determine if current moves are over. The bearish butterflies have the following characteristics to distinguish themselves. Traders can target entries at or above the D-price level from Point D.
Cypher Pattern
Cypriots have five touchpoints and four movements or legs. Each touch point represents the potential reversal zone, and each leg shows the price action of each point. This model uses Fibonacci in varying ratios (usually below), creating steeper images.
A qualified Cypher pattern includes an impulse leg (XA), followed by a retracement leg (AB) whose retracements reach an XA leg retracement of 39 %.9% Fibonacci. The structure may turn out as both a retracement and continuation pattern. When appropriately manipulated, it can achieve an impressive strike rate and a pretty good average reward-risk ratio.
The Crab Pattern
Scott Carney developed and published this pattern, considered one of the best harmonic patterns for trading. Its reverse structure has four legs, numbered X, B, and X. Carney says a significant benefit of using crab waves over other patterns is the high risk/profit ratio. Since these setups enable very close stops, it lets investors access markets at incredibly low or high prices.
The Bat Pattern
Scott Carney found the striped broom pattern at the end of the 20th century. Like a Crab pattern, the Bat pattern consists primarily of a reverse-progression structure. It consists of a temporary reverse of a trend which then continues in its original course. It helps the trader enter the trend at an attractive price immediately after it ends.
Shark Patterns
Similarly, shark patterns have harmonic waves in everyday use. It is a more recent harmonic trading system that traders have used since 2011. The patterns are named for their sharp edges and shallow dips in the middle, forming a chart-like dorsal fin.
How to Draw Harmonic Patterns?
Harmonic patterns are drawn using lines that connect X and A, and B and C, plus C and D. Then, it is possible to use the tools to mark the waves and, if you want, to add a reference. Some people prefer a triangle tool instead of a trend line that highlights a chart's waves and helps estimate the trend's retracements.

Harmonic Scanners
The Harmonic Pattern Scanning System recognizes different patterns in their formation and completion. The scanning machine can identify possible trading setups by identifying the patterns in its database.
When you flip the structure, some harmonic patterns appear like triple tops or bottoms, so a scanner helps find them. The harmonic pattern may have been identified through the wave search function. Before trading, you should look into pattern requirements, including level and structure.
Harmonic Chart Patterns Rules
Unlike traditional chart patterns like triangle head/shoulder and wedge, a harmonic pattern has specific movements for validity and traceability. It eliminates some of the subjectivity of traditional chart patterns allowing for more objective transactions. Fibonacci retracing extensions require movements. Knowledge of Fibonacci tools is, therefore, a requirement for trading harmonics,

Why Are These Patterns Important?
A key role harmonic patterns play in price prediction. In the past days, traders had to learn the Fibonacci coefficient to calculate future price movement for financial products. Harmonically patterning is essential to identify reversed events. These are exact tools that describe incredibly particular price movements.
Harmonic Price Patterns
Using the Fibonacci number to pinpoint exact turning points, harmonic price patterns elevate geometric price patterns to a new level. In contrast to other more popular trading strategies, harmonic trading aims to forecast future moves.
Let's examine a few illustrations of how harmonic structures are applied to currency trading on the FX market.
Harmonic Patterns in Forex Trading
As mentioned, harmonic patterns may be traded in any market and are commonly used in forex trades because they allow more waves in every time frame to emerge. The harmonic pattern is often present within the currency markets since it trades a 24-hour day. It implies patterning is possible on lower timeframes, including a single-hour chart, five-hour chart, 15-minute chart, etc.
Best Harmonic Patterns in the Trading world
The traditional chart shows several harmonic patterns, including bats, Gartley butterflies, 5.0 crab, AB=CD pattern, and more. Both these have bullish and bearish pattern variations. It indicates pattern formation can increase a rise significantly or fall in the prices if the pattern is turned around.

Several patterns have specific shapes and particular Fibonacci ratios – which must be satisfied if a specific pattern is valid and projected. Harmonical structures are applicable in all financial markets, including stocks, commodity, and forex markets.
Harmonic Pattern Indicators and Fibonacci Ratios
The key technical indicators in harmonic trades include Fibonacci retracements tools and several other indicators. It helps validate the pattern wave patterns and identifies possible profit targets after completing the formations. When the first waveforms, you may want to use Fibonacci retracement tools to check the following wave sizes to conform to the patterns.
Harmonic trading combines patterns and math to create a precise trading method. The fundamental principle behind this methodology lies in the first ratio (0.618 or 1.518). Complementing ratios: 0.38, 0.5, 1.42, 2.25 – 2.23 – 2.518 – 3.17, and 3.618.
The primary ratio is found in practically every nature-like structure and event, and it's also found in modern harmonic structures. Because patterns repeat throughout life and society, the ratio has also been found in the financial markets, which depend on their trading conditions.
All discussions about harmonic patterns must include Fibonacci numbers because this pattern uses the Fibonacci ratio extensively. Fibonacci numbers can be found all across the universe.
The basic Fibonacci ratio (Fibonacci ratio) and Golden ratio (1.648) are used. Fibonacci Numbers are numbers with numbers whose sum is equal to previous numbers. The Fib Numbers series starts in these terms.
Pattern completion zone (PCZ)
The harmonics pattern is defined as a complete pattern zone (PCZ). PTZs are price clusters based on the full swinging convergence between Fibonacci extension retracement and price projections. Most patterns finish their CD leg at PCZ, then reverse. Trade is predicted in this zone with price adjustments.
For example, the pattern completion zone (PCZs) for the Bullish bat pattern can be constructed using a Fibonacci extension and projection: 0.78 XA 12.7 BC 12.6 BC AB = CD. Here is the idealized potential completion zone.
Bottom Line
Every trader aspires to achieve trading success. Learning how to trade the market using harmonic patterns is not difficult. If appropriately plotted, they are one of the most beneficial waves. But remember that harmonic trading has a few inherent problems and is a discipline-demanding, rule-based approach.
Ensure to pay attention to supporting and resistance levels to increase the dependability of patterns. To boost your confidence, pair this with a price movement reversal pattern like bullish or bearish engulfing. Finally, keep in mind to set your goal and stop loss levels at appropriate price points.
FAQs
What Are Harmonic Patterns?
Harmonic patterns refer to price structures that are a component of a trading technique. Traders can identify pricing trends and solid market entry positions by anticipating future market moves.
What Is The Most Profitable Harmonic Pattern?
The Gartley, Crab, and Bat harmonic patterns are three of the most popular among technical analysis traders.
How Many Harmonic Patterns Are There?
The primary harmonic patterns are five-point patterns (Gartley, Shark, Crab, Bat, Butterfly, and Cypher). These waves contain 3-point (ABC) or 4-point (ABCD) structures.
Are Harmonic Patterns Profitable?
Harmonic pattern trading is profitable only in cases where traders know the trading principles through extensive practice. The main risks with waves can be identified to determine the patterns. Generally, the trader finds it difficult to see harmonic structures within the chart.