Gartley pattern
The Gartley pattern is a harmonic chart pattern, based on Fibonacci numbers and ratios, that helps traders identify reaction highs and lows. In his book Profits in the Stock Market, H.M. Gartley laid down the foundation for harmonic chart patterns in 1935. The Gartley pattern is the most commonly used harmonic chart pattern. Larry Pesavento later applied Fibonacci ratios to the pattern in his book Fibonacci Ratios with Pattern Recognition. The Gartley pattern is one of many advanced pattern trading strategies that harmonic traders use. It is highly specific and doesn’t occur frequently in the market, however, being patient and waiting for a harmonic pattern set up to take place can be highly rewarding as it would lower the risk of taking the trade since it is so precise in its Fibonacci measurements. Due to its complexity, it is not recommended for beginners to use this or any harmonic pattern strategy, however, it is definitely an advanced strategy to look into.
Gartley Pattern – Quick Setup Tutorial
Content
How to use
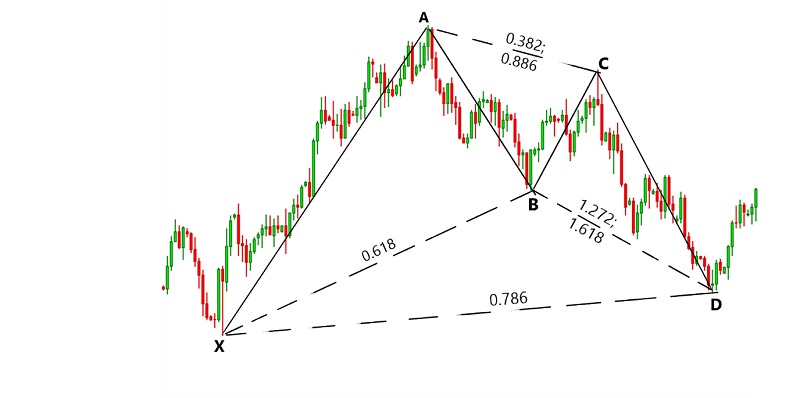
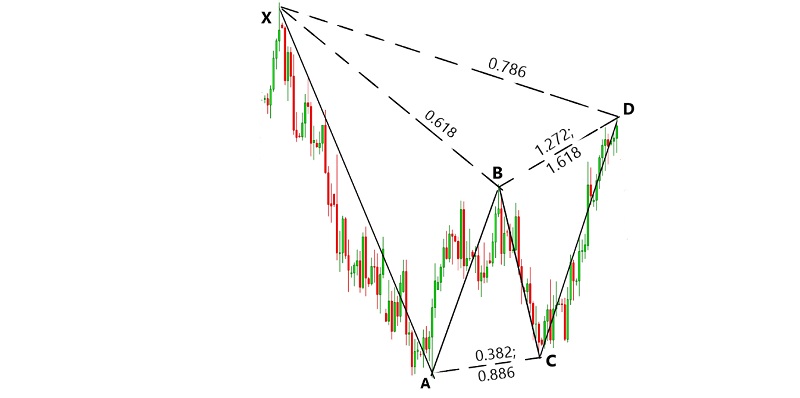
The Gartley pattern requires knowledge from the Fibonacci retracement tool and a bit of the Elliott Wave’s theory. The Gartley pattern comes in two forms: the bullish, shaping like the letter “M” and the bearish, shaping like a letter “W”.
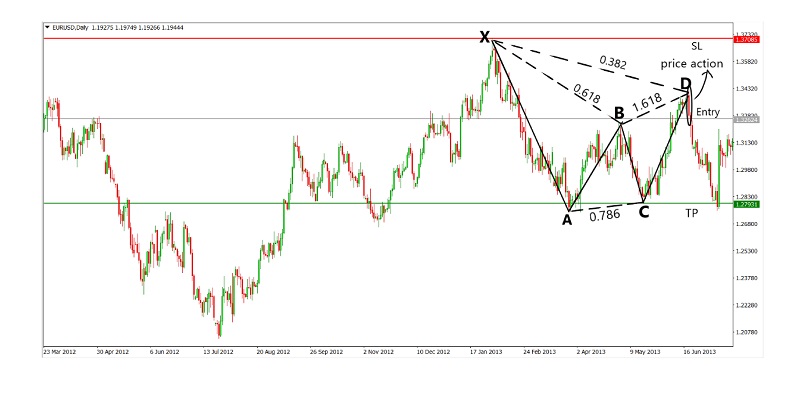
To identify a Gartley pattern, it must have 5 points, which we would identify as X, A, B, C and D. The 5 points are part of an Elliot wave movement from motive to corrective phase, with CD as the start of a reversal.
For the bullish Gartley pattern, XA is the impulse wave 5 of a bullish Elliott wave. Point B must retrace to 61.8% of XA, with AB forming corrective wave A. Point C must be at 38.2% retracement from XA and 88.6% retracement of AB. BC then forms the corrective wave B. Lastly, point D can be either 127.2% or 161.8% extension from AB but at the same time, fulfils a 78.6% retracement from XA. CD then forms the corrective wave C.
Also read: Fibonacci trading strategy
For the bearish Gartley pattern, it is the opposite of its bullish counterpart. XA is the impulse wave 5 of a bearish Elliott wave. Point B must retrace to 61.8% of XA, with AB forming corrective wave A. Point C must be at 38.2% retracement from XA and 88.6% retracement of AB. BC then forms the corrective wave B. Lastly, point D can be either 127.2% or 161.8% extension from AB but at the same time, fulfils a 78.6% retracement from XA. CD then forms the corrective wave C.
Trade rules
After identifying the Gartley pattern, we will be looking for a trade depending on whether the pattern is bearish or bullish.
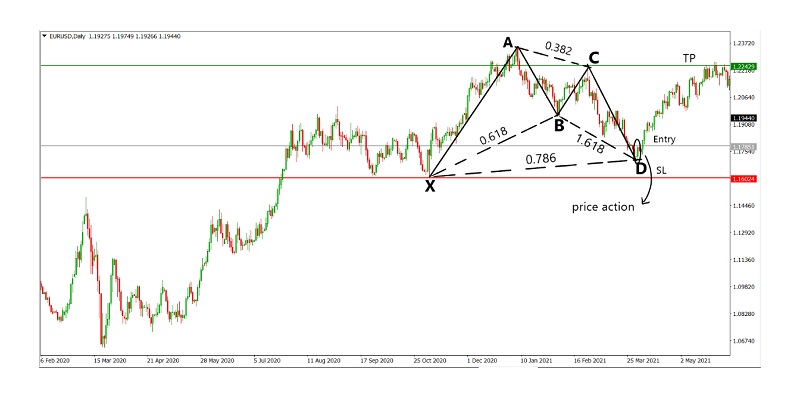
For a bullish set up, the entry is determined by price action. The stoploss can be put at point X or the 100% retracement of XA. The profit taking level can be taken at point C.
For a bearish set up, the entry is determined by price action. The stoploss can be put at point X or the 100% retracement of XA. The profit taking level can be taken at point C.
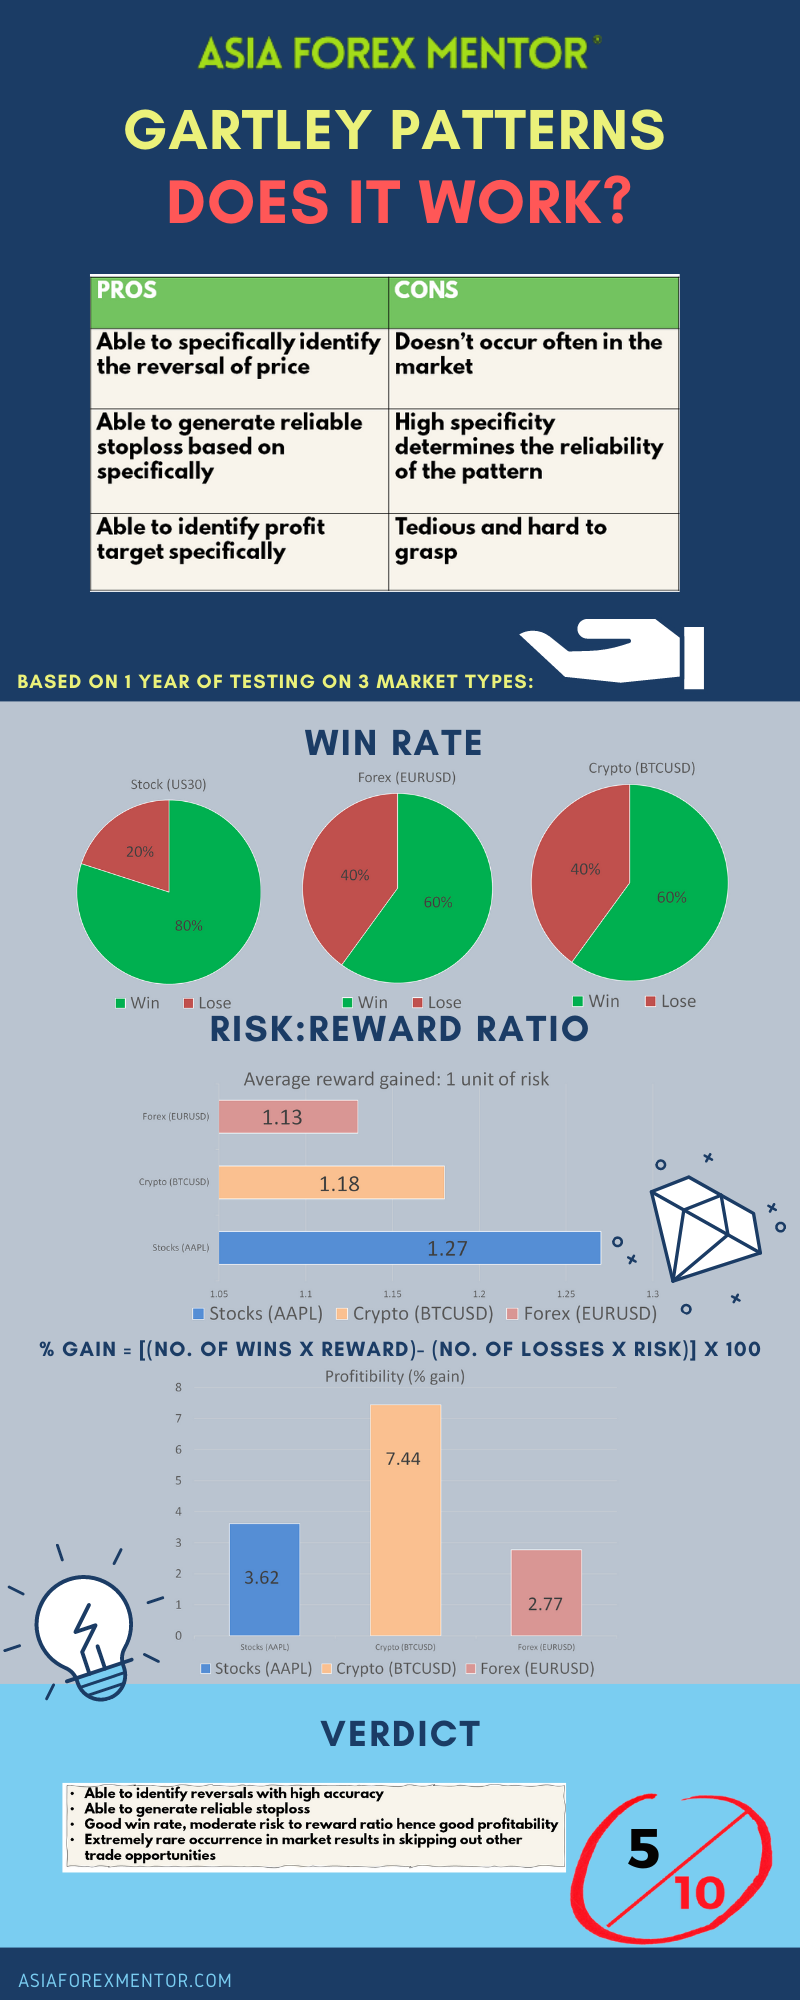
Pros and cons
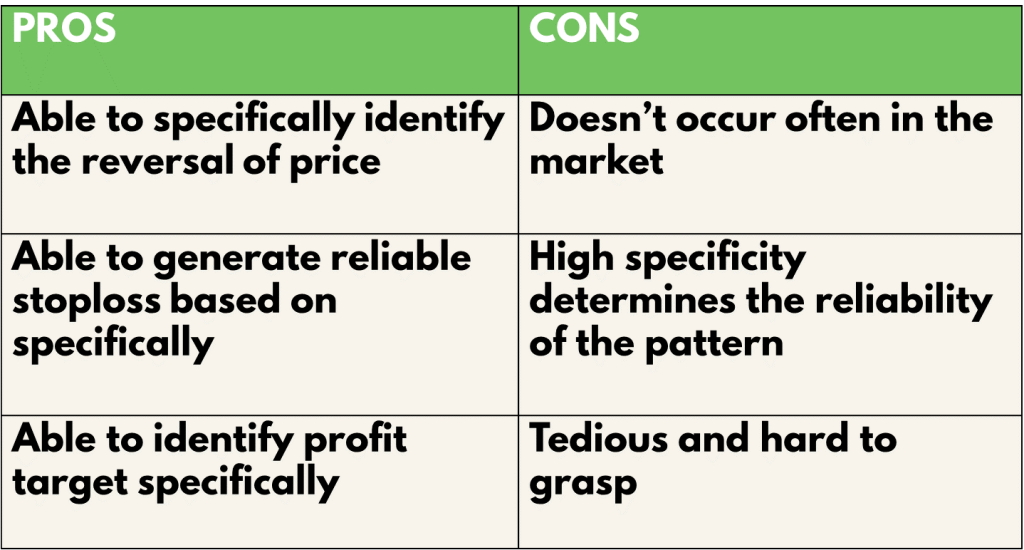
The pros of using the Gartley pattern trading strategy are that it is highly accurate due to the specific measurements using the Fibonacci retracements. This allows traders to identify price reversal areas, stop loss and profit targets with high accuracy. However, it due to the lack of frequent occurrence in the market, it requires patience and discipline from the trader, which in turn leads to opportunity costs, where other potential trades might be missed out on. On top of that, even though the pattern’s specificity falls into a range in the Fibonacci ratios, the degree of specificity also determines the reliability of the pattern. The pattern might give several red flags during its formation and one of the largest one that would cause it to fail is the unmatching Fibonacci ratios. Lastly, it is definitely a beginner unfriendly strategy as it is tedious and hard to grasp with Fibonacci and Elliot wave knowledge as pre-requisites.
Also learn: Swing trading strategies
Analysis
To find out the profitability of the Gartley pattern trading strategy, we decided to do a back test based on the past 5 trades from 26 Jun 21 on the M1 timeframe. The rules for entry will be the same as what was mentioned above. We will be back testing this throughout 3 types of trading vehicles, namely, EURUSD for forex, US30(DJI) for stocks and BTCUSD for cryptocurrency. For simplicity, we will assume that all trades taken have a risk of 1% of the account.
Also read: Double top pattern double bottom pattern
Definitions: Avg Risk reward ratio= ( Total risk reward ratio of winning trades/ total no. of wins) Profitability (% gain)= (no. of wins* reward)- (no of losses* 1) [ Risk is 1%]
An example of the application of the strategy is as shown:
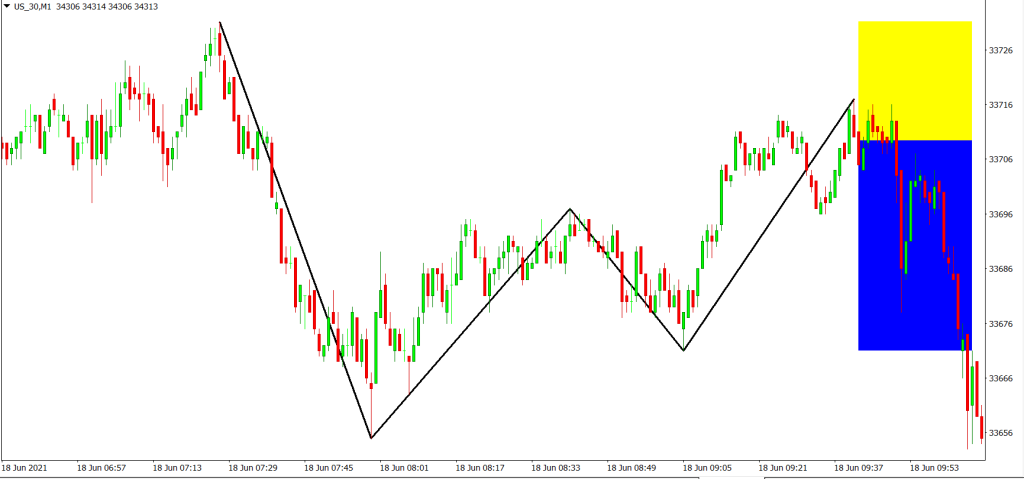
For the Backtest results, trades with blue and yellow zones indicate an overall win with the blue zone as reward and the yellow zone as the risk taken.
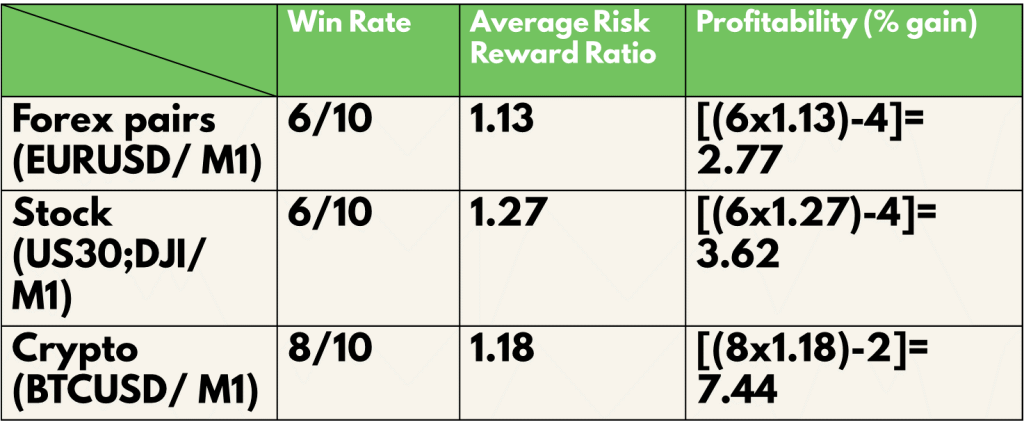
As shown in our backtest, the win rate of this strategy for EURUSD (Forex) is 60%, AAPL (Stocks) is 60% and BTC (Crypto) is 80%
The average risk reward ratio of this strategy for EURUSD (Forex) is 1.13, US30 (Stocks) is 1.27 and BTC (Crypto) is 1.18.
The profitability of this strategy for EURUSD (Forex) is 2.77, AAPL (Stocks) is 3.62 and BTC (Crypto) is 7.44.
Conclusion
In conclusion, the Gartley pattern trading strategy is definitely a profitable one due to its high win rate, and average risk to reward ratio it generates. Given its high specificity, the Gartley pattern still has a chance to fake traders out. In such cases, traders may consider using indicators to back their trading plan up or by watching out for certain red flags that can happen such as price action. Even then this comes with trading experience and subjectivity. Hence, this advanced technique is not recommended for new traders who had just began their financial journey in the trading world. Needless to say, a grasp for this technique will definitely increase your knowledge in the trading world and allows you to approach each trade plan with a wider perspective. After all, price action and chart patterns are a common way for traders all around the world to “communicate”.
Info