5 Types of Swing Trading Strategies That Work
If you are looking for a forex trading strategy with a spectacular risk and reward ratio, then look no further than swing trading strategies. Swing trading reduces stress and burn out in trading and makes trading more enjoyable.
What makes a Swing trading better than intraday or positional trading? What are the advantages of swing trading vs day trading. Intraday traders need to be glued to their screens and trade multiple times within a day, on the other hand, the positional trades take weeks or even months to develop and then to reach profit positions.
Intraday traders make decisions in few seconds while swing traders will have plenty of time to plan the trade, calculate their moves, and place the trades accordingly. Swing trades can last anything from 2 days to more than a week, providing enough time to the trader to think, adjust or readjust the positions, scale-up, and build additional positions around them too.
The overall trading performance of a successful trader greatly depends on the risk to reward ratio. The risk to reward ratio is a measure of the difference between the trade entry point and stop loss against the difference between the entry point and take profit. Most successful swing traders always plan the trades with winners bigger than the losers. A swing trading plan will provide the ability to take the trades based on a high risk to reward ratio and to execute high-quality trades..
Swing trading strategies
Let’s look at 5 profitable swing trading strategies here.
1. Market structure
2. Fibonacci retracement
3. Trend based indicator trading
4. Bollinger bands
5. Range trading
Contents
- Swing Trading Strategies #1: Market structure
- Swing Trading Strategies #2: Fibonacci Retracement
- Swing Trading Strategies #3: Trend based indicator trading
- Swing Trading Strategies #4: Bollinger Bands
- Swing Trading Strategies #5: Range Trading
- Risks of swing trading strategies
- Conclusion
Swing Trading Strategies #1: Market structure
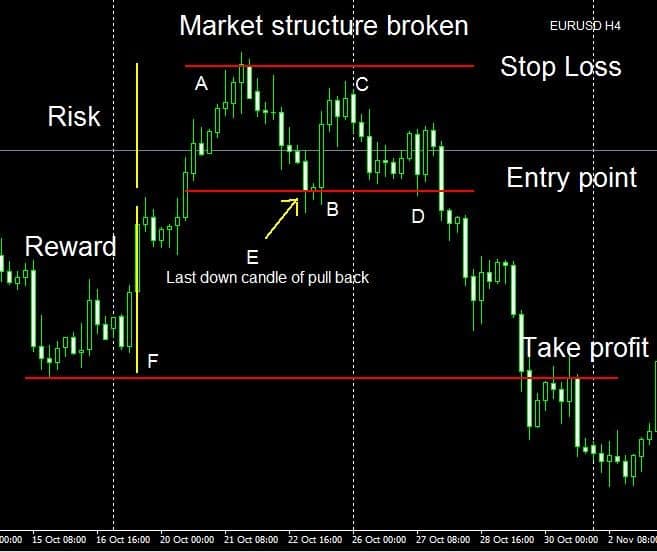
Image Reference
A – Market high, higher high
B – Higher low , Pullback point
C – Lower high, Failure to break the previous high
D – Entry point
E – Last down candle of pullback
F – Take profit
How about trading profitably without any indicators eg. ATR Indicator? This swing trading strategy does not involve any indicators, only price action trading, doji candle and naked charts.
Charts reflect the price movements of the particular trading instrument. A careful study of the charts provides vital information to understand the current price movements and also to anticipate future price movements. Chart patterns can reveal the market structure by showing us the reversal patterns such as head and shoulders, double top and double bottom, and continual patterns like pennants, flags, and wedges. Most importantly charts provide us the support and resistance levels.
Market structure is formed by a combination of support, resistance, swing highs, and swing lows. A shift in market structure occurs when the price is unable to make higher highs in an uptrend and eventually starts to make lower lows. The shift in price from an uptrend to a downtrend can happen with or without consolidation.
Let’s look into this strategy in detail, in the above H4 chart of EURUSD in Picture A. Prices were moving in an uptrend and reached a peak at point A( higher high ), prices then pulled back to B ( low )and created a small base before gaining strength and pushing higher for a new high at C ( lower high). Prices failed to break above point A ( higher high) and subsequently fell back to point D ( lower low ) and made a new low, price has now made a new low which is lower low than the previous low ( B ). The inability of the price to make a higher high during an uptrend and forming of a lower low shows market weakness and a shift in market structure.
Confirmation of change in market structure occurs when price breaks below E, the low of the last down candle of the pullback. Profits can be booked at the next support level at F, while stops can be placed above the market high at A (higher high of the uptrend). The same will be the opposite for the downtrend.
This strategy provides a good risk reward ratio and allows the trader to trail the market once the trade develops in a favorable direction, by trailing the prices and moving the stops closer to the entry point this strategy also allows the trader to protect the position and subsequently reduce or eliminate the risk of the trade.
Swing Trading Strategies #2: Fibonacci Retracement
This swing trading strategy uses the power of the Fibonacci tool to calculate the entry, exit, and also the target points.
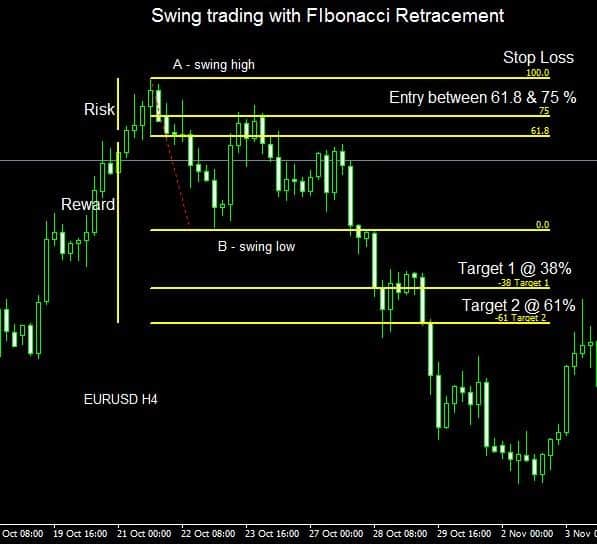
The Fibonacci retracement levels are 23.6%, 38.2%, 50%, 61.8%, 78.6%, 100%, 161.8%, -0.23% , -38.2% ,-61.8%, though not officially a Fibonacci ratio 50% is also used. Fibonacci levels are drawn between swing highs and swing lows. The Fibonacci tool automatically calculates the percentages of the price movement and draws lines on the chart at these levels. These levels indicate possible locations of support and resistance and thereby identifying them as potential reversal points. Using this tool a trader can anticipate price movements in advance, calculate the stops, and will be able to identify potential price targets to book profits and serves as a swing trading guide.
Let’s observe this EURUSD H4 charts in Picture B, prices formed a swing high and a swing low. Once the swing points are formed let’s draw the Fibonacci tool connecting the swing high and low. We will wait for the prices to retrace and reach 61 % and 75 % Fibonacci levels and enter the market. The stop loss can be placed at the 100 % Fibonacci level or the swing high A, while targets can be placed at -38% and -61% as Take profit 1 and 2 respectively.
All calculations are done by Fibonacci tools leaving no guesswork regarding the entry, exit, and stop-loss points.
Though Fibonacci levels provide support and resistance levels, they require additional confirmation using price action or technical indicators like RSI Forex Indicator, MACD Histogram. The presence of convergence and divergence at these Fibonacci levels provide additional confirmation of reversals and strengthens the validity of support and resistance.
Swing Trading Strategies #3: Trend based indicator trading
The number # 1 rule in investing is Trend is your friend, follow the trend. Most swing traders never forget this, in fact, swing traders tend to study and identify a trend in a higher time frame, once done they look for swing highs and swing lows in a lower time frame chart and place the trades in the same direction of higher time frame. If a trader identifies an uptrend on a weekly chart or a monthly chart of a particular trading instrument, the trader will place buy orders once a swing low is formed in a daily chart or a 4 hours chart. A Trendline Trading method can also be used.
The following swing trading strategy involves trading the markets with any trend-following indicator of your choice. There are many trend-following indicators available, however, let’s use the moving averages for this example.
Moving averages are widely used in trading because of the ease of calculation and its ability to perform in almost all trading instruments and markets.
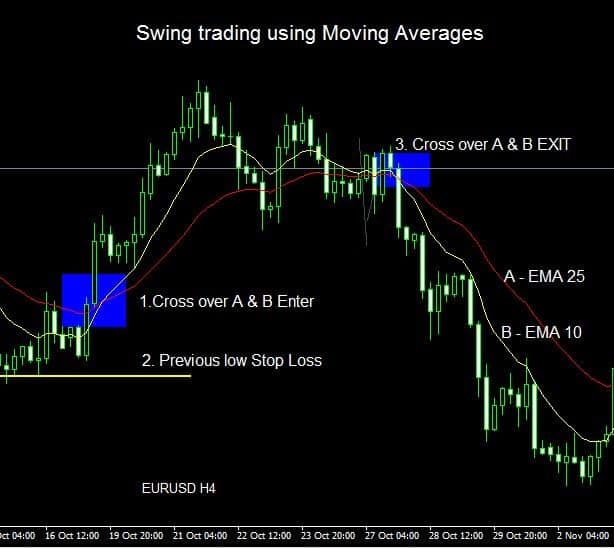
Let’s use the Exponential moving average (EMA) to demonstrate the swing trading here. We use 2 moving averages one with a 25 period EMA also known as the slow moving average, calculated at closing prices, and the other with a 10 period also known as the fast moving average.
In the above picture C. At point 1, the fast moving average crosses over the slow moving average from down to up and indicates a shift in price trends. Stops can be placed at the swing low (2) before the crossover point (1) as this would invalidate the shift in price trend. Targets cannot be calculated in advance, rather exits are planned at the crossover in the opposite direction (3). The trader rides the trend and allows the trend to mature and wait for the moving averages crossover to show the exit signals, this allows the trader to take advantage of the total movement of the trend.
Moving averages are normally good at identifying the trends and also the shift in trends, however, while using them to swing trade it is necessary to use price action as additional confirmation.
Swing Trading Strategies #4: Bollinger Bands
One of the most successful swing trading strategies is to use Bollinger Bands Forex. Bollinger bands are one of the most commonly used technical indicators in forex trading. Bollinger bands consist of 3 lines, the midline is the simple moving average of the closing prices for a certain number of periods. The upper line and lower lines are calculated and drawn at a distance of 2 standard deviations from the midline.
Line A – Midline – simple moving average (SMA) of the closing prices for the last 20 periods.
Line B – Upper band – Midline (SMA) shifted up to Standard deviation +2.
Line C – The lower band – Midline (SMA) shifted down to Standard deviation -2.
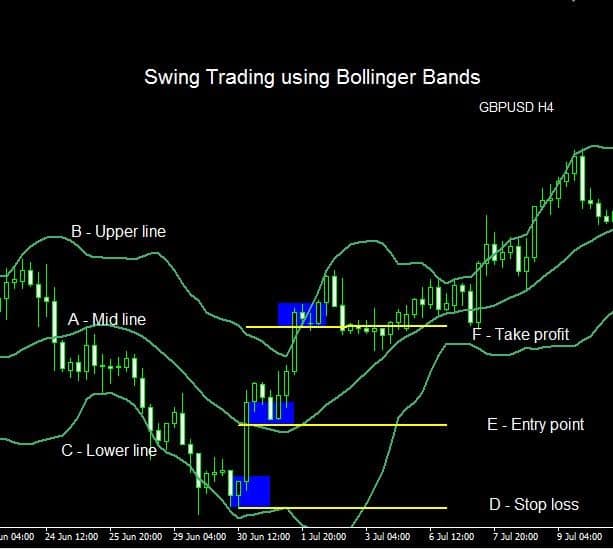
Traders would wait for prices to reach the lower line C, at point C prices become oversold and the trend is expected to get exhausted, there could be price consolidation at this point which eventually would lead to a reversal of the direction. The change of trend is further confirmed once prices cross Midline A, once the Midline is cleared we expect the trend to continue and reach the Upper line B
In Picture D. The entry point E is at the trend confirmation point Midline A, the stop loss D can be safely placed below the Lower line C, which is a swing low and the take profit F is normally the Upper line B, which is a swing high. The Bollinger bands eliminate guesswork and provide clear entry, exit, and take profit levels.
Bollinger bands provide a very good insight into the overbought and oversold levels. The bands perform very well in ranging markets, but in a trending market, they may not be that successful. Also, it’s better to avoid trading when the bands narrow as this implies a sudden shift in market price is due.
Swing Trading Strategies #5: Range Trading
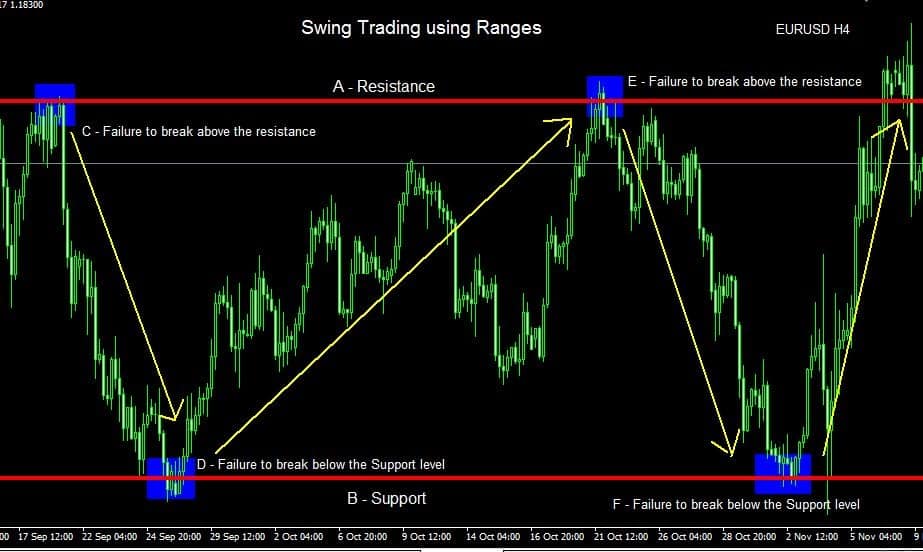
Support and Resistance Forex lines are drawn using the previous price history. Identifying and confirming pre-established support and resistance level is very important for the successful trading of this strategy. Once support and resistance are defined the trader has a range at his disposal to understand the best entry point, the optimum take profit level, and to squeeze out the last pip of the price movement.
In the above Picture E, Prices moved within a trading range between the Resistance level A and Support level B. When prices reached point D from C, at point D it’s visible that the price is unable to break the support. The price consolidates at D and then pushes higher all the way to reach the opposite end of the range. Price meets a similar fate at point E, however, prices moved a bit higher than the resistance at point E, but failed to make substantial gains and slipped back to the range which leads the price to fall back to the point F.
To successfully trade this strategy the trader has to combine the support and resistance with candlestick patterns and chart patterns to identify price rejection.
Risks of swing trading strategies
As with any trading style swing trading also has its own risk. Swing trading requires holding the position for a few days which may include weekends. The biggest risk is if the market opens with a gap in the opposite direction of your trade and your stop loss may be executed at an unfavorable price.
Conclusion
Swing trading strategy provides many advantages over other trading styles. Though swing trading strategies are created with a healthy risk and reward ratio, it requires practice and a high level of patience to be successful. Sound money management and risk management principles should be in place while trading.


