Ichimoku article
The Ichimoku Kinko Hyo, or Ichimoku for short, is a technical indicator that is used to gauge momentum along with future areas of support and resistance. The all-in-one technical indicator is comprised of five lines called the tenkan-sen, kijun-sen, senkou span A, senkou span B and chikou span. This indicator maybe complexed and complicated to pick up at first, but it is well recognised, especially amongst the new traders to instil discipline in their trading style, keeping their accounts alive with profits instead of getting busted.
The Ichimoku is an all-in-one indicator as it also has the capability to gauge the strength of the trend as well as predicting the future direction and strength of the trend. The Ichimoku indicator’s trading rules are extremely specific, which is beneficial to new traders as it guides their thinking process and reduces subjectivity in their trade plans. This ultimately shapes their train of thoughts and instils discipline into their trading system and methodology.
Ichimoku article – Quick Setup Tutorial
Content
- Components of the ichimoku explained
- How to use the ichimoku
- Pros and cons
- Analysis
- Conclusion
- Infographic
Components of the ichimoku explained
The first of the five lines in the Ichimoku is the Tekan-sen. Often known as the conversion line, the Tenkan-sen is calculated by adding the highest high and the highest low over the past nine periods and then dividing the result by two. The resulting line represents a key support and resistance level, as well as a signal line for entry and potentially exit as well.
The second of the five lines in the Ichimoku is the Kijun-sen. Often known as the baseline, the Kijun-sen is calculated by adding the highest high and the lowest low over the past 26 periods and dividing the result by two. The resulting line represents a key support and resistance level, a confirmation of a trend change, and can be used as a trailing stop-loss point.
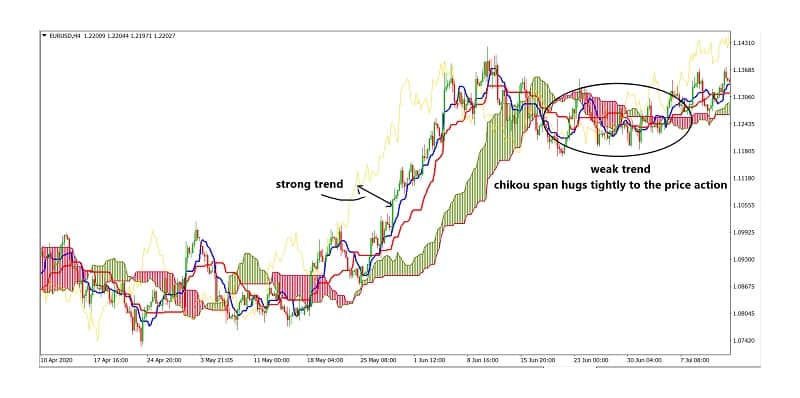
The third of the five lines in the Ichimoku is the Chikou span. Often known as the lagging span, is the current period's closing price plotted 26 days back on the chart. This line is used to show possible areas of support and resistance. Also, the lagging span can show the strength of the trend and prevent traders from playing in a choppy or sideways market. The further away the Chikou span is from the price action, the stronger the trend is.
Also read: Rsi forex
The fourth of the five lines in the Ichimoku is the Senkou span A. Otherwise known as the leading span A, it is calculated by adding the tenkan-sen and the kijun-sen, dividing the result by two, and then plotting the result 26 periods ahead. The resulting line forms one edge of the Kumo – or cloud – that's used to identify future areas of support and resistance.
The last of the five lines in the Ichimoku is the Senkou span B. It is also known as the leading span B. It is calculated by adding the highest high and the lowest low over the past 52 periods, dividing it by two, and then plotting the result 26 periods ahead. The resulting line forms the other edge of the Kumo that's used to identify future areas of support and resistance.
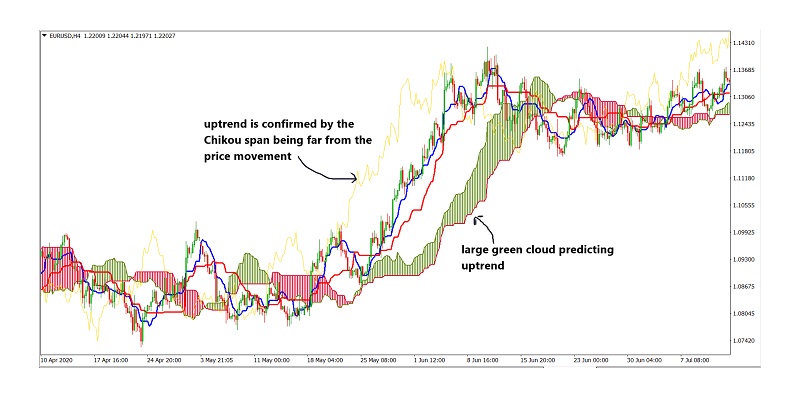
Both the Senkou spans A and B form the Cloud of the Ichimoku, otherwise known as the Kumo. The cloud provides key areas of support and resistance and also has predictive capability. Depending on the size and the colour of the Kumo, the strength of future trends and thus price action can be deduced. The larger the cloud is, the stronger the trend. The direction of the trend is determined by the calculations of the Senkou span A and B put together, which will determine the colour of the cloud and thus the direction of future price movements.
Also read: Macd histogram
How to use the ichimoku
In this segment of the article, we will be looking at the rules governing the trading system of the Ichimoku Kinko Hyo strategy. The base rule of entering any trade with this strategy is that:
- The price must never be inside the Kumo. When going long, the price must be above the Kumo. On the other hand, when shorting, the price must be below the Kumo.
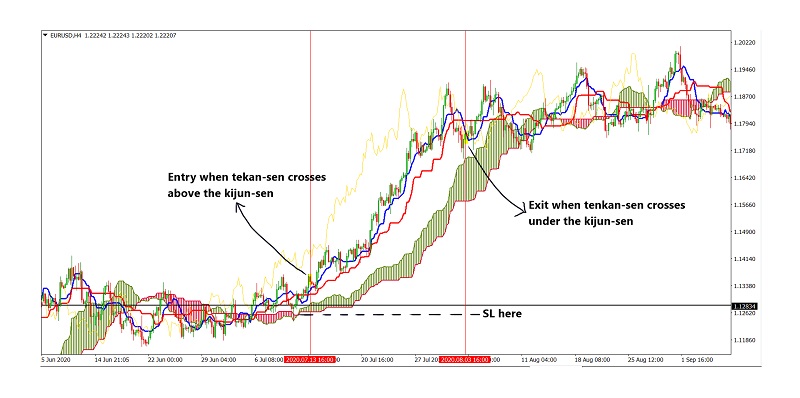
- Take a long position only when the tenkan-sen crosses above the kijun-sen. While taking a short position only when the tenkan-sen crosses under the kijun-sen.
It is recommended to avoid choppy markets when using this strategy as it provides contradicting signals causing multiple stop outs in a period of sideways market. One way to gauge when the market is about to or transiting into sideways price movement is by taking a look at the Chikou span. If the market momentum is slowing down during a trend, the chikou span will converge towards the price candles over time. This is the reason why it can gauge the strength of the market. As such when the Chikou span is near the price, be it touching or crossing over, the market can be seen to be in a sideways transition.
The stop-loss order for the Ichimoku Kinko Hyo strategy can be placed below the next support and resistance level where price respects.
The profit-taking level for the Ichimoku Kinko Hyo strategy can be determined by an exit signal from the Ichimoku indicator. For a long position, the exit signal is given when the tenkan-sen crosses under kijun-sen. The converse is true. For a short position, the exit signal is given when the tenkan-sen crosses above kijun-sen.
Also read: Trailing stop loss
Pros and cons
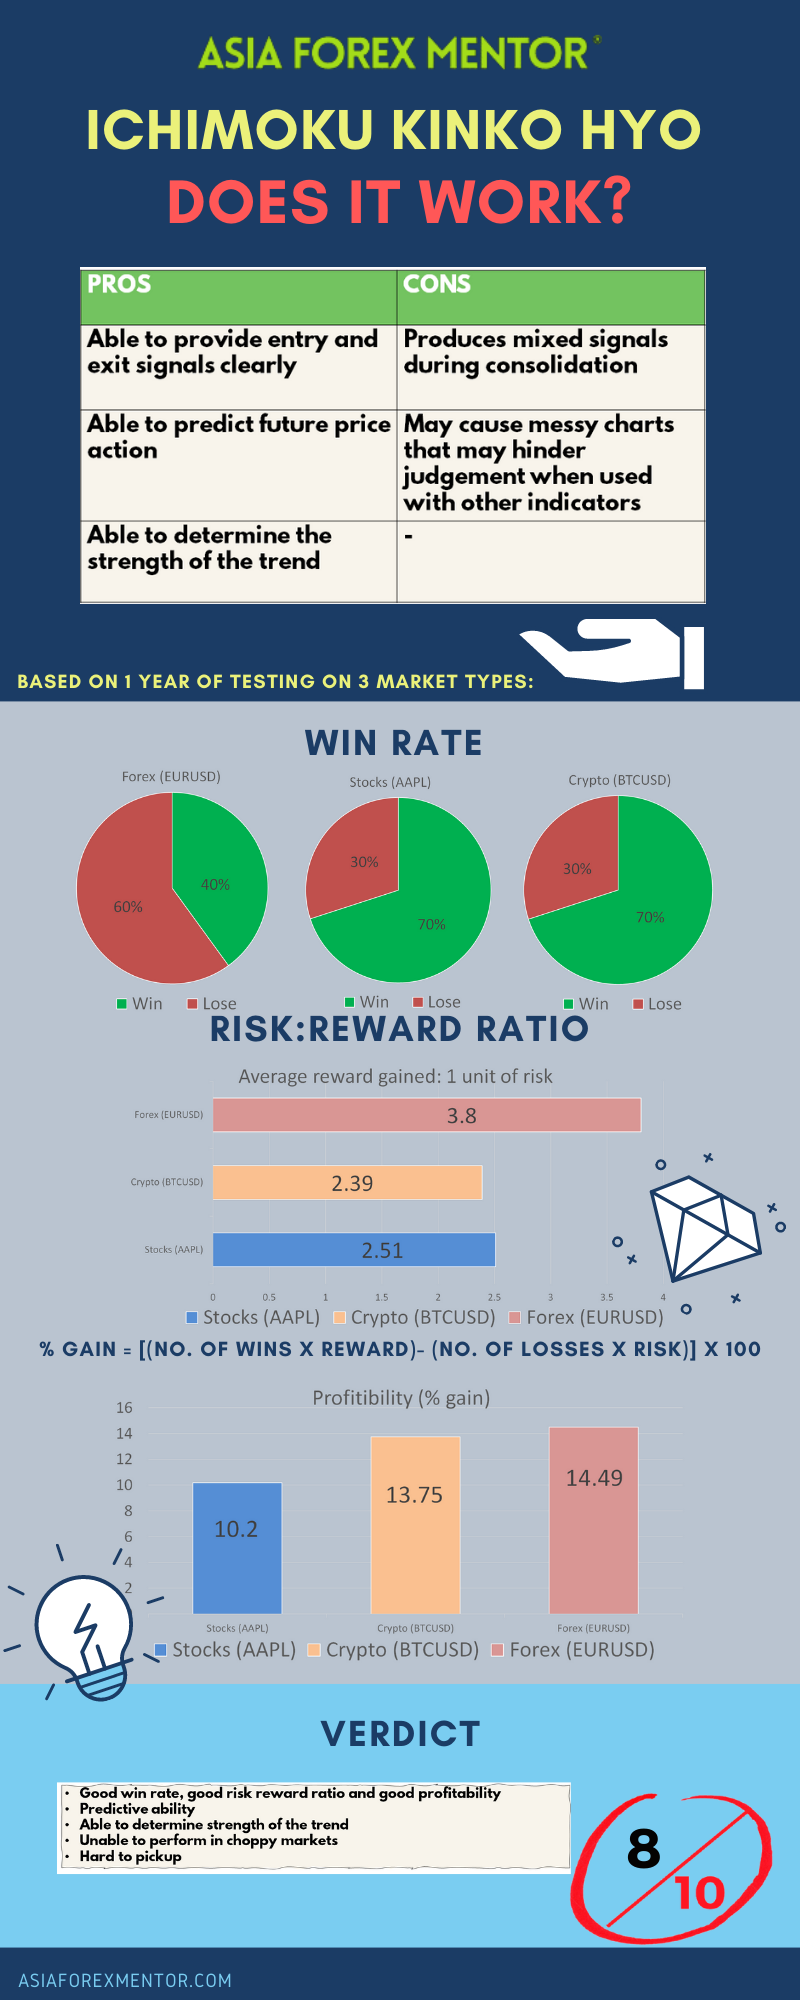
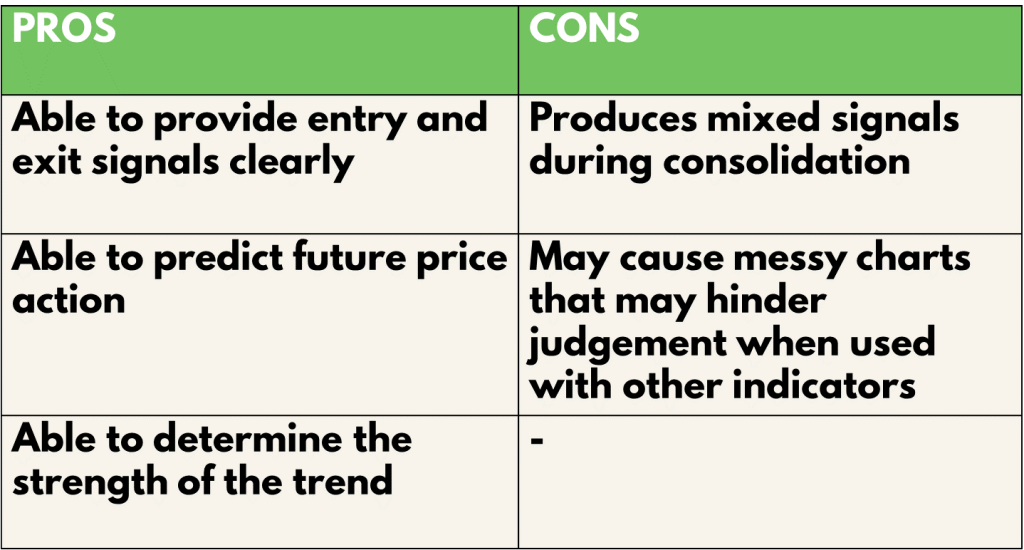
The pros and cons of using the Ichimoku trading strategy are that it can clearly provide entry and exit signals. This is due to the crossings between the tenkan-sen and the kijun-sen. The Ichimoku indicator is also able to predict future trends in the market via the Senkou span A and B as it forms the Kumo. Furthermore, the Ichimoku strategy can determine the strength of the trend via the Chikou Span. However, the Ichimoku does have a few flaws. It, unfortunately, does not work well in the sideways market or choppy markets. In choppy markets, it produces mixed signals during a consolidation. Which could potentially damage the account’s survivability. In addition, due to the variety of tools in the Ichimoku indicator, it may appear messy and may hinder judgement when used with other sets of indicators all at once.
Analysis
To find out the profitability of the Ichimoku Kinko Hyo trading strategy, we decided to do a backtest based on the past 10 trades from 21 May 21 on the H4 timeframe. The entry rules will be the same as what was mentioned above. We will be backtesting this throughout 3 types of trading vehicles, namely, EURUSD for forex, AAPL for stocks and BTCUSD for cryptocurrency. For simplicity, we will assume that all trades taken have a risk of 1% of the account.
Definitions: Avg Risk reward ratio= ( Total risk-reward ratio of winning trades/ total no. of wins) Profitability (% gain)= (no. of wins* reward)- (no of losses* 1) [ Risk is 1%]
An example of the application of the strategy:
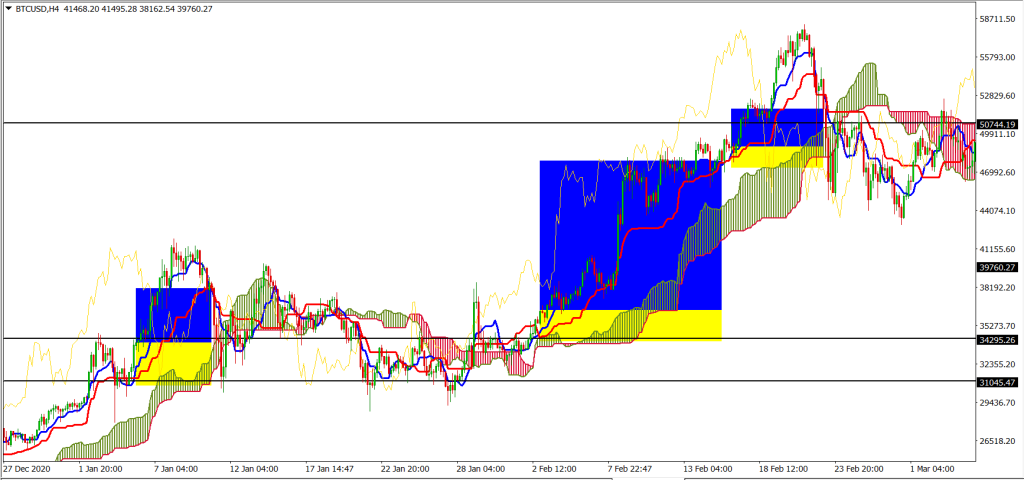
For the Backtest results, trades with blue and yellow zones indicate an overall win with the blue zone as a reward and the yellow zone as the risk taken.
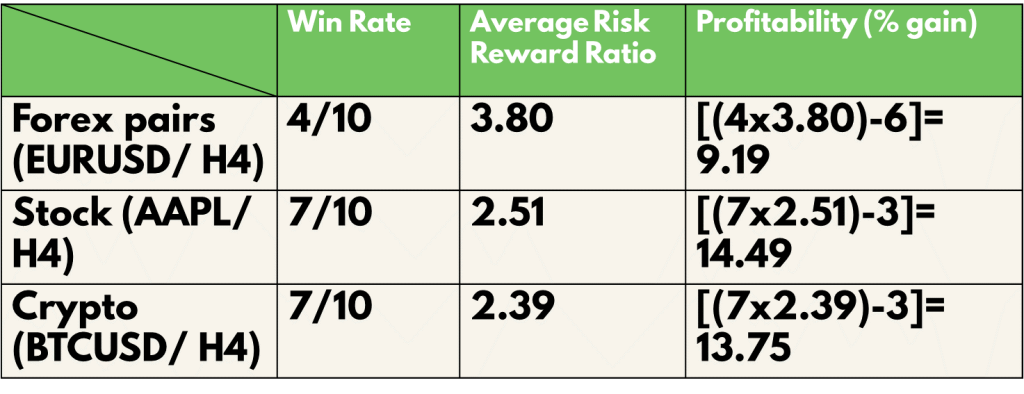
As shown in our backtest, the win rate of this strategy for EURUSD (Forex) is 40%, AAPL (Stocks) is 70% and BTC (Crypto) is 70%
The average risk-reward ratio of this strategy for EURUSD (Forex) is 3.8, AAPL (Stocks) is 2.51 and BTC (Crypto) is 2.39.
The profitability of this strategy for EURUSD (Forex) is 9.19, AAPL (Stocks) is14.49 and BTC (Crypto) is 13.75.
Conclusion
Overall, the Ichimoku Kinko Hyo has proven itself to be a very stable indicator on its own with an overall high win rate, good risk to reward ratio and outstanding overall profitability. It is definitely a useful indicator with the capability of providing insights of the market from multiple angles. The only angle it seems to be lacking is the volume traded in the market. Thus, it is definitely more powerful with the help of volume indicators such as the MACD. Needless to say, it can cause quite an uproar on the screen due to the many lines that come with the indicator itself. However, this can be easily overcome by trading in a discipline and meticulous way. Hence, the Ichimoku Kinko Hyo does the perfect job of instilling a sense of discipline and carefulness, especially amongst new traders.
Infographic