Learn To Trade Forex • Best Forex Trading Course • AsiaForexMentor

What Is the Marubozu Candlestick Pattern

Written by

Ezekiel Chew

Updated on

January 29, 2025

i

What Is the Marubozu Candlestick Pattern

Written by:

Last updated on:

January 29, 2025

Technical analysis attempts to predict the future course of an asset by looking at the movements in the price. Yet many traders believe that the main focus needs to be on studying the psychology that influences price movements. Their opinion is that assets are mostly affected by how people react to circumstances.

Many technical indicators and candlestick patterns get used to understanding market dynamics, and the Marubozu candlestick pattern is not well known, but works well when it is observed.
Marubozu Pattern
Photo credit: Pixabay.com

The Marubozu candlestick pattern resembles a block, it doesn’t have any wicks, which means that the closing or opening price is identical to the candle’s max prices.

The shadows absents signals that the session started at a high price and ended at a low price. The Marubozu candlestick offers perspective about the upcoming course of a price.

Also read: Candlestick Patterns Cheat Sheet

Contents

Basics of Marubozu Candlesticks

Marubozu candlesticks reveal that during the day an asset is vigorously traded in one direction. The stock can close at its low price or highest price of the day.

Usually, the Marubozu candlesticks possess an elongated body without shadows. Yet in practice noting is perfect, and that applies to charts.

The name Marubozu is Japanese, and translates into “bald or shaved head”. It’s an appropriate name if you take into account that candlesticks were created in Japan several centuries ago and were used by rice traders.

Today, rice is not the main asset that gets traded with the Marubozu chart pattern, but Japanese candlestick patterns are still used by investors thanks to the large quantity of data it provides.

There are several things investors can learn from this pattern. The formation signals that an asset is strongly trading in one direction. The Marubozu candle offers an opportunity to forecast the upcoming course of the stock’s price. The standard advice remains to confirm the signal with other technical indicators.

Also Read: 12 Forex Reversal Patterns You Must Know

Back to top

Bullish Marubozu

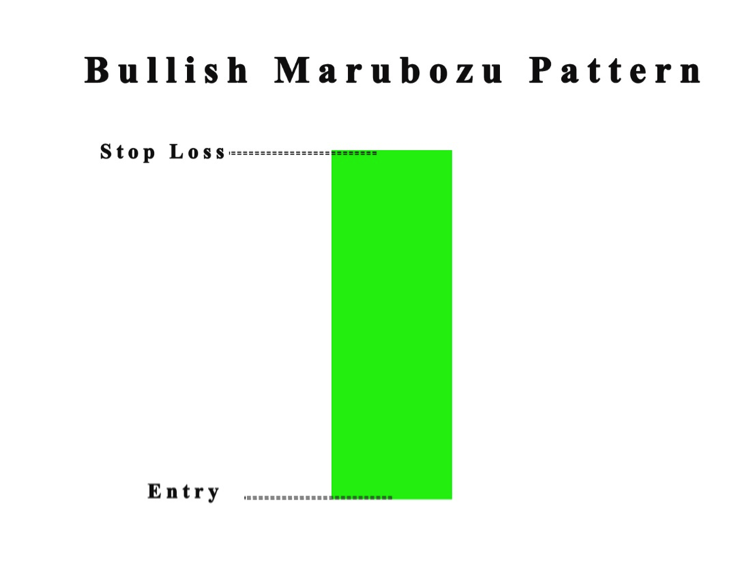
The bullish Marubozu candlestick signals that the price started at a lower point and ended at a higher point. The reason is that buyers controlled the assets price. The bullish Marubozu pattern has a green body. These candlesticks are frequently seen as convincing, and technical traders look for capitalize on them.

This type of candlestick reveals that there is a large purchasing interest in the asset or that traders prepare to buy at any price in a trading session. Because of this, the stock price will close at the session's high point.

If the bullish Marubozu is displayed at an uptrend, the implications are for the perpetuation of a trend. Still, if it emerges in a downtrend, it indicates a reversal in the trend, that attitude in the market has altered, and the stock is now bullish.

The assumption is that when the drastic change occurs, there will be a rush of bullish patterns that will likely remain in place in the upcoming trading sessions.

Investors have to search for purchasing options after the emergence of a bullish Marubozu. It's recommended that the buy price is just over the closing price of the bullish Marubozu.
Bullish Marubozu

Back to top

Bearish Marubozu

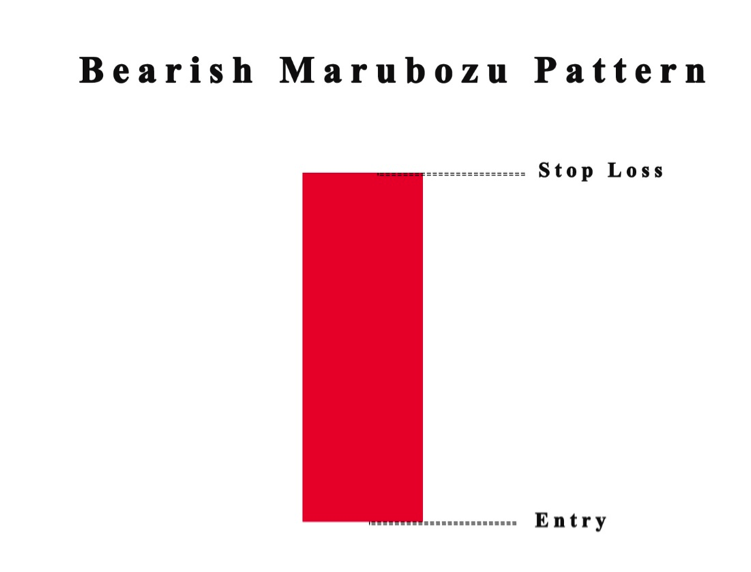
The bearish Marubozu candlestick signals the price started at a higher point and then closed at a lower level. This time the day when to the sellers who controlled the stock price. The long body of the bearish Marubozu candles is colored red.

With the bearish Marubozu pattern, the chart pattern can be read as large selling pressure on the asset that traders prepare to sell the stock at any point during the trading session. Because of these, the asset price closed close by the low point for the session.

When the bearish candlesticks occur in a downtrend, it signals a powerful trend continuation. If it happens in an uptrend, it functions as a trend reversal pattern, and the attitude of the market changes, the stock becomes bearish.

It is assumed that with the drastic change in attitude there will be a tide of bearishness that will continue in the following trading sessions. Investors need to search for possibilities to sell after the emergence of a bearish pattern. The recommended selling price is just under the closing price of the Marubozu.
Bearish Marubozu

Back to top

Trading with the Marubozu Pattern

When Marubozu candles happen, they are a signal of strength. If a bullish Marubozu occurs, that signals the bulls are in control and are fighting off the pressure exerted by short-sellers.

Frequently the bullish Marubozu results in a continuation of the upward trend. Alternatively, a bearish Marubozu candle is generally a signal of the dominance of bears. They are indicators that a bearish trend will start to develop.

There is no standard rule, and because of that, a Marubozu candle will result in reversal or consolidation.

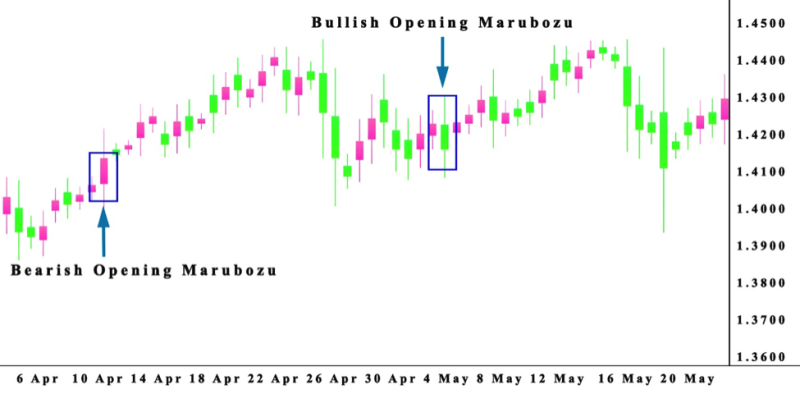
Usually, the candlestick color reveals which side is in control of the market. The trading strategy is dependent on the Marubozu type. Most investors need a second verification pattern before starting a trade.
Marubozu Pattern3

Back to top

Advantages and Disadvantages

The crucial thing to understand about the Marubozu candlesticks is that investors don’t trade in the same direction as the candlestick, but have to trade against them. Experience has demonstrated that price reverse momentarily and absorbs the move from the candlestick.

The Marubozu pattern is excellent for revealing the attitude of the market for a pair of currencies. With the patterns investors in the forex market can assess pairing, which plays a central role in revealing the direction of the price movement in the short-term future.

The attitude is only one element influencing forex prices. Still, the Marubozu can generate false signals that produce losses for forex traders. The data received from Marubozu patterns needs to be verified from other indicators to assess possibilities for investment, guided by metrics like trading volume and lines of resistance.

An important step to undertake is the placement of stop-losses to safeguard against the pattern's limited reliability.

The standard recommendation is in place, consult other technical indicators when producing a signal with the Marubozu candle. If searching for an entry, take profit, and stop-loss, be careful because the pattern is not as accurate as other Japanese candlesticks formations.

Back to top

How Accurate Is the Marubozu?

The position of the Marubozu in the context of the larger trend is crucial for producing positive signals. That means keep your distance from Marubozu formations and the end of mature trends, this can change if traders observe a reversal.

The most obvious conclusion for traders when they see a Marubozu candle pattern is that a trend with strength has driven prices to the highs or lows of the time period. This type of price action suggests the continuation of the trend.

The price action is retrospective, and the position of the Marubozu within the bigger trend is important to its rewards. If the Marubozu shows at the end of the trend in a blow-off, it prepares the circumstances for a reversal in a trend and not a continuation.

When the Marubozu emerges in the middle of the trend, there is a possibility for trading. That option will not be as profitable if the Marubozu had emerged at the start of a new trend.

The Marubozu candle signals the market is trending in one direction. If the candle is broken down and analyzed, investors can see that in the entire session the price of an asset trades in one direction.

Back to top

Conclusion

In financial markets, the Marubozu candlestick pattern does not have a huge reputation, it’s not easy to observe the pattern, because it forms rarely on candlestick charts. Traders need to be careful when implementing the Marubozi candlestick pattern in the market.

The Marubozu candlesticks can get observed in every time frame on charts. Yet a single signal is not proof enough to start a trade. It can be more appropriate to trade during the day when the control of the market is in the hands of one side. Most traders need to learn the candlesticks to improve their trading techniques.

The Marubozu candlestick pattern is useful to estimate the attitude of the market because it indicates a continuation of the present trend. When the pattern is observed, for example on a crypto chart, at the starting stage of a new trend, the purchasing pressure drives the cryptocurrency’s price, causing it to trade higher.

If the Marubozu is observed at the end of a strong trend, then investors need to be careful because it can signal a reversal. The Marubozu formation is not hard to spot, yet its productivity is dependent on analyzing its position in a bigger trend.

This technical indicator can produce insights about the future course of a price, especially when trading cryptocurrencies, that process requires a wider market perspective. The implementation of fundamental analysis with a combination of other technical indicators is highly recommended.

Technical indicators are not the most productive tool if as a trader you don't understand candlesticks. With candlesticks, investors receive warnings about potential risk before most other indicators spot the problem.

The Marubuzo candlestick makes day trading easier because one side dominates for the day. Focus on learning candlesticks they are beneficial to every trading strategy and can save you from losing money rapidly.

Back to top

FAQs

How do You Trade Marubozu Candlestick Pattern?

When the Marubozu candlestick pattern forms check if it's bullish or bearish, in the case of bullish, when price breaks over, take a long position and place a stop under the candlesticks. While if bearish candlestick, when the price declines under, in that case, take a short and place a stopover candlestick.

What Happens After a Marubozu Candle?

When a bullish Marubozu occurs, it signals that bulls are still gaining strength and are not affected by the pressure from short-sellers. In most cases, the bullish Marubozu causes a continuation of the upward trend. Followed up with a bearish candle that makes a drastic decline in the asset price.

What does Bullish Marubozu Mean?

The bullish Marubozu shows there is purchasing interest for stock and during the day, traders were prepared to buy the stock at every price point, resulting in the asset closing close to the high point for the day. The buying price has to be near the closing price of the Marubozu.

How do You Use Marubozu Candles?

The Marubozu candles are a technical indicator that gets used to forecast the direction of an asset’s price.


Back to top


About Ezekiel Chew​

Ezekiel Chew, founder and head of training at Asia Forex Mentor, is a renowned forex expert, frequently invited to speak at major industry events. Known for his deep market insights, Ezekiel is one of the top traders committed to supporting the trading community. Making six figures per trade, he also trains traders working in banks, fund management, and prop trading firms.

How to Read Candlesticks (Most Traders Get This Wrong)

Most traders who spend months learning how to read candlesticks still lose on setups that looked textbook. The pattern was never the problem. Reading it without context was. ABOUT THIS GUIDE This guide covers three specific candlestick signals used in professional price action trading, the Fibonacci golden zone context tool,

Read More

What Profit Factor Tells You Before Going Live

Profit factor is calculated by dividing a strategy’s total gross profit by its total gross loss, and most experienced traders reject any system that reads below 1.5 before risking real capital. Most traders see any positive number and call it a green light. That is where the costly mistake starts.

Read More

6 Forex Trading Scams Every Beginner Should Know

The most effective forex trading scams do not announce themselves as threats. They arrive as opportunities, come through referrals and social media, and are often indistinguishable from legitimate services until the first withdrawal request is made. ABOUT THIS GUIDE This guide covers the six most common forex trading scams, the

Read More

How to Use Fibonacci Retracement Step by Step in 2026

Most traders learn how to use Fibonacci retracement and immediately draw it wrong. This tool comes from a mathematical sequence first documented in 1202, and institutional traders use it daily to plan entries at precise price levels. The majority of retail traders miss the one placement rule that makes every

Read More

Free Margin in Forex What the MT4 Panel Shows

Free margin in forex is the one figure on the MT4 or MT5 account panel that determines whether another position can open right now, and it is consistently the last number most traders learn to read. ABOUT THIS GUIDE This guide explains what free margin is and how it connects

Read More

Scalping Trading Strategy The Pros Actually Use

The scalping trading strategy most retail traders use is not actually scalping. They are gambling on 1-minute candles with no defined edge, no position-sizing rules, and no plan for when the losses come. ABOUT THIS GUIDE This guide covers what scalping is, how professional scalpers build a repeatable edge, and

Read More

AFM Trading Summit Live

Date: Coming Soon

Join us at the AFM Trading Summit Live and learn from top industry experts through live trading sessions, market insights, and actionable strategies.

What Is the Marubozu Candlestick Pattern

4.0
Overall Trust Index

Written by:

Updated:

January 29, 2025

Technical analysis attempts to predict the future course of an asset by looking at the movements in the price. Yet many traders believe that the main focus needs to be on studying the psychology that influences price movements. Their opinion is that assets are mostly affected by how people react to circumstances.

Many technical indicators and candlestick patterns get used to understanding market dynamics, and the Marubozu candlestick pattern is not well known, but works well when it is observed.

Marubozu Pattern
Photo credit: Pixabay.com

The Marubozu candlestick pattern resembles a block, it doesn’t have any wicks, which means that the closing or opening price is identical to the candle’s max prices.

The shadows absents signals that the session started at a high price and ended at a low price. The Marubozu candlestick offers perspective about the upcoming course of a price.

Also read: Candlestick Patterns Cheat Sheet

Contents

Basics of Marubozu Candlesticks

Marubozu candlesticks reveal that during the day an asset is vigorously traded in one direction. The stock can close at its low price or highest price of the day.

Usually, the Marubozu candlesticks possess an elongated body without shadows. Yet in practice noting is perfect, and that applies to charts.

The name Marubozu is Japanese, and translates into “bald or shaved head". It’s an appropriate name if you take into account that candlesticks were created in Japan several centuries ago and were used by rice traders.

Today, rice is not the main asset that gets traded with the Marubozu chart pattern, but Japanese candlestick patterns are still used by investors thanks to the large quantity of data it provides.

There are several things investors can learn from this pattern. The formation signals that an asset is strongly trading in one direction. The Marubozu candle offers an opportunity to forecast the upcoming course of the stock’s price. The standard advice remains to confirm the signal with other technical indicators.

Also Read: 12 Forex Reversal Patterns You Must Know

Back to top

Bullish Marubozu

The bullish Marubozu candlestick signals that the price started at a lower point and ended at a higher point. The reason is that buyers controlled the assets price. The bullish Marubozu pattern has a green body. These candlesticks are frequently seen as convincing, and technical traders look for capitalize on them.

This type of candlestick reveals that there is a large purchasing interest in the asset or that traders prepare to buy at any price in a trading session. Because of this, the stock price will close at the session's high point.

If the bullish Marubozu is displayed at an uptrend, the implications are for the perpetuation of a trend. Still, if it emerges in a downtrend, it indicates a reversal in the trend, that attitude in the market has altered, and the stock is now bullish.

The assumption is that when the drastic change occurs, there will be a rush of bullish patterns that will likely remain in place in the upcoming trading sessions.

Investors have to search for purchasing options after the emergence of a bullish Marubozu. It's recommended that the buy price is just over the closing price of the bullish Marubozu.

Bullish Marubozu

Back to top

Bearish Marubozu

The bearish Marubozu candlestick signals the price started at a higher point and then closed at a lower level. This time the day when to the sellers who controlled the stock price. The long body of the bearish Marubozu candles is colored red.

With the bearish Marubozu pattern, the chart pattern can be read as large selling pressure on the asset that traders prepare to sell the stock at any point during the trading session. Because of these, the asset price closed close by the low point for the session.

When the bearish candlesticks occur in a downtrend, it signals a powerful trend continuation. If it happens in an uptrend, it functions as a trend reversal pattern, and the attitude of the market changes, the stock becomes bearish.

It is assumed that with the drastic change in attitude there will be a tide of bearishness that will continue in the following trading sessions. Investors need to search for possibilities to sell after the emergence of a bearish pattern. The recommended selling price is just under the closing price of the Marubozu.

Bearish Marubozu

Back to top

Trading with the Marubozu Pattern

When Marubozu candles happen, they are a signal of strength. If a bullish Marubozu occurs, that signals the bulls are in control and are fighting off the pressure exerted by short-sellers.

Frequently the bullish Marubozu results in a continuation of the upward trend. Alternatively, a bearish Marubozu candle is generally a signal of the dominance of bears. They are indicators that a bearish trend will start to develop.

There is no standard rule, and because of that, a Marubozu candle will result in reversal or consolidation.

Usually, the candlestick color reveals which side is in control of the market. The trading strategy is dependent on the Marubozu type. Most investors need a second verification pattern before starting a trade.

Marubozu Pattern3

Back to top

Advantages and Disadvantages

The crucial thing to understand about the Marubozu candlesticks is that investors don’t trade in the same direction as the candlestick, but have to trade against them. Experience has demonstrated that price reverse momentarily and absorbs the move from the candlestick.

The Marubozu pattern is excellent for revealing the attitude of the market for a pair of currencies. With the patterns investors in the forex market can assess pairing, which plays a central role in revealing the direction of the price movement in the short-term future.

The attitude is only one element influencing forex prices. Still, the Marubozu can generate false signals that produce losses for forex traders. The data received from Marubozu patterns needs to be verified from other indicators to assess possibilities for investment, guided by metrics like trading volume and lines of resistance.

An important step to undertake is the placement of stop-losses to safeguard against the pattern's limited reliability.

The standard recommendation is in place, consult other technical indicators when producing a signal with the Marubozu candle. If searching for an entry, take profit, and stop-loss, be careful because the pattern is not as accurate as other Japanese candlesticks formations.

Back to top

How Accurate Is the Marubozu?

The position of the Marubozu in the context of the larger trend is crucial for producing positive signals. That means keep your distance from Marubozu formations and the end of mature trends, this can change if traders observe a reversal.

The most obvious conclusion for traders when they see a Marubozu candle pattern is that a trend with strength has driven prices to the highs or lows of the time period. This type of price action suggests the continuation of the trend.

The price action is retrospective, and the position of the Marubozu within the bigger trend is important to its rewards. If the Marubozu shows at the end of the trend in a blow-off, it prepares the circumstances for a reversal in a trend and not a continuation.

When the Marubozu emerges in the middle of the trend, there is a possibility for trading. That option will not be as profitable if the Marubozu had emerged at the start of a new trend.

The Marubozu candle signals the market is trending in one direction. If the candle is broken down and analyzed, investors can see that in the entire session the price of an asset trades in one direction.

Back to top

Conclusion

In financial markets, the Marubozu candlestick pattern does not have a huge reputation, it’s not easy to observe the pattern, because it forms rarely on candlestick charts. Traders need to be careful when implementing the Marubozi candlestick pattern in the market.

The Marubozu candlesticks can get observed in every time frame on charts. Yet a single signal is not proof enough to start a trade. It can be more appropriate to trade during the day when the control of the market is in the hands of one side. Most traders need to learn the candlesticks to improve their trading techniques.

The Marubozu candlestick pattern is useful to estimate the attitude of the market because it indicates a continuation of the present trend. When the pattern is observed, for example on a crypto chart, at the starting stage of a new trend, the purchasing pressure drives the cryptocurrency’s price, causing it to trade higher.

If the Marubozu is observed at the end of a strong trend, then investors need to be careful because it can signal a reversal. The Marubozu formation is not hard to spot, yet its productivity is dependent on analyzing its position in a bigger trend.

This technical indicator can produce insights about the future course of a price, especially when trading cryptocurrencies, that process requires a wider market perspective. The implementation of fundamental analysis with a combination of other technical indicators is highly recommended.

Technical indicators are not the most productive tool if as a trader you don't understand candlesticks. With candlesticks, investors receive warnings about potential risk before most other indicators spot the problem.

The Marubuzo candlestick makes day trading easier because one side dominates for the day. Focus on learning candlesticks they are beneficial to every trading strategy and can save you from losing money rapidly.

Back to top

FAQs

How do You Trade Marubozu Candlestick Pattern?

When the Marubozu candlestick pattern forms check if it's bullish or bearish, in the case of bullish, when price breaks over, take a long position and place a stop under the candlesticks. While if bearish candlestick, when the price declines under, in that case, take a short and place a stopover candlestick.

What Happens After a Marubozu Candle?

When a bullish Marubozu occurs, it signals that bulls are still gaining strength and are not affected by the pressure from short-sellers. In most cases, the bullish Marubozu causes a continuation of the upward trend. Followed up with a bearish candle that makes a drastic decline in the asset price.

What does Bullish Marubozu Mean?

The bullish Marubozu shows there is purchasing interest for stock and during the day, traders were prepared to buy the stock at every price point, resulting in the asset closing close to the high point for the day. The buying price has to be near the closing price of the Marubozu.

How do You Use Marubozu Candles?

The Marubozu candles are a technical indicator that gets used to forecast the direction of an asset’s price.

Back to top


ezekiel chew asiaforexmentor

About Ezekiel Chew

Ezekiel Chew, founder and head of training at Asia Forex Mentor, is a renowned forex expert, frequently invited to speak at major industry events. Known for his deep market insights, Ezekiel is one of the top traders committed to supporting the trading community. Making six figures per trade, he also trains traders working in banks, fund management, and prop trading firms.

RELATED ARTICLES

What Is the Marubozu Candlestick Pattern

4.0
Overall Trust Index

Written by:

Updated:

January 29, 2025

Technical analysis attempts to predict the future course of an asset by looking at the movements in the price. Yet many traders believe that the main focus needs to be on studying the psychology that influences price movements. Their opinion is that assets are mostly affected by how people react to circumstances.

Many technical indicators and candlestick patterns get used to understanding market dynamics, and the Marubozu candlestick pattern is not well known, but works well when it is observed.

Marubozu Pattern
Photo credit: Pixabay.com

The Marubozu candlestick pattern resembles a block, it doesn’t have any wicks, which means that the closing or opening price is identical to the candle’s max prices.

The shadows absents signals that the session started at a high price and ended at a low price. The Marubozu candlestick offers perspective about the upcoming course of a price.

Also read: Candlestick Patterns Cheat Sheet

Contents

Basics of Marubozu Candlesticks

Marubozu candlesticks reveal that during the day an asset is vigorously traded in one direction. The stock can close at its low price or highest price of the day.

Usually, the Marubozu candlesticks possess an elongated body without shadows. Yet in practice noting is perfect, and that applies to charts.

The name Marubozu is Japanese, and translates into “bald or shaved head". It’s an appropriate name if you take into account that candlesticks were created in Japan several centuries ago and were used by rice traders.

Today, rice is not the main asset that gets traded with the Marubozu chart pattern, but Japanese candlestick patterns are still used by investors thanks to the large quantity of data it provides.

There are several things investors can learn from this pattern. The formation signals that an asset is strongly trading in one direction. The Marubozu candle offers an opportunity to forecast the upcoming course of the stock’s price. The standard advice remains to confirm the signal with other technical indicators.

Also Read: 12 Forex Reversal Patterns You Must Know

Back to top

Bullish Marubozu

The bullish Marubozu candlestick signals that the price started at a lower point and ended at a higher point. The reason is that buyers controlled the assets price. The bullish Marubozu pattern has a green body. These candlesticks are frequently seen as convincing, and technical traders look for capitalize on them.

This type of candlestick reveals that there is a large purchasing interest in the asset or that traders prepare to buy at any price in a trading session. Because of this, the stock price will close at the session's high point.

If the bullish Marubozu is displayed at an uptrend, the implications are for the perpetuation of a trend. Still, if it emerges in a downtrend, it indicates a reversal in the trend, that attitude in the market has altered, and the stock is now bullish.

The assumption is that when the drastic change occurs, there will be a rush of bullish patterns that will likely remain in place in the upcoming trading sessions.

Investors have to search for purchasing options after the emergence of a bullish Marubozu. It's recommended that the buy price is just over the closing price of the bullish Marubozu.

Bullish Marubozu

Back to top

Bearish Marubozu

The bearish Marubozu candlestick signals the price started at a higher point and then closed at a lower level. This time the day when to the sellers who controlled the stock price. The long body of the bearish Marubozu candles is colored red.

With the bearish Marubozu pattern, the chart pattern can be read as large selling pressure on the asset that traders prepare to sell the stock at any point during the trading session. Because of these, the asset price closed close by the low point for the session.

When the bearish candlesticks occur in a downtrend, it signals a powerful trend continuation. If it happens in an uptrend, it functions as a trend reversal pattern, and the attitude of the market changes, the stock becomes bearish.

It is assumed that with the drastic change in attitude there will be a tide of bearishness that will continue in the following trading sessions. Investors need to search for possibilities to sell after the emergence of a bearish pattern. The recommended selling price is just under the closing price of the Marubozu.

Bearish Marubozu

Back to top

Trading with the Marubozu Pattern

When Marubozu candles happen, they are a signal of strength. If a bullish Marubozu occurs, that signals the bulls are in control and are fighting off the pressure exerted by short-sellers.

Frequently the bullish Marubozu results in a continuation of the upward trend. Alternatively, a bearish Marubozu candle is generally a signal of the dominance of bears. They are indicators that a bearish trend will start to develop.

There is no standard rule, and because of that, a Marubozu candle will result in reversal or consolidation.

Usually, the candlestick color reveals which side is in control of the market. The trading strategy is dependent on the Marubozu type. Most investors need a second verification pattern before starting a trade.

Marubozu Pattern3

Back to top

Advantages and Disadvantages

The crucial thing to understand about the Marubozu candlesticks is that investors don’t trade in the same direction as the candlestick, but have to trade against them. Experience has demonstrated that price reverse momentarily and absorbs the move from the candlestick.

The Marubozu pattern is excellent for revealing the attitude of the market for a pair of currencies. With the patterns investors in the forex market can assess pairing, which plays a central role in revealing the direction of the price movement in the short-term future.

The attitude is only one element influencing forex prices. Still, the Marubozu can generate false signals that produce losses for forex traders. The data received from Marubozu patterns needs to be verified from other indicators to assess possibilities for investment, guided by metrics like trading volume and lines of resistance.

An important step to undertake is the placement of stop-losses to safeguard against the pattern's limited reliability.

The standard recommendation is in place, consult other technical indicators when producing a signal with the Marubozu candle. If searching for an entry, take profit, and stop-loss, be careful because the pattern is not as accurate as other Japanese candlesticks formations.

Back to top

How Accurate Is the Marubozu?

The position of the Marubozu in the context of the larger trend is crucial for producing positive signals. That means keep your distance from Marubozu formations and the end of mature trends, this can change if traders observe a reversal.

The most obvious conclusion for traders when they see a Marubozu candle pattern is that a trend with strength has driven prices to the highs or lows of the time period. This type of price action suggests the continuation of the trend.

The price action is retrospective, and the position of the Marubozu within the bigger trend is important to its rewards. If the Marubozu shows at the end of the trend in a blow-off, it prepares the circumstances for a reversal in a trend and not a continuation.

When the Marubozu emerges in the middle of the trend, there is a possibility for trading. That option will not be as profitable if the Marubozu had emerged at the start of a new trend.

The Marubozu candle signals the market is trending in one direction. If the candle is broken down and analyzed, investors can see that in the entire session the price of an asset trades in one direction.

Back to top

Conclusion

In financial markets, the Marubozu candlestick pattern does not have a huge reputation, it’s not easy to observe the pattern, because it forms rarely on candlestick charts. Traders need to be careful when implementing the Marubozi candlestick pattern in the market.

The Marubozu candlesticks can get observed in every time frame on charts. Yet a single signal is not proof enough to start a trade. It can be more appropriate to trade during the day when the control of the market is in the hands of one side. Most traders need to learn the candlesticks to improve their trading techniques.

The Marubozu candlestick pattern is useful to estimate the attitude of the market because it indicates a continuation of the present trend. When the pattern is observed, for example on a crypto chart, at the starting stage of a new trend, the purchasing pressure drives the cryptocurrency’s price, causing it to trade higher.

If the Marubozu is observed at the end of a strong trend, then investors need to be careful because it can signal a reversal. The Marubozu formation is not hard to spot, yet its productivity is dependent on analyzing its position in a bigger trend.

This technical indicator can produce insights about the future course of a price, especially when trading cryptocurrencies, that process requires a wider market perspective. The implementation of fundamental analysis with a combination of other technical indicators is highly recommended.

Technical indicators are not the most productive tool if as a trader you don't understand candlesticks. With candlesticks, investors receive warnings about potential risk before most other indicators spot the problem.

The Marubuzo candlestick makes day trading easier because one side dominates for the day. Focus on learning candlesticks they are beneficial to every trading strategy and can save you from losing money rapidly.

Back to top

FAQs

How do You Trade Marubozu Candlestick Pattern?

When the Marubozu candlestick pattern forms check if it's bullish or bearish, in the case of bullish, when price breaks over, take a long position and place a stop under the candlesticks. While if bearish candlestick, when the price declines under, in that case, take a short and place a stopover candlestick.

What Happens After a Marubozu Candle?

When a bullish Marubozu occurs, it signals that bulls are still gaining strength and are not affected by the pressure from short-sellers. In most cases, the bullish Marubozu causes a continuation of the upward trend. Followed up with a bearish candle that makes a drastic decline in the asset price.

What does Bullish Marubozu Mean?

The bullish Marubozu shows there is purchasing interest for stock and during the day, traders were prepared to buy the stock at every price point, resulting in the asset closing close to the high point for the day. The buying price has to be near the closing price of the Marubozu.

How do You Use Marubozu Candles?

The Marubozu candles are a technical indicator that gets used to forecast the direction of an asset’s price.

Back to top


ezekiel chew asiaforexmentor

About Ezekiel Chew

Ezekiel Chew, founder and head of training at Asia Forex Mentor, is a renowned forex expert, frequently invited to speak at major industry events. Known for his deep market insights, Ezekiel is one of the top traders committed to supporting the trading community. Making six figures per trade, he also trains traders working in banks, fund management, and prop trading firms.

RELATED ARTICLES

Scroll to top

Join the Live Event
Get Your Free Ticket Now

I consent to receiving emails and/or text message reminders for this event.

REGISTER FOR THE MASTERCLASS!