The world of candlestick patterns offers traders a powerful visual representation of market sentiment and potential price movements. Among these patterns, the matching low pattern stands out for its indication of a bullish trend reversal. This article will delve into the matching low pattern, exploring its identification, trading strategies, and the advantages and drawbacks of using this pattern in your trading arsenal.
Spotting the matching low pattern on candlestick charts involves identifying two bearish candlesticks with the same closing price during a downtrend. Trading this pattern effectively requires recognizing its confirmation candle, setting a proper stop loss, and determining profit targets based on resistance levels. By understanding these elements, traders can better incorporate the matching low pattern into their strategies for more informed decision-making.
Also Read: The 28 Forex Patterns Complete Guide
What is the Matching Low Pattern?
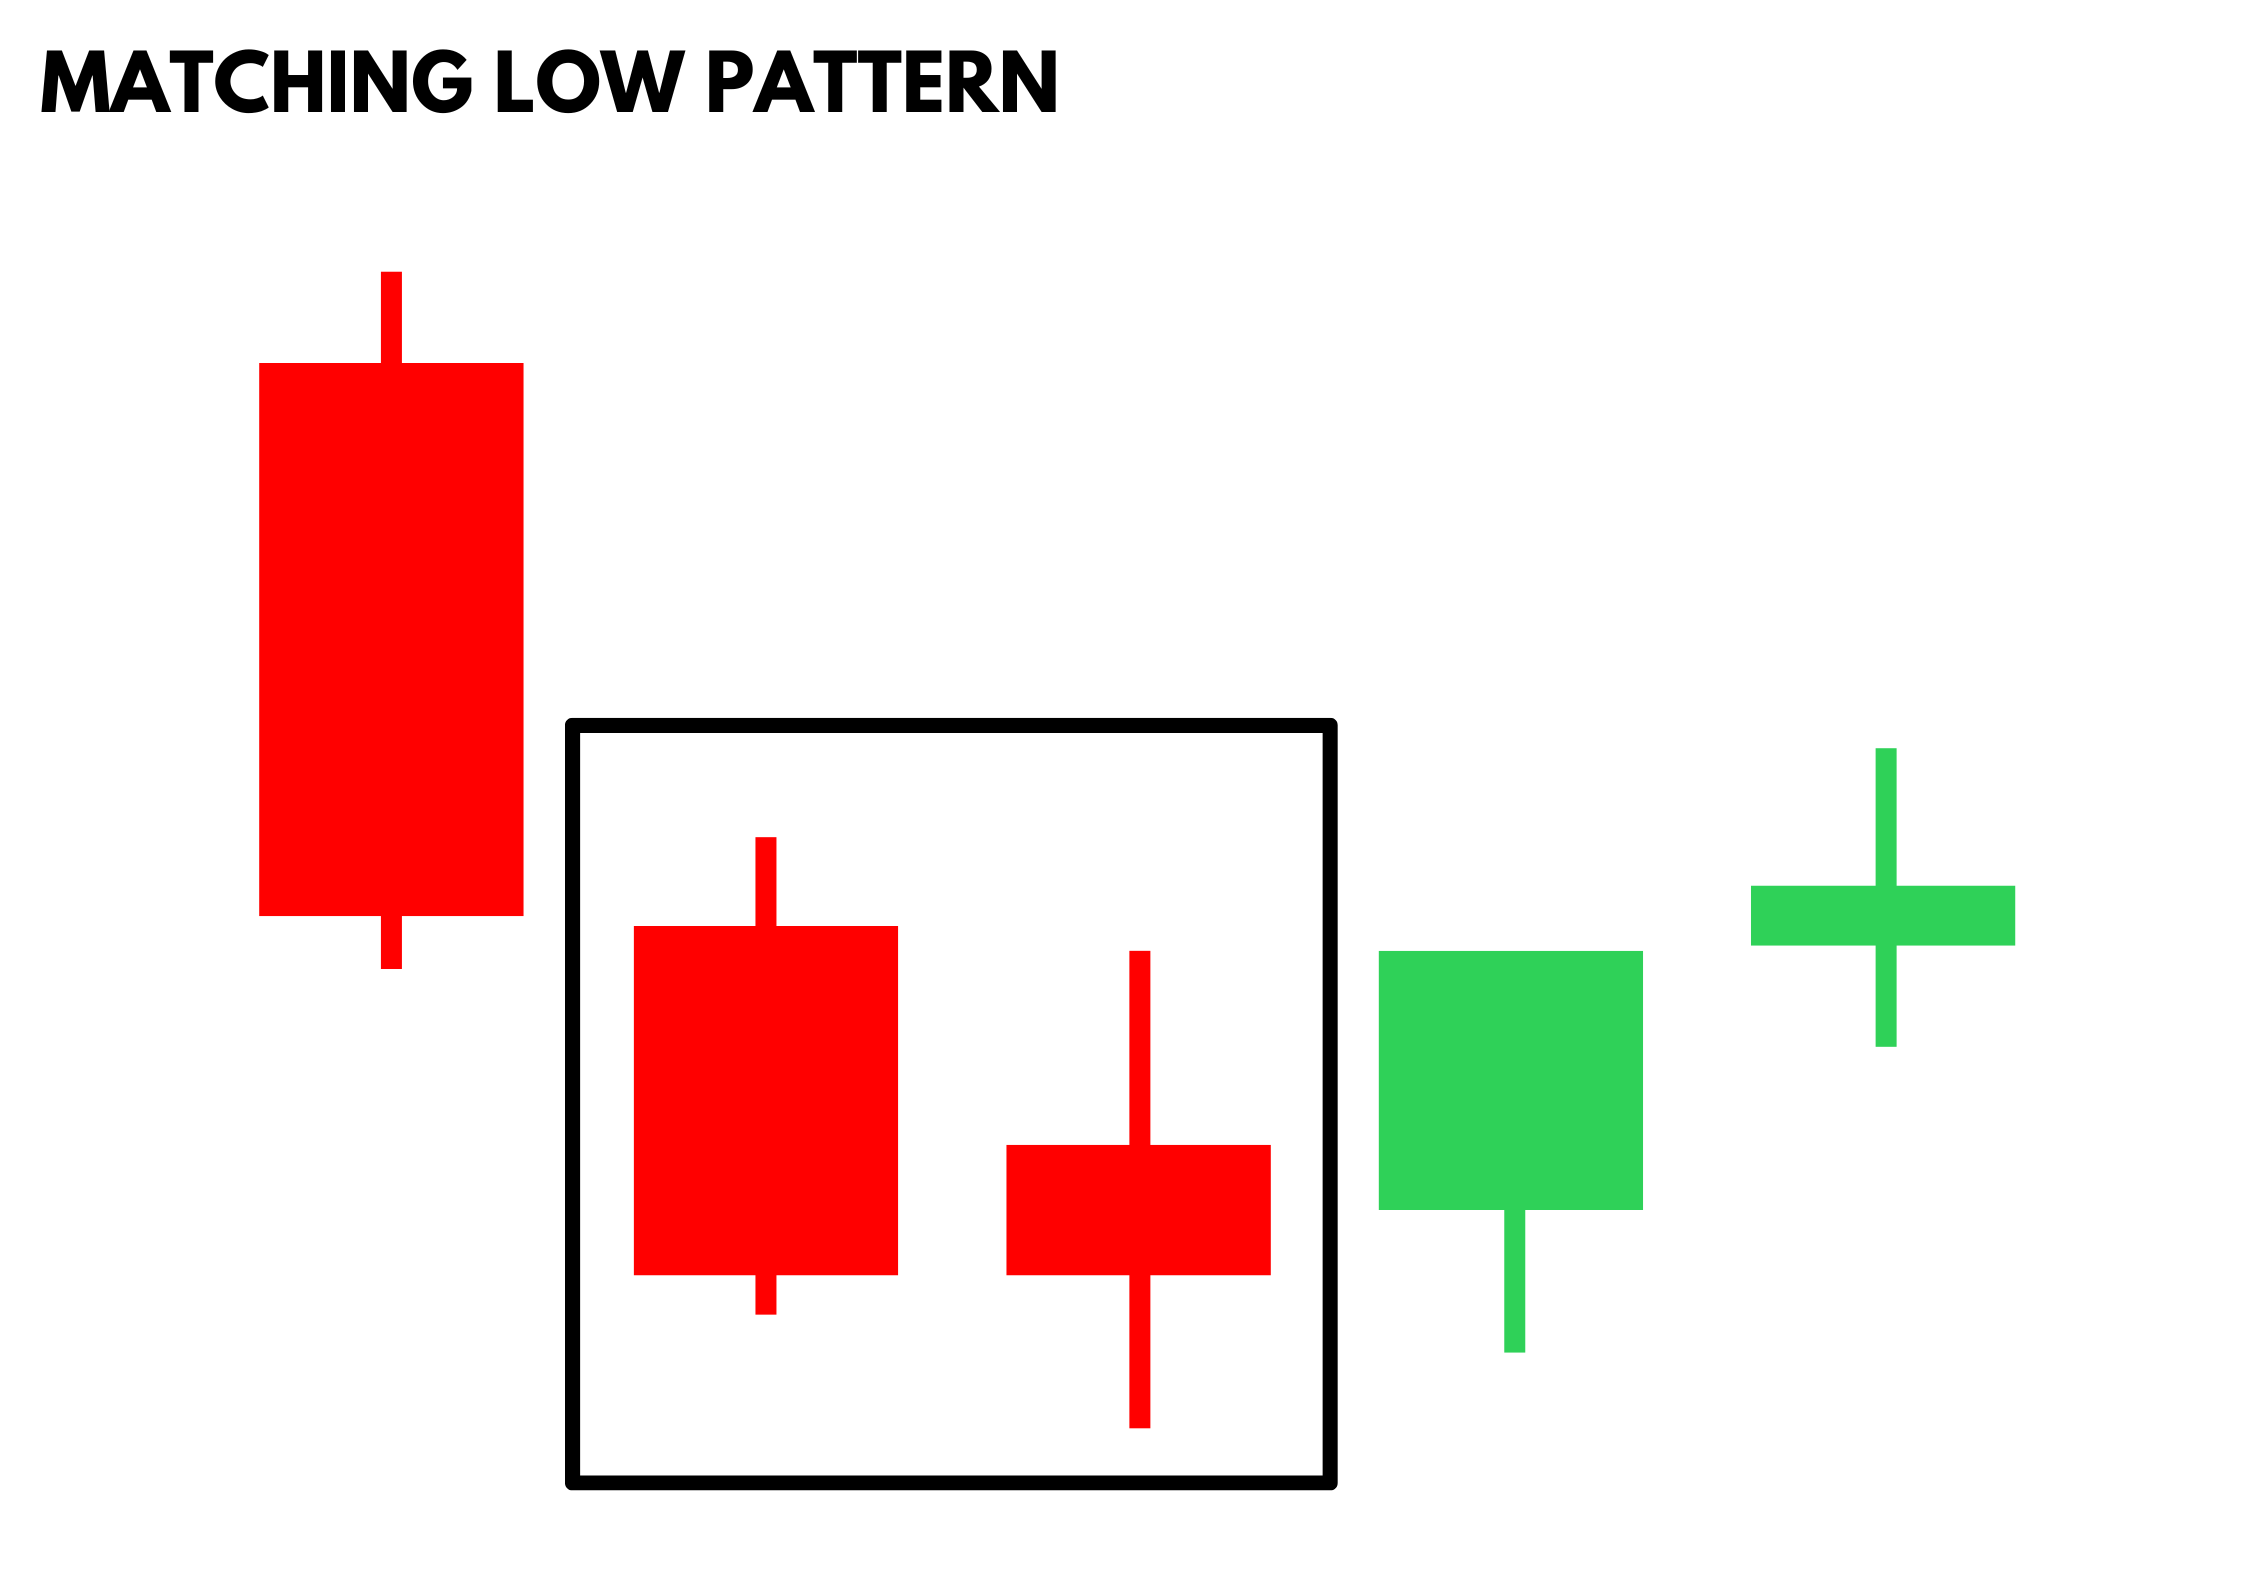
The matching low pattern is a two-candle bullish reversal pattern that signals the potential end of a downtrend. This pattern occurs when two consecutive bearish candlesticks have matching closing prices. The closing price of the second candle matches that of the first, suggesting that the bearish trend may be losing steam and a bullish reversal could be on the horizon.
Spotting the matching low pattern involves identifying these two bearish candlesticks with the same closing price during a downtrend. This pattern indicates that the market sentiment might be shifting, and traders should watch for a confirmation candle to validate the potential bullish reversal.
How to Spot the Matching Low Pattern
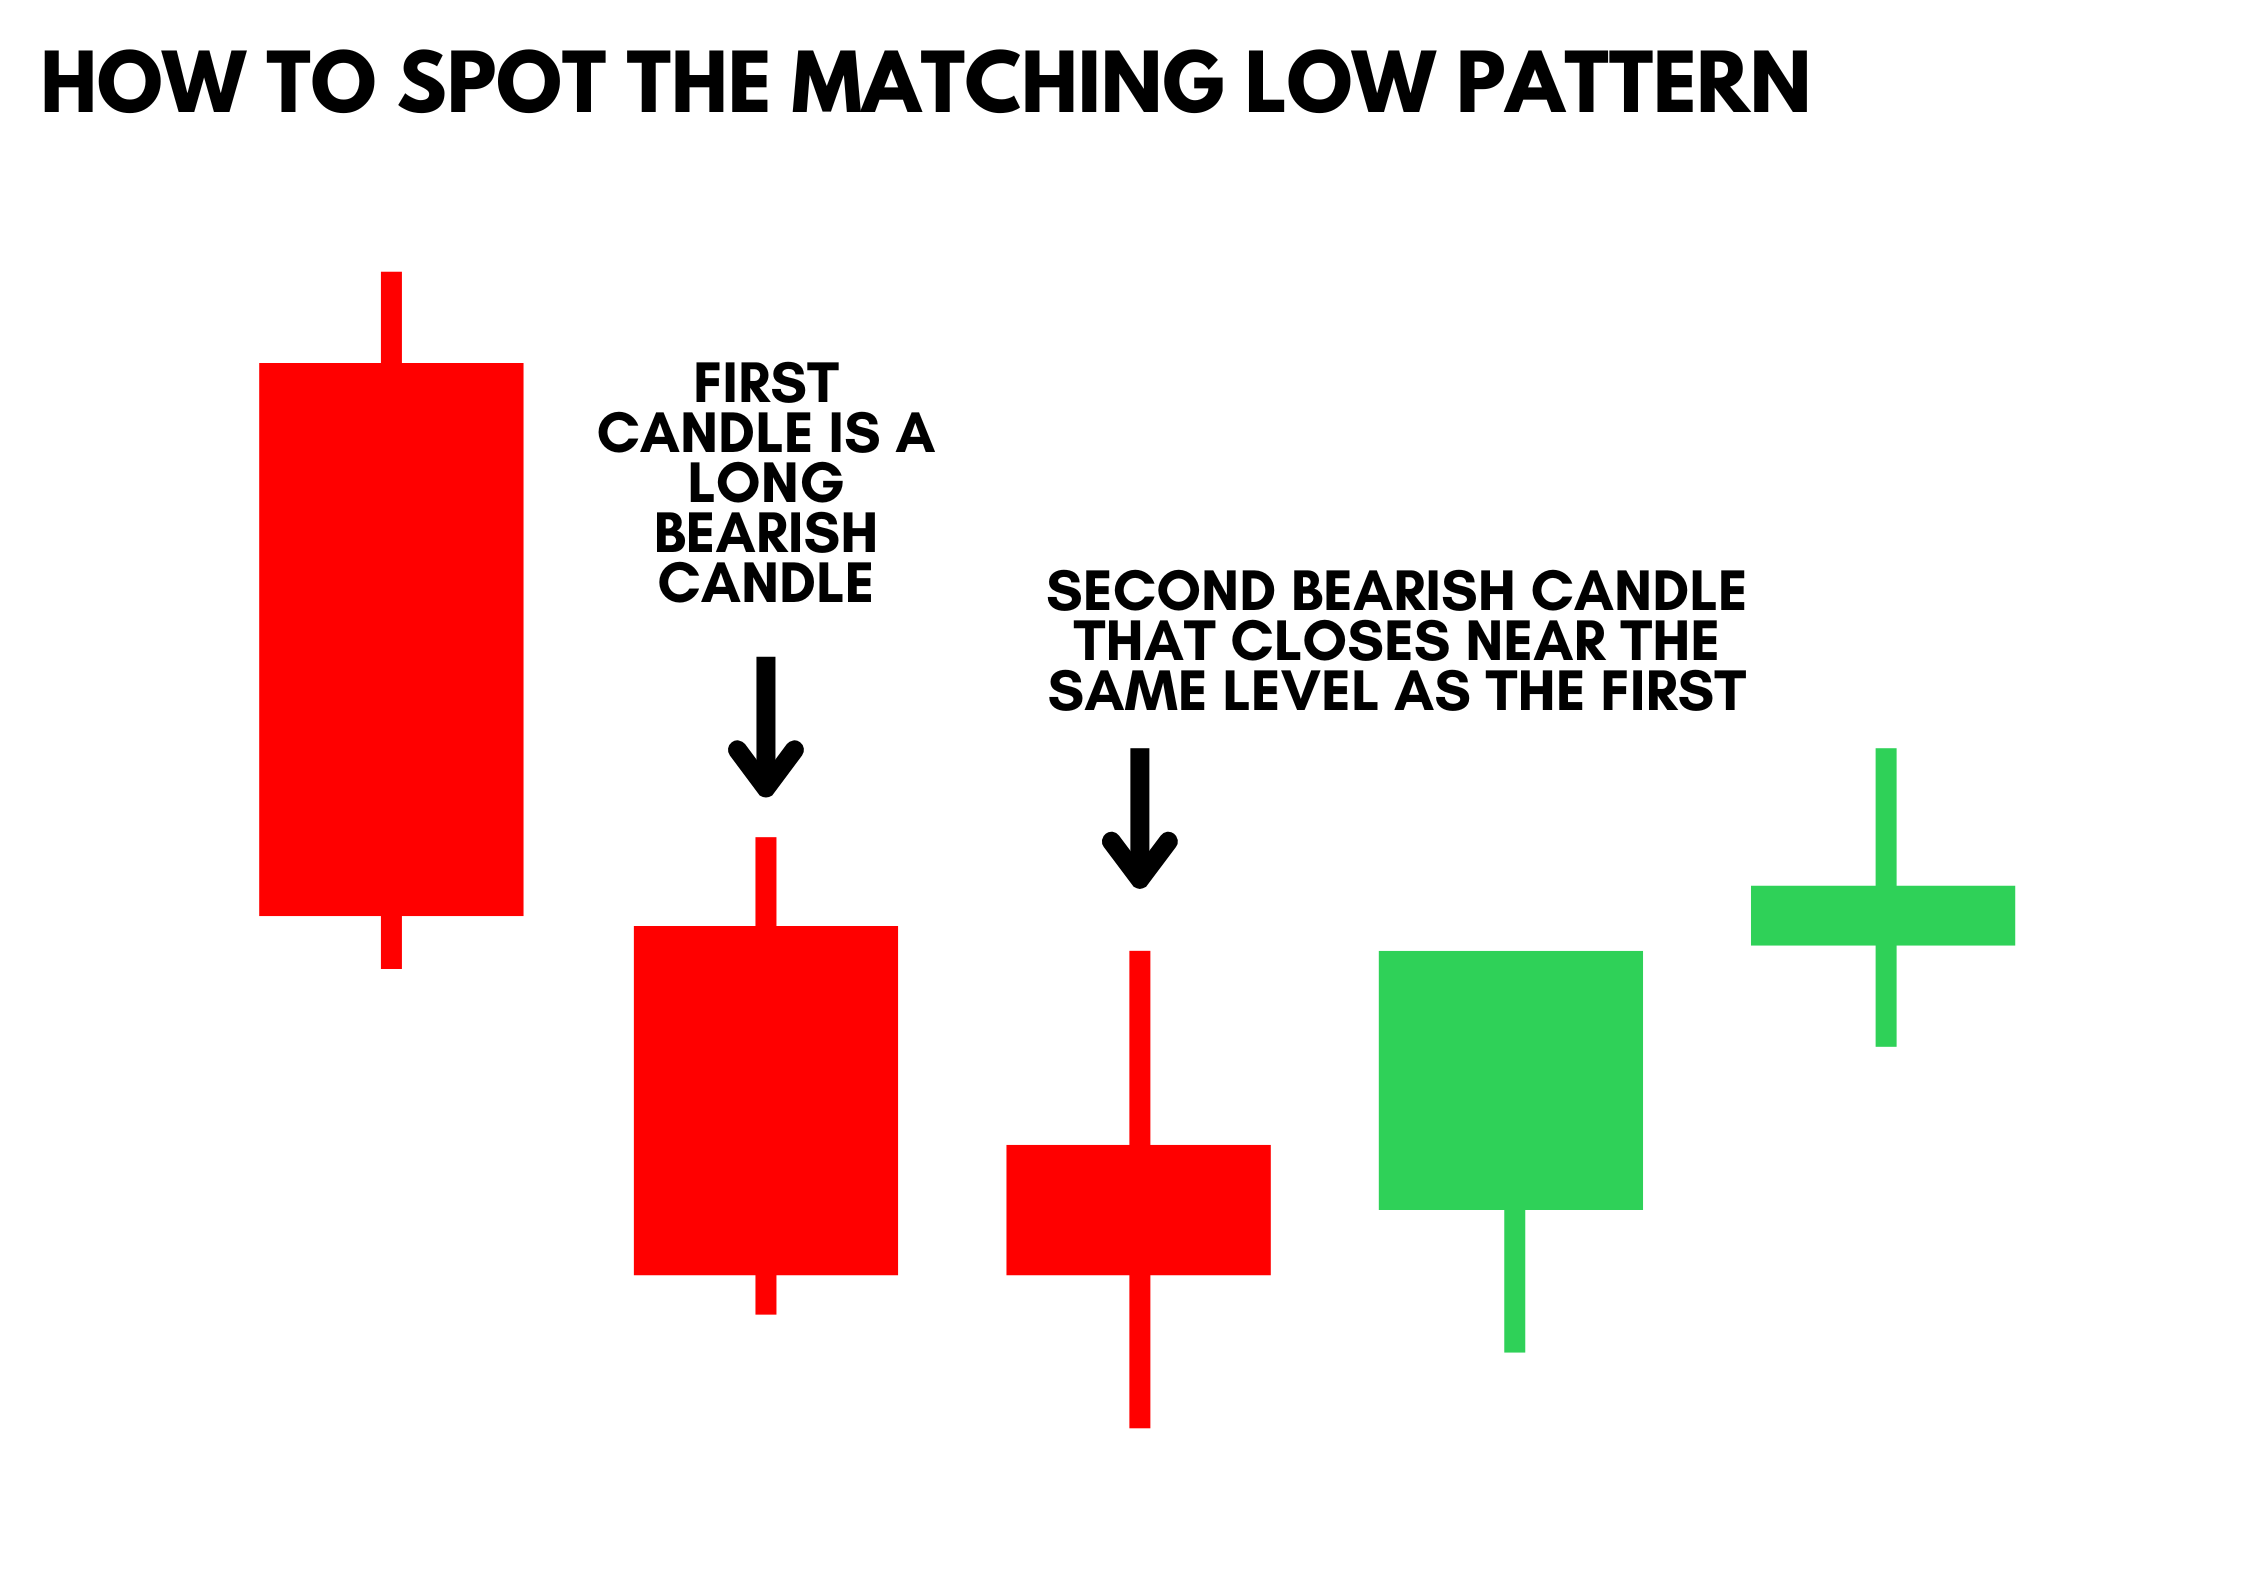
Spotting the matching low pattern on candlestick charts involves identifying two bearish candlesticks with the same closing price. The following characteristics define this pattern:
- Two Candles: The pattern consists of two bearish candlesticks.
- Same Closing Price: The closing price of the second candle matches the closing price of the first candle.
- Lower Shadows: Both candles typically have lower shadows, indicating buying pressure at the lower price levels.
The pattern appears during a downtrend and suggests that the bears are losing control, paving the way for potential bullish movements.
The matching low pattern appears during a downtrend and suggests that the bears are losing control, paving the way for potential bullish movements. This pattern indicates that the selling pressure is waning, as the second candle fails to close lower than the first, creating a potential support level.
The pattern's significance lies in its ability to signal a potential bullish reversal. However, it is essential to wait for a confirmation candle, which should be a bullish candlestick closing higher than the closing prices of the matching low candles. This confirmation reduces the risk of false signals, which can occur frequently with this pattern. Additionally, incorporating technical indicators such as volume and RSI can further validate the pattern's reliability.
How to Trade the Matching Low Pattern
Entry Point
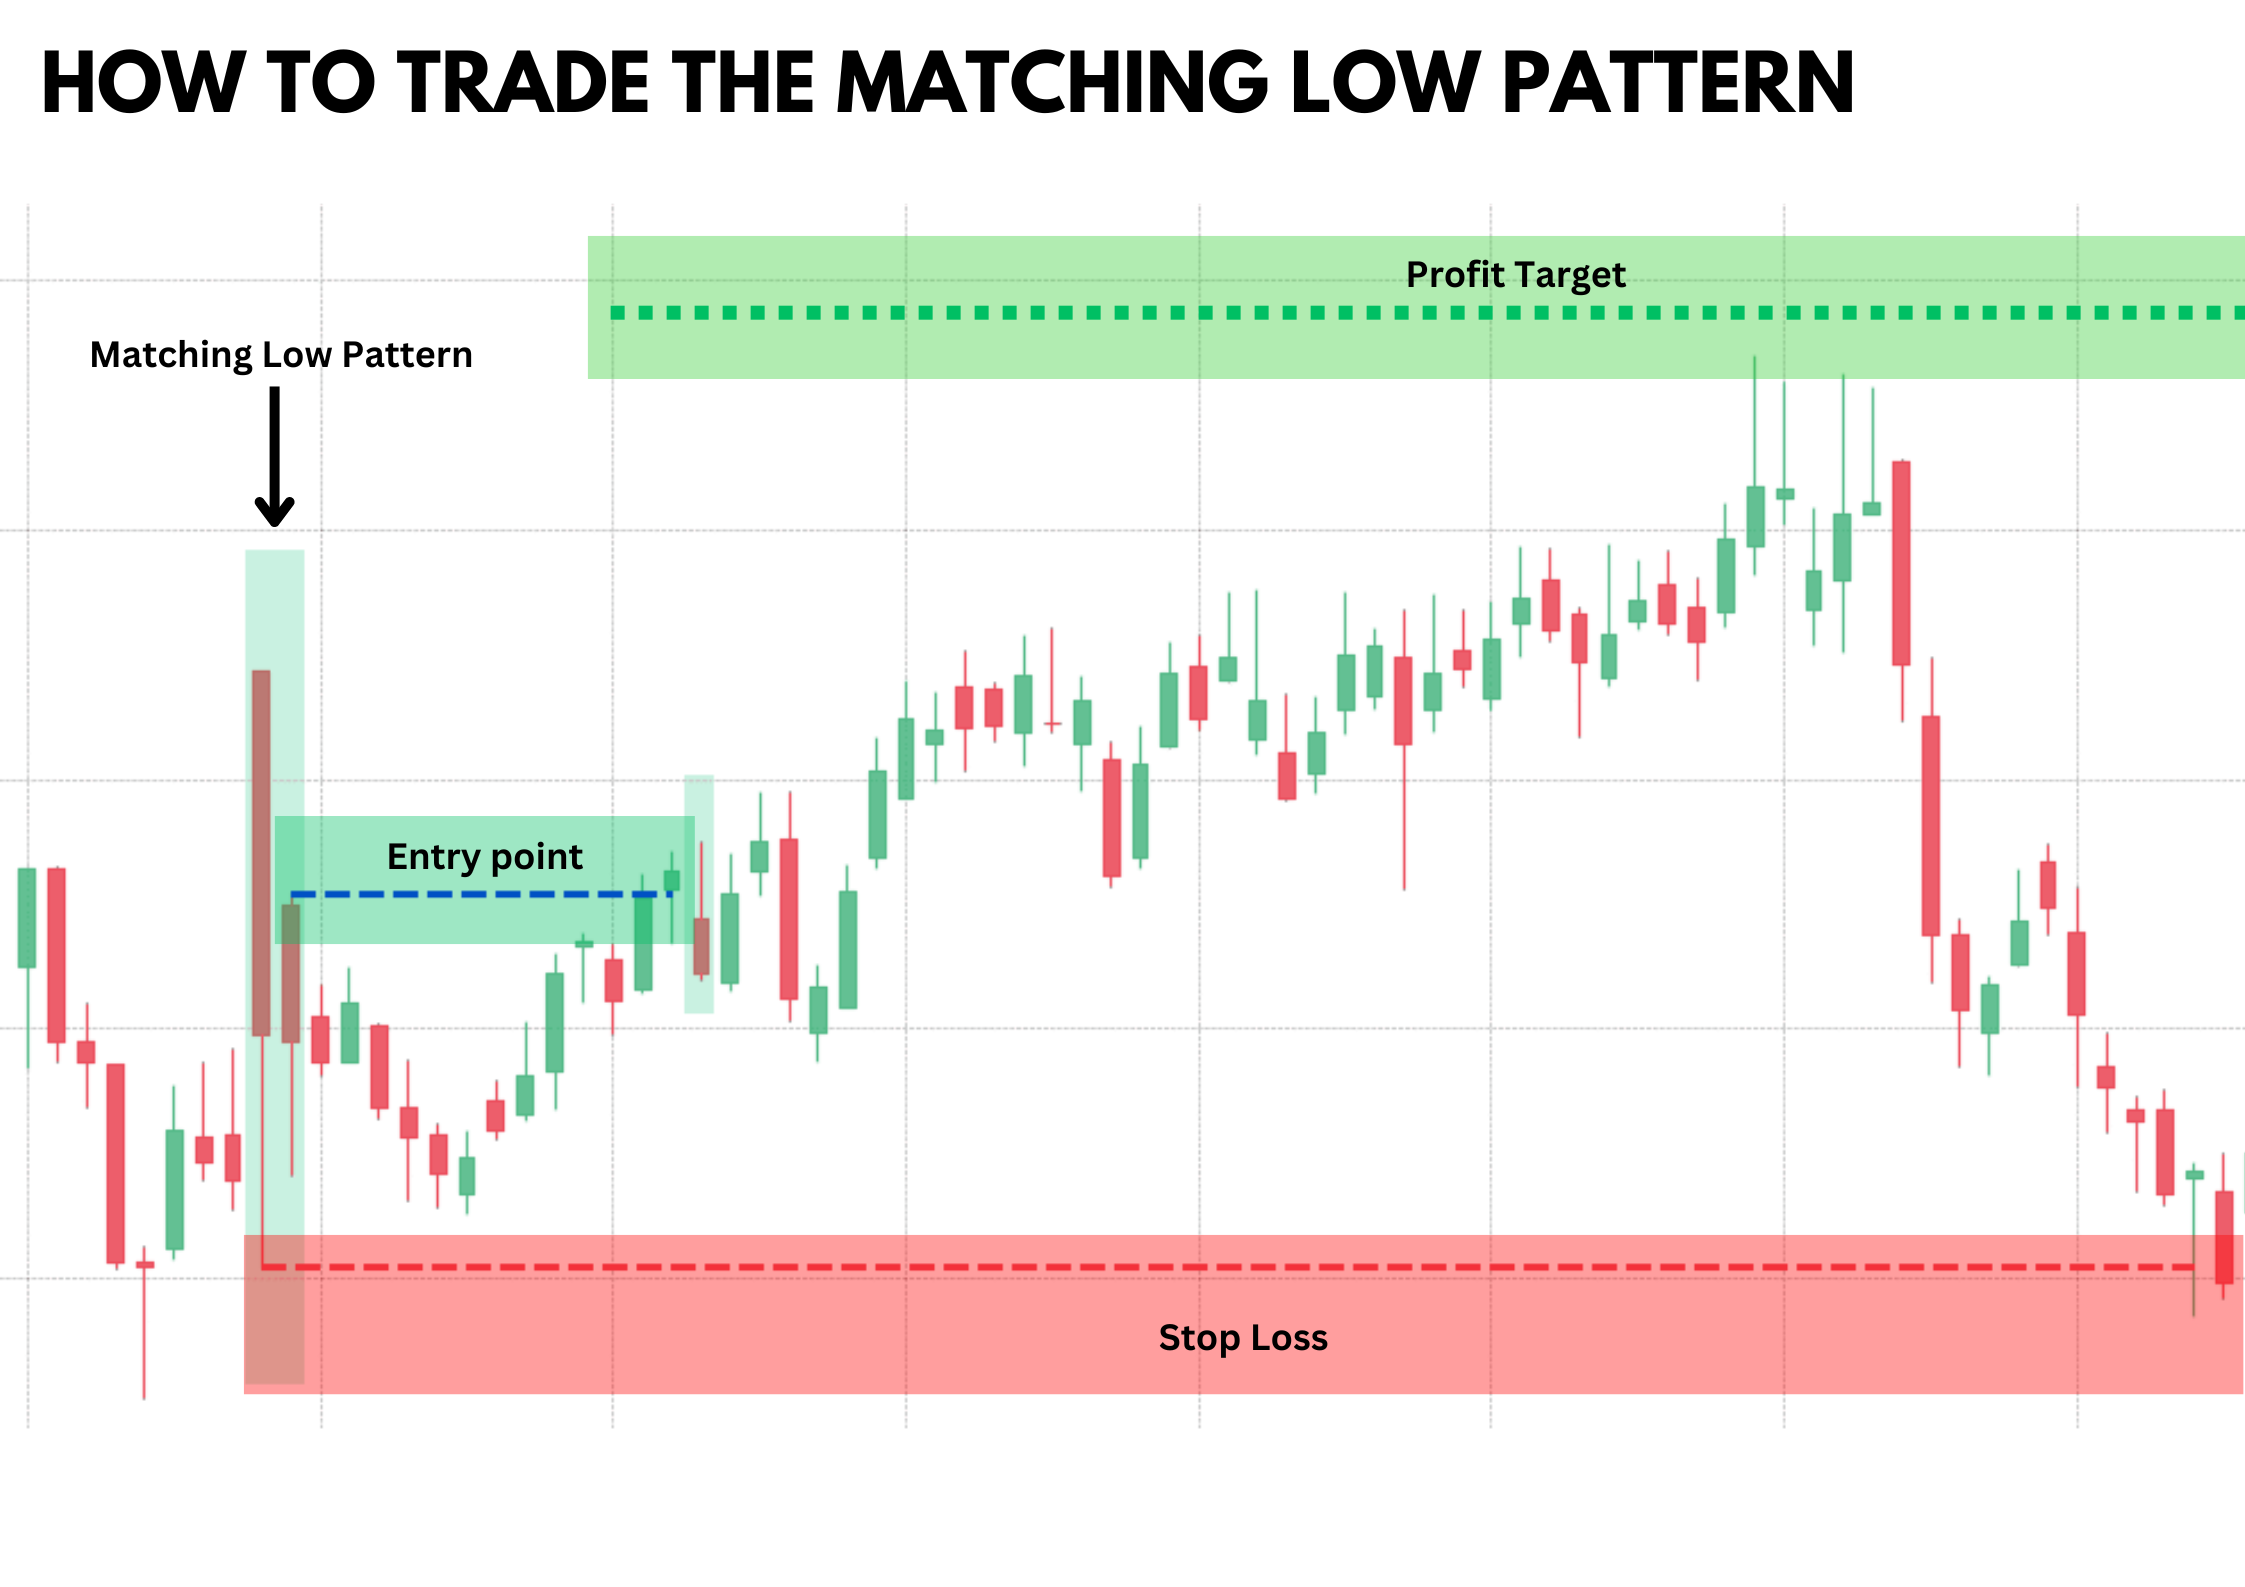
To trade the matching low pattern, consider the following steps:
- Identify the Pattern: Look for two consecutive bearish candlesticks with matching closing prices during a downtrend.
- Confirmation Candle: Wait for a confirmation candle, which should be a bullish candlestick that closes higher than the closing prices of the two matching low candles. This candle's close generates a signal to enter a long position.
Stop Loss
Setting a stop loss is crucial to manage risk when trading the matching low pattern. Place the stop loss just below the lower shadow of the second candle. This level acts as a support level, and if the price falls below it, the bullish reversal pattern is invalidated. This ensures that traders minimize their losses if the pattern does not result in an expected upward movement.
By setting the stop loss at this critical point, traders can protect themselves from significant downturns. This method allows them to exit trades promptly if the market continues to decline, ensuring that they adhere to disciplined trading practices. Additionally, using technical indicators such as volume analysis and moving averages can further validate the stop loss placement, enhancing the overall effectiveness of the trading strategy.
Profit Target
Determine your profit targets based on the following:
- Previous Resistance Levels: Identify key resistance levels where the stock's price might encounter selling pressure.
- Risk-Reward Ratio: Aim for a favorable risk-reward ratio, typically at least 1:2 or 1:3.
Pros and Cons of the Matching Low Pattern
Pros
- Provides an early indication of a potential bullish trend reversal.
- Offers well-defined entry and exit points based on candlestick patterns.
- Easy to spot on candlestick charts, making it accessible for traders of all levels.
Cons
- Can produce false signals in a strong bearish trend.
- Needs a confirmation candle to validate the pattern, which may result in missed opportunities.
- Effectiveness can vary based on overall market conditions and sentiment.
Indicators to Use to Confirm the Pattern
Relative Strength Index (RSI)
Relative Strength Index (RSI) is one of the most effective tools. RSI measures the speed and change of price movements, typically indicating overbought conditions above 70 and oversold conditions below 30. When a matching low pattern forms and the RSI shows oversold conditions, it suggests a potential reversal, making the bullish signal stronger.
Moving Averages
Moving averages are another useful confirmation tool for the matching low pattern. They help identify the overall market trend by smoothing out price data. If a matching low pattern coincides with the price action interacting with key moving averages, such as the 50-day or 200-day moving averages, it provides a solid confirmation of the trend reversal. This interaction indicates that the price is aligning with significant support or resistance levels, adding credibility to the pattern.
Volume
Volume is a critical indicator when confirming the matching low pattern. Higher trading volume on the confirmation candle significantly strengthens the validity of the pattern. Increased volume indicates strong participation from traders, suggesting a higher level of conviction in the market's move. This increased activity supports the pattern's indication of a potential reversal, as it reflects heightened interest and buying pressure.
MACD
MACD (Moving Average Convergence Divergence) is another valuable indicator to use alongside the matching low pattern. The MACD tracks the relationship between two moving averages of a security’s price, providing insights into momentum. A bullish crossover or divergence where the price makes new lows, but the MACD does not, can validate bullish candlestick formations like the matching low pattern, confirming the potential for a price reversal.
Bollinger Bands
Bollinger Bands also serve as an excellent confirmation tool. These bands plot standard deviation levels above and below a moving average, highlighting periods of high or low volatility. When a matching low pattern forms near the lower Bollinger Band, it suggests that the price is reaching oversold conditions, which could precede a bullish reversal. This confluence adds further weight to the reversal signal provided by the matching low pattern.
Conclusion
The matching low pattern is a valuable tool for traders looking to identify potential bullish reversals. By understanding how to spot and trade this pattern, along with the use of complementary technical indicators, traders can enhance their trading strategies and make more informed decisions. Remember to always manage risk through proper stop loss placement and to consider market conditions when trading any candlestick pattern.
Also Read: How to Trade the Homing Pigeon Pattern
FAQs
What is the matching low pattern?
The matching low pattern is a bullish trend reversal pattern consisting of two consecutive bearish candlesticks with matching closing prices.
How do you trade the matching low pattern?
To trade the matching low pattern, identify the pattern during a downtrend, wait for a confirmation candle, set a stop loss below the second candle's lower shadow, and target previous resistance levels for profit.
What indicators can confirm the matching low pattern?
Indicators such as RSI, moving averages, and trading volume can be used to confirm the matching low pattern and enhance its reliability in predicting a trend reversal.