Traders love chart patterns, the reason is in the simplicity they offer for trading, no matter the type of pattern, investors can get assured they will receive points of entry and exit. The crucial thing for a technical analyst is to identify the pattern correctly and use the information to facilitate trades.

The chart pattern is not a new invention, they have been used for over a century, proving traders have always relayed on technical analysis to get a read on the market.
It’s time to discover the properties of the Megaphone pattern that was introduced to the trading community 85 years ago by Richard Schabacker.
Also Read: What Is The Rectangle Pattern?
Contents
- What the Megaphone Pattern Consists Of
- Elements of Megaphone Patterns
- Bullish or Bearish Pattern
- Trading Opportunities of the Megaphone Pattern
- What Is a Broadening Formation?
- Conclusion
- FAQs
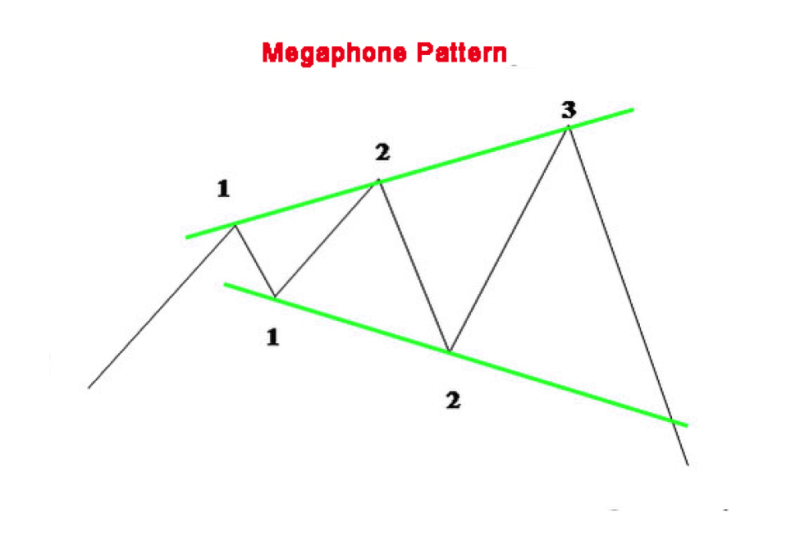
What the Megaphone Pattern Consists Of
The megaphone pattern consists of at least 2 higher highs and the same number of lower lows. Typically the pattern emerges during high volatility in a market, and investors are skeptical about the future trend of the market.
The benefit of the pattern is in the numerous opportunities it offers for trading, including situations when it fails, yet it’s important to identify the failure precisely.
However, like with any other technical indicator or chart pattern for favorable results all data needs to get verified from several sources. And using a combined approach for locating entry and exit points is a recipe for stock market profits.
Elements of Megaphone Patterns
Most patterns have several characteristics that define them, and the way megaphone patterns form is no exclusion.
Intrinsic Behavior
The pattern gets created during the dual between bears and bulls that are locked in a contest for domination over the asset.
After the bulls drive prices higher, the pattern gets formed. But when the Megaphone Top gets formed the bears influence the decline of prices, and that results in the creation of lower lows.
The final victory in this struggle goes to the bears.
Volume
Identifying the pattern in large part comes down to volume. During the Megaphone Top, the volume spikes together with prices. The rise in volume is a potent indicator when the pattern is verified.
Price Targets
The target price alludes to the prospective price move that gets displayed by the pattern. Traders can perceive it as if the pattern's target price is sufficient to provide an adequate comeback after commissions get tallied.
A preferred rule is for the target price to be larger than five percent. Yet the current price needs to get considered when the trade is performing favorably.
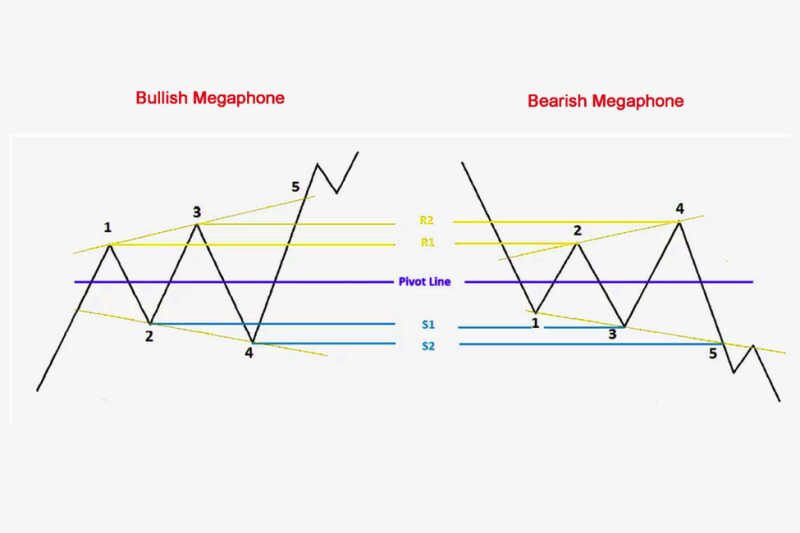
Bullish or Bearish Pattern
The pattern can get displayed as a bullish megaphone chart pattern or a bullish megaphone chart pattern.
The bullish phase begins when it starts going up a channel while the bearish if it goes down the channel. Investors need to observe price action when it contacts the lower and upper channels.
The important thing to spot is if the trend gets formed away from the megaphone.
Also Read: Harmonic Patterns: A Complete Guide
Trading Opportunities of the Megaphone Pattern
Investors prefer to use megaphone patterns because they offer few options for trading, making it possible to implement them in swing trades, breakout trades, and failures.
Let's explore the different opportunities for using the Megaphone pattern.
Failures
The curious thing about the pattern is that it can get used even if it fails. Yet for this to be done successfully the pattern has to get confirmed accurately.
So, how do you identify a failure? It can get recognized when it fails to break the trend line following the fifth swing.
If we assume that there is a bull market, the pattern gets created, and if it doesn't manage to break the upper trend line, investors will be short if the price moves under the third swing high.
The circumstances are similar, if a bear stage is emerging in the market but fails to penetrate the lower trend line. Investors prefer a long position when the price closes over the third swing high.
Breakout Trades
If the price breaks the trend line following the fifth swing and closes away from the pattern, the breakout gets verified.
Breakout can occur in both positive and negative directions. Conditioned upon the circumstances in the market and the position of the pattern in the chart, breakouts of bullish and bearish types can occur.
Following a long bull run, the pattern is created at the top while the price closes under the lower trend line, in this case, it is a pattern of a trend reversal.
However, when the price closes over the trend line that is higher and achieves new highs in the chart, in that case, it will get described as a Continuation pattern.
Investors can make a trade if the price closes away from the pattern, the specific direction is not important to have the best possible verification of the breakout.
Swing Trades
This is a geometrical pattern, that's in the habit of following Fibonacci levels. However, it’s not possible to regard the Fibonacci levels without having regard for Pivot lines.
Making it clear that the pattern will have a definite line that will serve as its pivot line, and corresponding support and resistance lines will be present in the pattern.
Traders that prefer long positions can use resistance points one and two for their long trades, while support points one and two can act as support in the case of a short position.
Locating the target can be problematic in cases of breakouts. The reason is that is very hard to locate the best exit.
Yet there is an option to create an exit. Investors estimate the interval between 2 trend lines from the breaking point and make profits if the price goes to sixty percent of that Redline.
What Is a Broadening Formation?
The megaphone pattern is also called the broadening formation. The patterns start to develop when the market is experiencing a higher risk during a prolonged period.
It is influenced by political developments like elections, which can play a role in creating the megaphone stock pattern. Basically, every type of uncertainty will contribute to the formation of the pattern.
This is logical in the case of an election, when a new person gets voted into office his decision can influence the course of events in a country, and in turn, can affect the market.
And this is one reason for the bullish and bearish dynamic of the market, those fluctuations are influenced by the political situation.
Another contributing factor is earnings season, the number directly influences the future value of stocks, with positive earnings balance for the quarter bringing in optimism for investors, while negative outcomes create pessimism, and this reaction translates into the broadening formation.
Trend lines play a big role in technical analysis, and this makes it possible for day and swing traders to use the volatility in a broadening formation and make a profit.
Conclusion
Traders benefit from patterns because they enable them to forecast the direction of the price. The Megaphone pattern is a helpful guide for investors in pinpointing the direction when the volatility abates.
The pattern's price breakout verifies the resumption of the trend, and dismissal signals a chance for reversal.
Because of that investors have to be precise in starting e a trade, so they can take advantage of the multiple opportunities for trading.
Megaphone patterns generate the best results for swing and day traders. But long term traders can implement it as an indicator to secure investments.
The megaphone stock pattern is a widening pattern that resembles a trading pattern or a symmetrical triangle.
Similar to other types of trading, it’s crucial to get educated and distinguish various patterns and their meaning.
The best way to achieve this is with training, and a demo account is a good option to learn drawing trend lines and making connections between dots to locate various patterns, the most important aspect in trading.
The standard recommendation applies, the megaphone chart pattern is only one of many patterns, and best results get achieved by combining patterns that verify the data provided.
FAQs
Is a Megaphone Pattern Bullish or Bearish?
The pattern is both bullish and bearish.
Is Megaphone Pattern Bullish?
The pattern is a good signal of the struggle between the bears and bulls for control over the market, and when the Megaphone bottom pattern gets created, it indicates the asset is going in a bullish direction.
What Is a Megaphone Pattern in Trading?
The pattern gets usually created in a highly volatile market, and investors are not sure about the future trend of the market.
How do You Trade a Megaphone?
When trading a Megaphone breakout pattern, trades are done in the course of the breakout from the pattern.