Technical analysis indicators are a good tool for brokers when preparing their trading strategy. Pivot points use a simple formula, that offers benefits to traders.
These points are accurate, but they don’t guarantee that the price will move in the direction that is predicted by the chart.

It is important to remember that the pivot points are predictions based on the previous day market activities. They are used to find the bounds of stock in different periods. This is done by using prior periods high and low to approximate subsequent resistance and support levels. The Pivot Point price is a relevant indicator for trading.
Contents
- Used by Retail Traders
- Why Use Pivot Points?
- What do Pivot Points Indicate?
- How to Calculate Pivot Points?
- Different Kinds of Pivot Points
- Support and Resistance Level
- Intraday Trading Strategies
- More Trading Opportunities
- Consistency and Pivot Points
- High Float Stocks and Pivot Points
- Conclusion
- FAQs
Used by Retails Traders
In the past Pivot Points were used by floor traders. They used the previous day’s high, low, and close prices to calculate a pivot point for the present trading day.
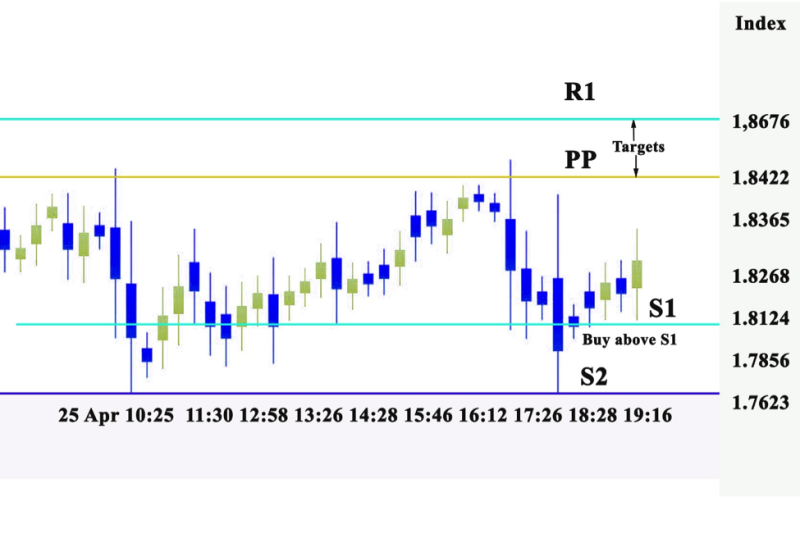
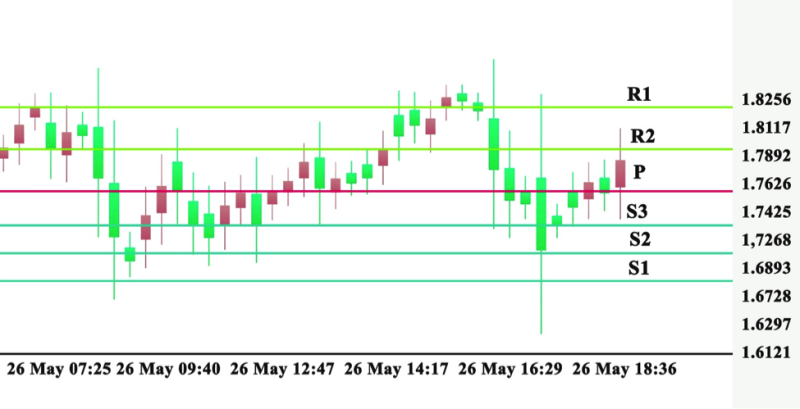
Today the Pivot Point is the base, used to determine set support 1, support 2, resistance 1, and resistance 2. The levels are used to help navigate activities during the trading day.
Pivot point analysis shows the balance between bearish and bullish trends. The market is bullish when prices go over the pivot point.
When prices fall below the pivot point, the market is bearish. In the modern era, Pivot Points are used by retail traders, mostly in Forex trading and equities.
Also Read: Mirror Trading: An Efficient Trading Strategy
Why Use Pivot Points
Pivot Points are a unique indicator for a day trading. The formula uses data from the previous trading day and puts it into the present trading day. The levels that are observed are relevant for the current trading day. It is an accurate tool. Professional and retail traders use it with confidence to determine the direction of the market.
The charts are a wealth of information about the market. As an indicator, it provides seven trading levels. A day trader can make good choices based on this data.
The data comes from a single day. Because of that, the indicator can be practical only for a short time frame. Timeframes for the pivot point indicator are 1-minute, 2-minute, 5-minute, and 15-minute. This is the main reason it is used by day traders.
It is an easy-to-use tool. Almost every trading platform has incorporated this indicator. You will not need to estimate separate levels. Platforms will do this, and your responsibility is to trade the bounces and the breakouts of the indicator.
Also Read: Best Forex Trading Platform 2021
What do Pivot Points Indicate?
Pivot points are different from other signals because they are fixed at the same prices during the day. Because they are stationary, they are helpful for traders to prepare their trades on the basis of these levels.
The S1, or R1, levels can be used as stop-loss levels or target prices. Traders use pivot points in combination with other trend indicators.
How to Calculate Pivot Points
When you don’t have the benefit of an automated system to do calculations for you, then you can do it the old fashion way. Remember that pivot points are used by day traders and are based on the prior trading days high, low, and close.
Let's take an example. It's Thursday morning, you use the data from Wednesday to generate the pivot point levels for Thursday. Before the new market day starts, locate the previous day’s high and low, and sum the values, and divide them by three.
The price you get, mark it as P on the chart. Since you have the price you can calculate R1, R2, S1, S2. The lows and high used in the calculation are taken from the day before.
Different Kinds of Pivot Points
The most popular pivot points are Classic, Fibonacci, Woodie, Central Pivot Range, and Camarilla.
Classic
Standard pivot points are basic pivot points that day traders can calculate. Traders begin with a base pivot point. The average of the high, low, and close from a previous period.
Fibonacci
The most preferred among investors is the Fibonacci pivot point. It is usually used in Forex trading but inequities. It is based on a mathematical sequence. A Fibonacci number is a simple formula, the sum of the previous two.
Camarilla
Camarilla pivot points is another method used by traders. There are four resistance and four support levels. It was invented 40 years ago and is still beneficial for traders. Woodie’s pivot points place more weight on the closing price. The calculation is very similar to the standard pivot’s formula.
Central Pivot Range
Central Pivot Range is a technical indicator comprising of three levels: central pivot point, top central level, and bottom central level.
The concept of the signal is that the trading expresses the attitude of the market. Because of this, the range is utilized to forecast price movement in the following days.
Support and Resistance Level
Observing the price action carefully is important when support and resistance levels come into play. If prices go down to support and then stay solid, traders should expect for an accomplished bounce-off support. Consulting a bullish chart pattern to confirm an upturn from support is a good tactic.
But if prices move to resistance and stand, traders can expect omission at resistance and diminish. Analysts need to identify a bearish pattern signal to verify a change in direction from resistance.
The second resistance and support levels are utilized to recognize oversold and overbought situations. Move over the second resistance level displays strength, but it also specifies an overbought situation that could create a pullback.
While a move below the second support displays weakness, but it proposes a short-term oversold condition. This can give way to a bounce.
Intraday Trading Strategies
There isn’t one pivot point that is completely the best option for trading. What brokers have, are options that can be more useful for one type of trader than another.
A big role is played by personal preferences. The most popular calculation methods have different support and resistance levels.
If you prefer only one or two trades per session. Then Classic, Woodie, and Fibonacci pivot points are more useful for your trading style.
The minus of these methods is that they don’t produce as many pivot lines as other formulas.
Also Read: 10 Traits on How to be a Successful Trader
More Trading Opportunities
These methods may be used as the foundation for creating a trading strategy utilizing pivot points. The Fibonacci pivot point R1 can be in one spot, and the R1 of the Classic Pivot Point might have a different position.
The contrast between these two R1s could be a circumstance of pips. You could have a pivot line touching the top of a candlestick with one method of calculation. But when using another method, you can have a gap between the line and the top of the candlestick.
If you focus on making several daily trades, you can use Camarilla and CPR pivot points. Calculations produced by this method open more pivot lines. This means you will have more trading opportunities.
The downside to this type of trading is that you have prepared to make a smaller amount of pips at a time. The Camarilla method may have its R1 and R2 at 10 to 15 pips apart.
You need to decide how near you want the resistance and support level to be to your candlesticks. There are other common trading strategies you could use.
How to Enter a Trade
The first step is to calculate the pivot points for that day. Observe the market and wait for the price to move in on a pivot point. In a long trade, lows will touch the price bars as they move closer to the pivot point.
If it is a short trade, the price bars should touch new highs as they move in the direction of the pivot point. You should hold on until the price meets the pivot point.
At this point, you are entering the trade. You start the trade by locating the high of the first price bar that could not touch a new low.
Make Profits
The best level to make profits for a day trader, no matter which strategies you are using, is at the next pivot point. If you enter a sell trade at S1, you will earn your money at S2.
The same thing happens if you start a buy trade at R1, the profit comes at R2.
This method will help you guard the pips you have made. Still, it is not ideal for earning all the pips you can from a price movement. The price sometimes keeps breaking pivot points to attain new heights or lows. For example, it might break R2.
This would have been a great profit level if you had bought at R1. And continued towards R3. The same logic applies if the price has not stopped at S2 if you sold at S1. But continue towards S3.
Plan Your Exit Points
Pivot points help in fast identification on when you are in a losing trade. If you are partaking in a long trade after a break in a resistance level.
And the stock abruptly turns and goes below that level. Then you will have a problem. A useful indicator to use is time-lapse.
If you are nearing the breakout level, and have shortly entered the position. That you can interpret this as a warning. When a trade you are in is cannot hold a level, you should exit.
Most of the trading platforms used by brokers display pivot points of that or previous days. Current levels are important, just as levels from previous days can develop resistance on the chart. You should take care while identifying your stop-loss points.
Consistency and Pivot Points
Traders always worry about when they should exit a trade. Often investors leave too soon and regret the decision. But on the other side, they may stay longer and face losses, that could have been prevented. The most important skill is to know when to exit a trade.
Pivot points are helpful in making these decisions. They offer clarity and high accuracy regarding key steps in intraday trading. The stock market is a fast-moving environment.
Using yesterday's high price to determine a price level in a trading session is a good strategy. It helps investors figuring out the points where they should enter and exit the trade.
High Float Stocks and Pivot Points
Many experts advocate low float stocks that can return large profits. If you are experienced and used volatility you can trade those stocks.
High float stocks are still popular when it comes to Pivot Points. The great thing about higher float stocks is the predictability in trading these securities around pivot point levels.
Beginners starting with pivot points can start with these large-cap stocks. After they get experience, the next level will be penny stocks.
Conclusion
Chartists can use technical analysis indicator like Pivot Points, when looking into financial markets to determine price direction and then set traditional support and resistance levels. The price direction is recognized by checking the present period's price action comparative to the pivot point.
Beginning over or below the pivot point. Or intersecting in an additional direction during trading.
The set résistance and support points are used after price direction has been set on. The concepts can be used across different timeframes. It is imperative to confirm Pivot Point signals with other methods of technical analysis.
While at second support an RSI can verify oversold conditions. The MACD upturn can authenticate a good support test.
For example, a bearish candlestick reversal pattern could confirm a reversal at second resistance. In some cases, the following levels do not appear on the chart. The reason is that these levels eclipse the price.
Pivot Points are one of the leading indicators that represent key levels. It is used to spot when price action breaks in the opposite direction. Calculating Pivot Points for many traders is one of the better technical indicators. Especially when they use it to take advantage of pivot point breakout after it goes over the upper resistance level.
FAQs
How do pivot points work?
The pivot point is the median of the high, low, and closing prices from the preceding trading day. Trading over the pivot point on the following day is believed to signal bullish sentiment. If trading is below the pivot point it makes for a bearish attitude.
What are the best pivot points?
There are five most common pivot point calculation methods. They are the Classic, Fibonacci, Woodie, Central Pivot Range, and Camarilla.
What is a pivot point in the body?
In the anatomy of the human body, a pivot point is a rotary joint or a freely moveable joint that enables rotary movement around a single axis. The bone rotates in a ring created by a second bone and ligaments.
What is R1 R2 R3 and S1 S2 S3?
The three levels of resistance are R1, R2, and R3. While S1, S2, and S3 refer to the three levels of support. The support and resistance levels are used as trade exits. If the market price breaks above the pivot point, R1 and R2 can be used as trade targets.