
Have you ever watched the market stay still, only to explode with movement moments later using the squeeze momentum indicator? This powerful momentum indicator helps traders recognize when low volatility forms within a tight trading range before potential breakouts occur. When Bollinger Bands contract inside the Keltner Channels , it signals that market pressure is building, waiting for release. The squeeze momentum indicator strategy reveals when that squeeze fires, showing traders the precise moment momentum shifts from quiet buildup to strong movement.
This indicator acts as a reliable guide that reads momentum strength and direction through its squeeze momentum histogram display. It shows positive momentum with rising green bars and warns of negative momentum when red bars take over. Traders use these visual cues to spot price movements, anticipate potential breakouts, and manage risk effectively through disciplined trading decisions. By understanding how squeeze signals form and how momentum components interact, traders can master market timing with confidence and simplicity.
What Is the Squeeze Momentum Indicator?
The squeeze momentum indicator is a momentum indicator that helps traders identify when a market is about to make a strong move. It combines Bollinger Bands and Keltner Channels to measure periods of low volatility and market compression. When the Bollinger Bands contract inside the Keltner Channels, it signals that the market is entering a squeeze phase. This setup helps traders prepare for upcoming momentum shifts when the squeeze fires and price begins moving with direction and strength.
The squeeze momentum indicator is calculated using price movements around the 20-day moving average of Bollinger Bands and Keltner Channels. It produces histogram bars that represent the tightness of the bands, where higher values mean tighter ranges. When the dots change from red to green, the squeeze is over, and traders look for bullish momentum confirmation. This visual representation provides clear entry and exit points, helping traders apply the squeeze momentum indicator strategy confidently across multiple timeframes and trading styles.

How the Squeeze Momentum Indicator Strategy Works
Step 1: Start by adding the squeeze momentum indicator to your trading platform with its default settings. Watch the Bollinger Bands closely. When they move inside the Keltner Channels, it signals low volatility and a market squeeze forming. This stage shows that the market is building pressure before a possible breakout.
Step 2: Observe the black dots that appear along the zero line. These dots confirm that the squeeze is active and momentum is quiet. Traders wait for these dots to disappear, as this means the squeeze fires and momentum begins shifting. Patience here helps avoid false signals and unconfirmed entries.
Step 3: Once the squeeze fires, focus on the squeeze momentum histogram for visual confirmation. Rising green bars often signal increasing momentum and possible buy opportunities. When dark red bars appear, it means momentum is turning weak or bearish. This simple visual makes reading market direction easier.
Step 4: Compare the current bar with the previous bar to gauge the strength of price movements. If the new bar is higher and turns green, it indicates growing bullish momentum. Lower or darker bars suggest fading strength. This helps traders make clear and confident trading decisions.
Step 5: Combine the squeeze momentum indicator with tools like moving average convergence divergence or relative strength index for confirmation. Using multiple indicators strengthens entry and exit points. This disciplined approach helps traders manage risk better and align trades with overall market momentum.
Using the Squeeze Momentum in Trading
The squeeze momentum is one of the most practical tools traders can use to spot real market pressure. When the squeeze indicator forms, traders focus on the zero line to see if momentum begins shifting upward or downward. The momentum histogram then provides a clear view of momentum strength and direction, helping identify when a breakout may soon develop. This process makes trading more objective, removing the guesswork and allowing decisions based on visible market behavior.
On most trading platforms, the squeeze momentum comes from the TTM Squeeze Indicator, which measures volatility and momentum together. It can be combined with other indicators and analysis tools for confirmation and clearer insights. The goal is to understand how momentum builds before price expands beyond consolidation. When used properly, the squeeze momentum teaches timing, patience, and confidence, core skills that guide traders through changing market conditions.
What Does TTM Do?
The TTM Squeeze helps traders understand when the market is building energy before a major move begins. It combines volatility and momentum, allowing traders to spot when price pressure is ready to release. This makes the indicator a favorite among both new and experienced traders who want clearer, more confident trading decisions. Many use it to transform small, careful trades into steady long-term growth.
The TTM Squeeze is often applied to reduce risk, improve timing, and identify stronger entry and exit points. It works by forecasting potential breakouts and showing where momentum is likely to expand. Research shows it performs effectively about seventy percent of the time, but traders must still manage the other thirty percent wisely. In a fast-changing market, discipline and proper use of the TTM Squeeze can make the difference between consistent profits and costly losses.
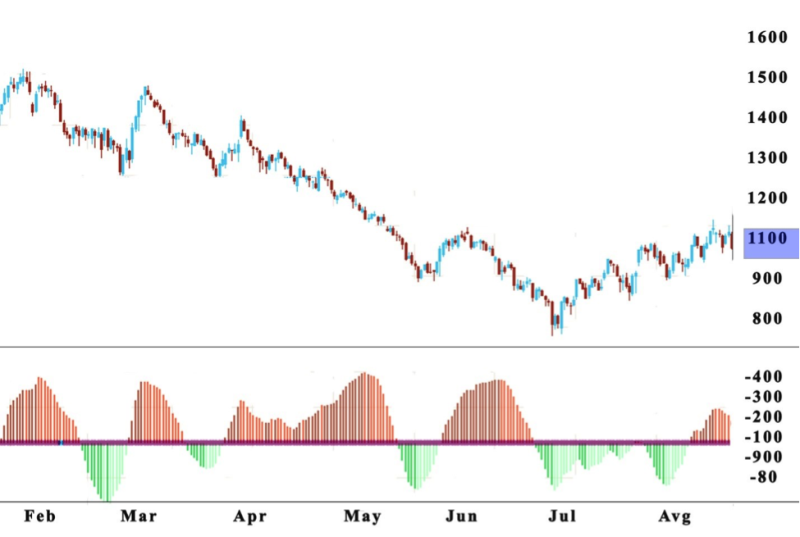
Visualizing the Squeeze Indicator
The squeeze momentum can be visualized easily through its colorful histogram, which makes understanding market pressure much simpler. Each bar represents momentum strength and direction, helping traders see when energy starts building before a potential breakout. When bars turn green, it suggests growing strength, while red tones signal decreasing momentum or a possible pullback. This visual feedback teaches traders to read momentum flow naturally, giving a clearer picture of how price may react next.
Reading Bollinger Bands and Keltner Channels
The squeeze momentum combines the Bollinger Bands and Keltner Channels to identify quiet periods before a breakout begins. The Bollinger Bands measure how far price moves from its average, helping traders see when volatility is changing. When the bands shrink, it means low activity and calm market behavior. When they expand again, it shows volatility is increasing, often signaling that a new trend may start soon.
The Keltner Channels, on the other hand, measure the Average True Range to understand how wide the price movement becomes. When the Bollinger Bands move inside the Keltner Channels, the squeeze momentum detects tightening pressure in the market. This situation means energy is being stored, waiting for release. When the Bollinger Bands finally move away from the Keltner Channels, the squeeze ends, signaling a rise in volatility and possible start of a strong directional move.
Trading Divergences with Squeeze Momentum
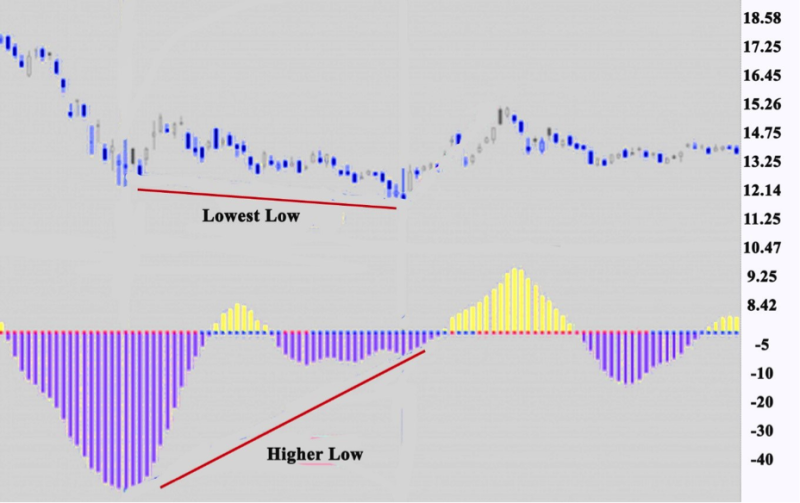
A divergence happens when momentum moves differently from price, showing a possible change in direction before it fully forms. In the squeeze momentum, this is seen when the histogram begins to tilt away from the price’s current path. When momentum weakens while price continues rising, it signals a bearish divergence and warns traders to prepare for possible reversals.
A bullish divergence forms when the price moves lower, but the histogram creates a higher low above the zero line. This pattern often means that selling pressure is slowing, and buyers may soon take control. Recognizing these signals early helps traders position themselves before the market shifts direction.
There are two common ways to trade divergences using squeeze momentum. Some traders compare the angle between price movement and momentum strength, while others focus on the slope of histogram bars. Both methods can reveal hidden changes in energy, helping traders make safer, more informed decisions with proper risk management.
Risk Management with the Squeeze Indicator
- Start by identifying the squeeze setup early and defining risk before entering any trade. Determine how much capital can safely be used. Always trade with a plan that protects the account from unexpected price movement.
- Wait for the squeeze to fire before entering, ensuring the momentum histogram confirms direction. Entering too early can expose traders to false signals. Patience reduces emotional decisions and helps protect against unnecessary losses.
- Place stop-loss levels slightly outside the consolidation or squeeze range. This ensures minor price noise does not trigger early exits. Adjust stops only when momentum clearly shifts or volatility expands.
- Manage position size according to market conditions and volatility strength. When volatility is high, use smaller positions to control exposure. When the market is calm, maintain consistency but never overextend capital.
- Review each trade after completion to evaluate performance and accuracy. Study how momentum behaved and where improvements can be made. Consistent reflection strengthens discipline and refines future squeeze indicator trading decisions.
Understanding Momentum Value
The squeeze does not happen often, but when it does, it reveals strong energy building within the market. Traders use the squeeze indicator to measure this pressure and identify when price movement is about to shift direction. Understanding the momentum value helps estimate how powerful the next breakout might be and when it could occur. Many traders apply this indicator on larger timeframes, where trends are easier to confirm, and false signals appear less often.
However, no indicator guarantees perfect accuracy, and the squeeze momentum is no different. Each signal carries a margin of error that traders must respect. It is wise to confirm data with other tools before taking action, especially when signals seem too good to be true. The best approach is to balance momentum value analysis with a clear trading plan, allowing traders to catch strong entries and manage risk with confidence.
Also Read: How to Use the TTM Squeeze Indicator
Conclusion
Traders are known to have said that from all my indicators the squeeze is one of the most consistent. The indicator can be a solid trading options trading, and looking at the histogram bars is not sufficient for the correct squeeze setup, traders need to verify with other technical tools so they can receive a credible squeeze.
Traders can find a book mastering the trade and learn how to interpret green and red arrows and other signals. It's crucial to implement a reliable squeeze strategy to get the accurate price trend in all financial markets.
FAQs
What Is a Squeeze Momentum Indicator?
Squeeze Momentum reveals periods when volatility rises or declines, basically showing when the market moves from a trend in flat movement and the opposite.
Does the Squeeze Momentum Indicator Work?
Yes, the squeeze momentum is effective in locating moments in time when you can expect a great move in the market. It's also practical for combining with other trading tools.
How do You Trade with Squeeze Momentum Indicator?
When trading the indicator marks the breakout, which can coincide with a bullish trend. The breakout shows squeeze momentum when the dots on the histogram get replaced by other colored dots. The price course gets verified additionally with the ADX, and the indicator produces a breakout signal.


