Triangle Pattern Forex
Triangle pattern forex are one of the many renowned and heavily used charting techniques in forex. When mastered it can be simple to utilise and apply yet giving elegant results. The triangle patterns stem from the technique of identifying and drawing trend lines. From just trendlines, people have realised that prices tend to consolidate and squeeze tighter, giving it a shape that resembles a triangle. Of course, to that, there are also different triangles and their respective characteristics and behaviours. Since the triangle patterns are seen as a consolidation pattern in price action, prices tend to have a one directional movement after being squeezed in the triangle, hence giving rise to what we call a “break out”. As such, majority of traders out there love to trade breakouts as prices move smoothly giving them a profitable rewards to risk ratio. In this article, we will dive right into the specific types of triangle patterns most commonly encountered in trading and derive the best strategy on how to utilise it efficiently.
Triangle Pattern Forex Indepth Video
Triangle Pattern Forex
- Types of triangles
- Strategies
- Symmetrical triangle trading strategy
- Descending triangle trading strategy
- Ascending triangle trading strategy
- Pros and cons
- Analysis
- Conclusion
- Rating
- Infographic
Types of triangles
In order to fully understand and utilise triangle patterns in your trading, we must first understand the different types of triangles that the prices tend to form. There are three types of triangle patterns that a trader must know at the back of his palm. They are: the symmetrical triangle, the descending triangle and the ascending triangle.
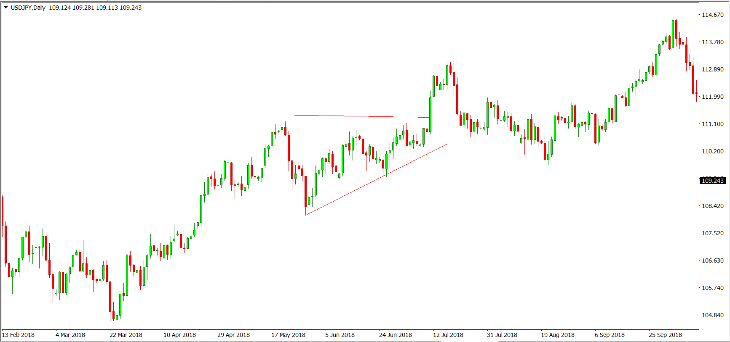
An example of a symmetrical triangle:
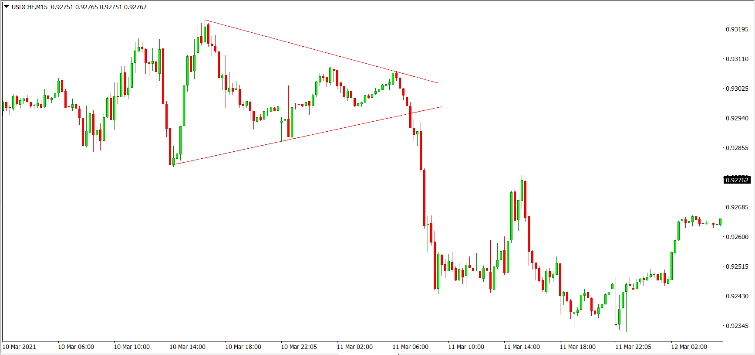
A symmetrical triangle is formed when the price action forms a series of lower highs and higher lows. This shows that the prices are no longer trending in the direction and is in a consolidation range. However, a symmetrical triangle is neutral. Just because it is no longer trending, does not mean that prices are about to reverse. Instead, the symmetrical triangle can go about both ways, a reversal, or a trend continuation. Therefore, when capitalising on the break out of symmetrical triangle formation, it is dangerous to go for an omni directional approach. The best choice of action in this scenario would be to prepare for a break out in either directions, which we would then explore in the later part of the article. Before that, let us take a look at the other triangle patterns.
An example of a descending triangle:
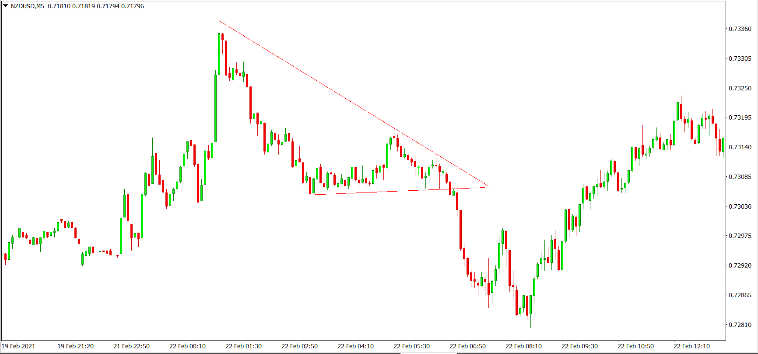
A descending triangle is formed when the price action forms lower highs and a negligible change in the altitude of the corresponding lows. This shows that the prices are no longer trending in the current direction and is in a consolidation range. More often than not, the descending triangle formation represents a bearish market sentiment. However, that is only in theory and in reality there can be exceptions where prices head towards a bullish break out. Thus, it is very important to take caution when capitalising on the break out play of the descending triangle as well. We will take a look at the recommended strategies for a descending triangle formation break out play later on in the article as well. Last but not least, let us take a look at the final triangle pattern that will be crucial in your understanding of price action in any of the markets.
An example of the ascending triangle:
An ascending triangle is formed when the price action forms a negligible change in the altitude of highs and a series of higher lows. This shows that the prices are no longer trending in the current direction and is in a consolidating range. More often than not, the ascending triangle formation represents a bullish market sentiment. However, this is only absolutely true in theory and in reality, again, there can be exceptions where prices head towards a bearish break out. Hence, it is also absolutely crucial to take caution when capitalising on a ascending triangle formation break out play.
As you may have figured, in reality, all of the triangle patterns have a chance of going into either market directions. Hence, it is highly not recommended to take an omni directional approach regardless of the triangle pattern formed. Another crucial element to perfecting break out plays like this would be your stop loss. As break out patterns tend to vigorously move in either market directions, it is always better to place a stop loss to protect your account just to be safe.
Now, let us dive in to how we can apply the knowledge of these triangle patterns in our trading.
Strategies
The strategies to trade the triangle formation break outs are very similar across the board. Theoretically, the span of the height of the triangle in terms of pips will be reflected as the profit target. In reality however, even though this is not a hundred percent accurate, we can still see an approximate one is to one ratio between the span of the height of the triangle and the profit target we will be expecting.
Further read: Forex Trading Strategies Guide
Symmetrical triangle trading strategy
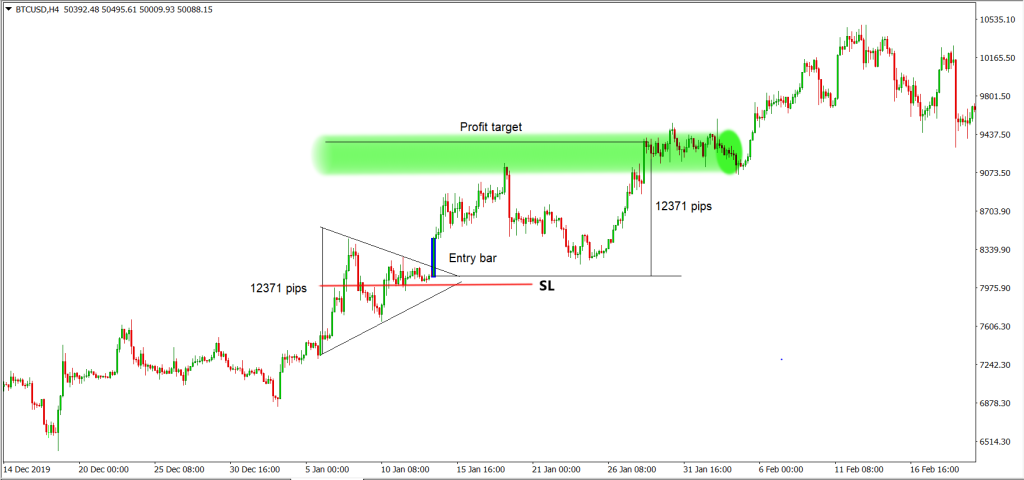
For the symmetrical triangle formation, the ideal entry would be at the point where the first candle closes above and breaks either of our trendline. In this case this is depicted by the candle highlighted in blue as shown in the figure above. The targeted profit will be approximately one is to one ratio with the height span of the triangle, with the entry candle included. Hence, we can aim for an exit at the reward level that is in this case depicted by the “profit target” and highlighted in green in the figure above. As for the stop loss, theoretically, it would be placed slightly below half of the triangle, as depicted by a red line labelled “SL” in the figure above. Next, we shall take a look at the descending triangle strategy.
Descending triangle trading strategy
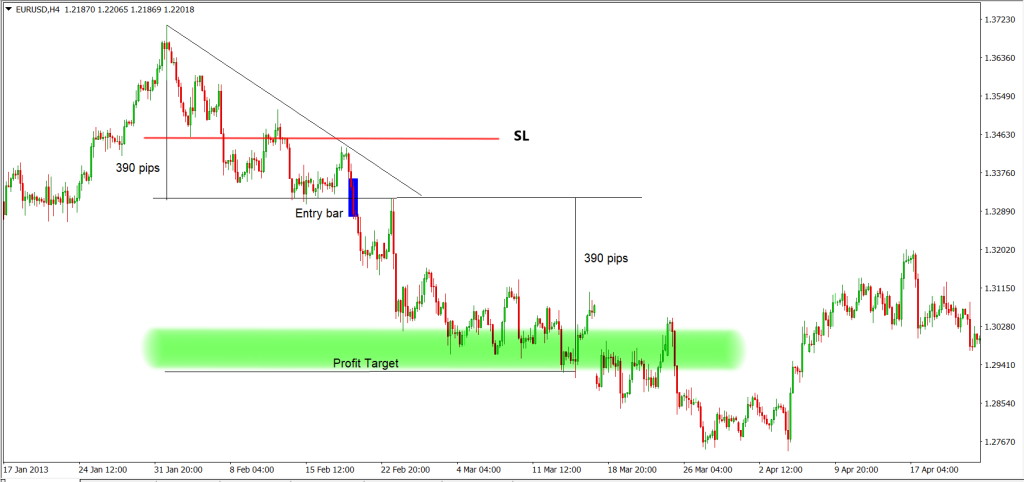
For the descending triangle formation, the ideal entry to catch the break out would be to place an entry right after the candle closes below the horizontal support of the triangle, resulting in a break out of the triangle. This can be seen as the highlighted candle in the figure above. Similarly, the take profit level will be in an approximately one is to one ratio with the height span of the descending triangle. Thus, we can expect and place our reward level at the “profit target” level highlighted in green as shown in the figure above. As for the stop loss, in theory it would be placed at half of the descending triangle. This is reflected by a red line labelled “SL” in the figure above. Finally let us cover the strategy for the ascending triangle.
Ascending triangle trading strategy
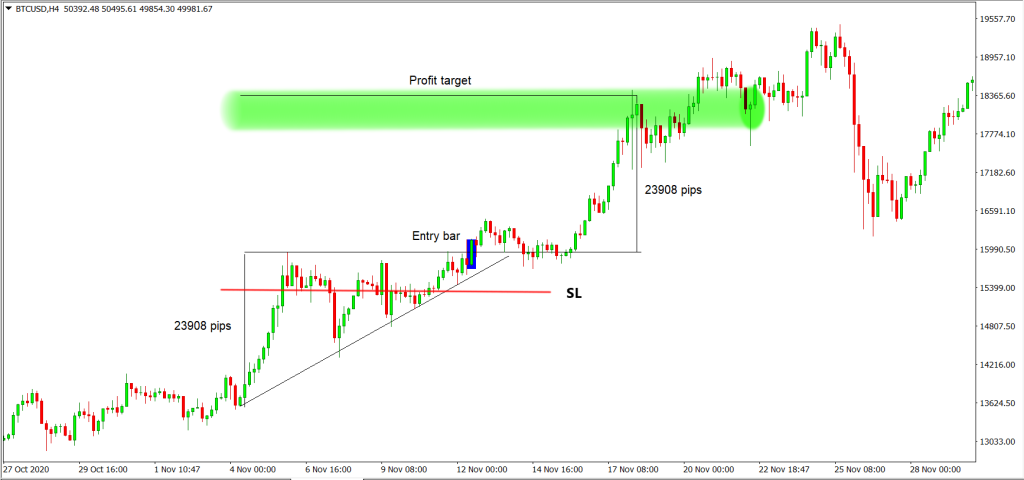
For the ascending triangle formation, the ideal entry to catch the break out would be to place an entry right after the candle closes above the horizontal resistance of the triangle, resulting in a break out of the triangle. This can be seen as the highlighted candle in the figure above. Similarly, the take profit level will be in an approximately one is to one ratio with the height span of the ascending triangle. Therefore, we can expect and place our reward level at the “profit target” level highlighted in green as shown in the figure above. As for the stop loss, in theory, again, it would be placed at half of the ascending triangle, reflected by a red line labelled “SL” in the figure above. In the next segment of the article, we will uncover the broken down analysis of the triangle patterns as a whole.
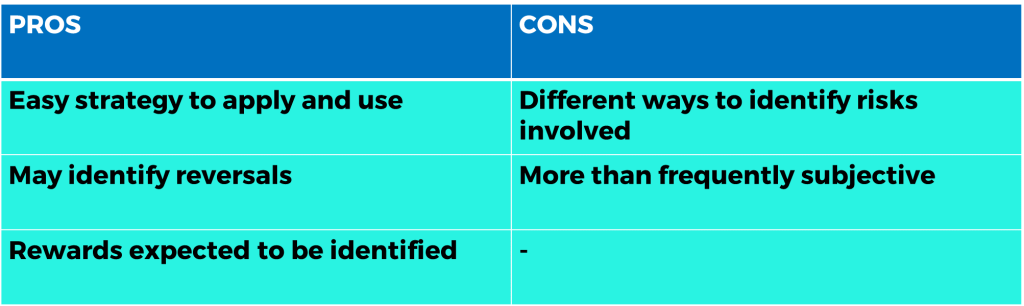
Triangle Pattern Pros and cons
In this segment of the article we will be exploring the reasoning that determines if the triangle patterns should or should not be used as one of your trading strategy. Firstly, the triangle patterns are a basic strategy that is easy to understand and highly applicable to traders of every level. Secondly, certain triangle patterns have a higher probability of dictating the market direction. For example, in most cases, the descending triangle shows a bearish sentiment in the market, whereas the ascending triangle shows a bullish sentiment in the market. Lastly, the best thing about this strategy is that the take profit level will be very easy to be determined. This gives you a better idea of the risk to reward ratio that you will be taking. However, though the expected reward level is fixed, the risk taking level is rather subjective and to be determined by experience still as the theoretical risk taking level of half the triangle is just a simple gauge. Also, the triangles may be subjective to spot in live trading for some, making the frequency of these patterns, and the type of triangle pattern being identified, an undetermined factor for many traders.
Triangle Pattern Forex Analysis
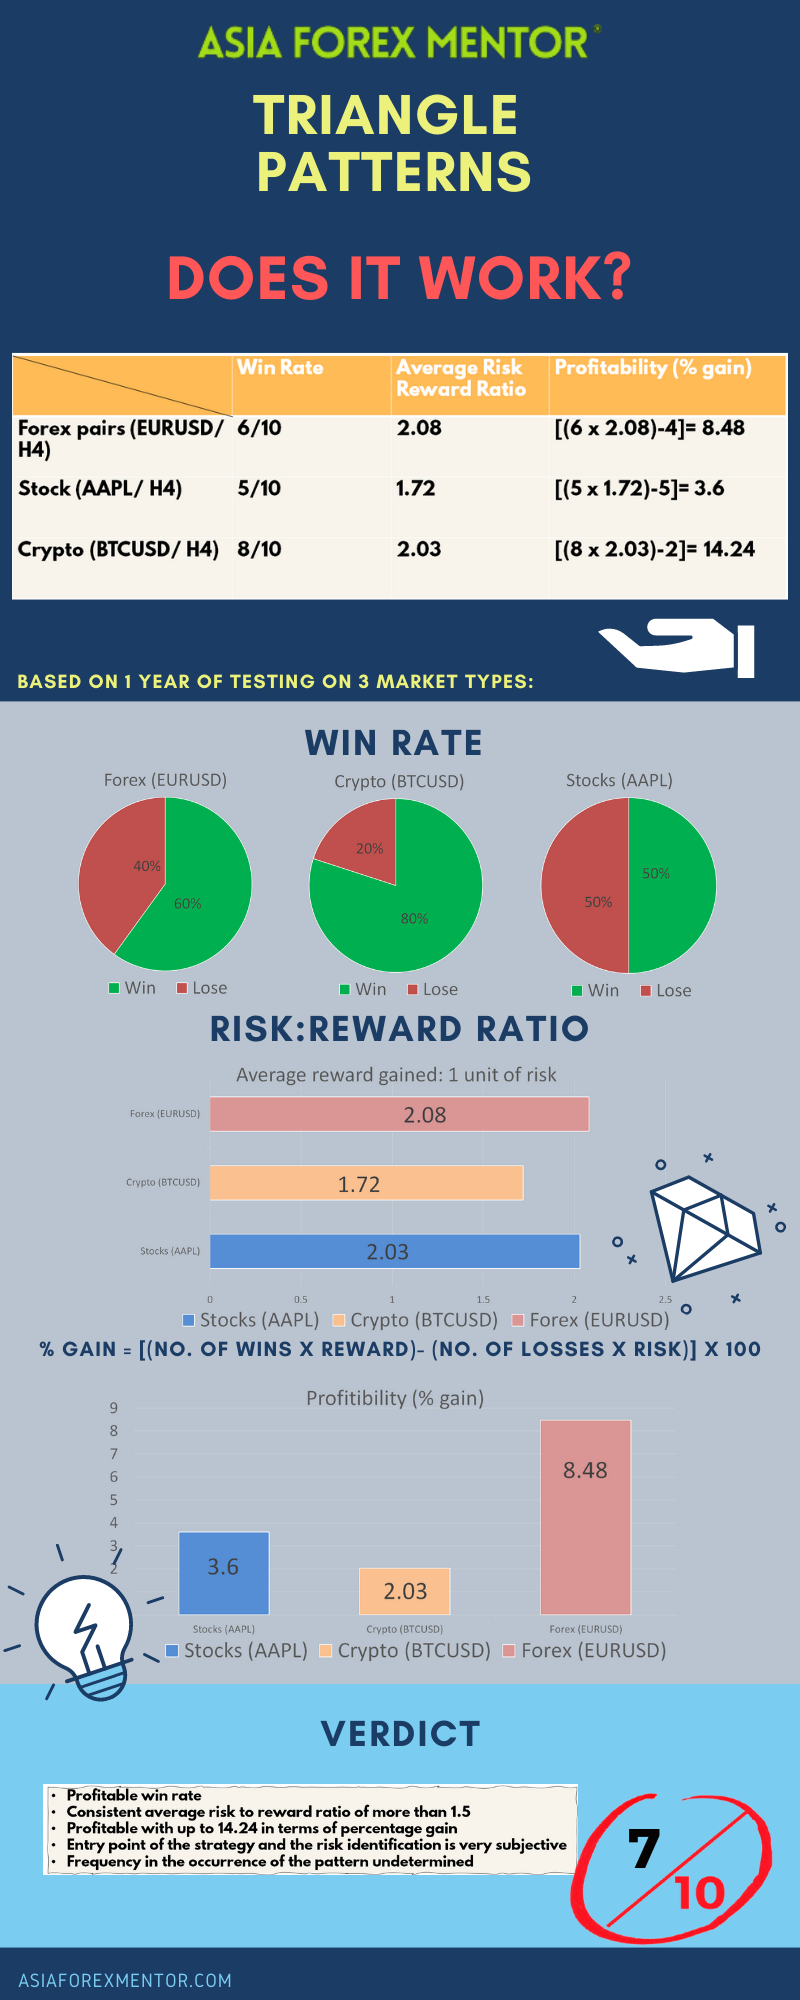
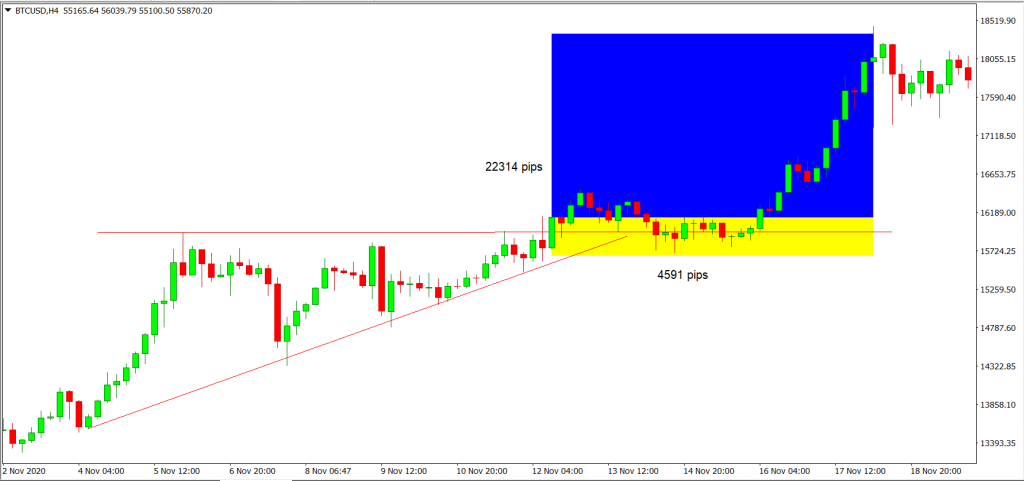
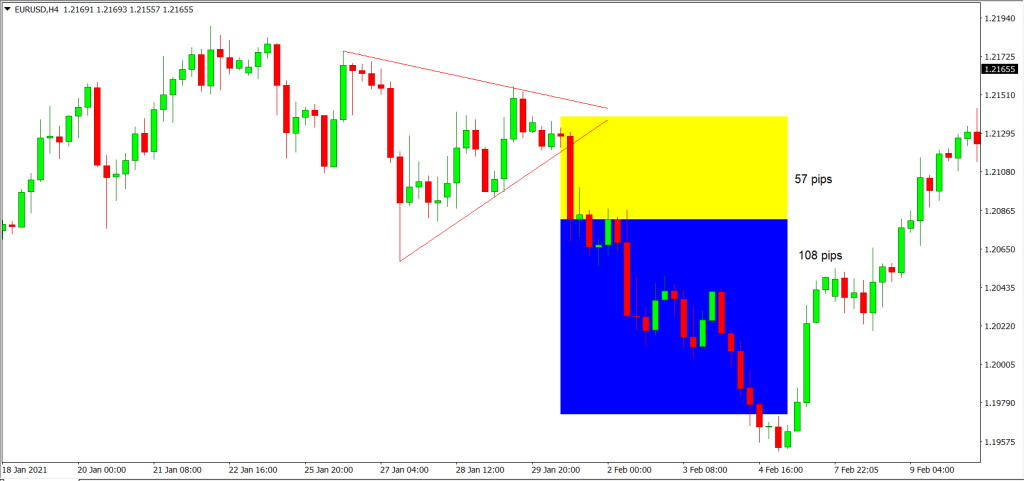
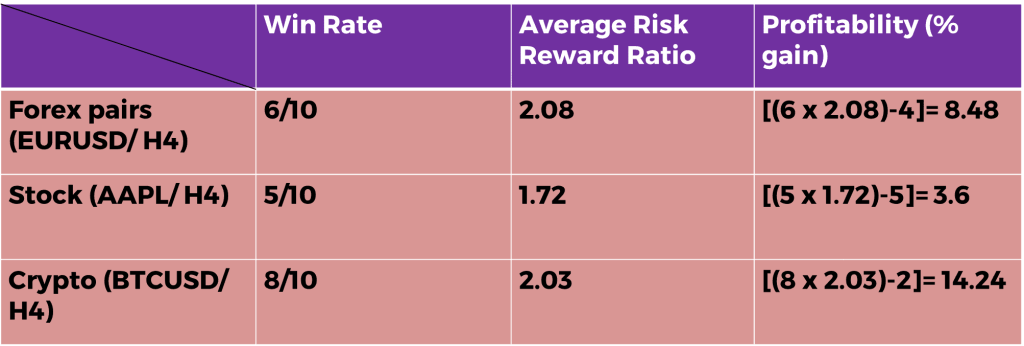
Based on the set of rules and strategies mentioned in the earlier part of this article, our team did a back test to determine the profitability of utilising the triangle formations in multiple vehicles of trading. In this backtest, we will be drawing the statistics for the win rate, the average reward to risk ratio to be taken and the profitability of the triangle formations trading strategies. Assuming that the risk taken for each trade is fixed at 1% of the account, the profitability can then be determined by the following equation calculated in terms of percentage gain: % gain = (no. of wins x reward)-(no. of losses x risk taken), whereby the risk taken = 1. For the forex trading vehicle, we will use the pairing EURUSD as a sample. For the stocks trading vehicle we will use AAPL as a sample. For the cryptocurrency trading vehicle, we will be using BTCUSD as a sample. The backtest will all be conducted across 10 trades at the H4 timeframe. Below are some of the snippets of how we conducted the backtest of each trade.
BTCUSD
EURUSD
AAPL
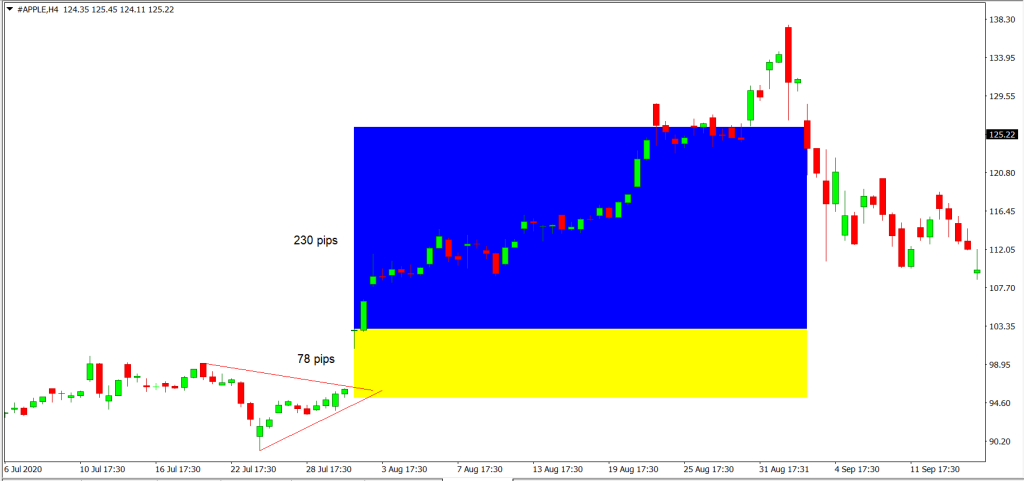
Based on the conducted backtest, the win rate of the triangle formations trading strategies for forex, EURUSD, is 60%; for stocks, AAPL, is 50% and for cryptocurrency, BTCUSD, is 80%.
The average rewards to risk ratio of the triangle formations trading strategies for forex, EURUSD, is 2.08; for stocks, AAPL, is 1.72 and for cryptocurrency, BTCUSD, is 2.03.
Finally, the profitability in terms of percentage gain of the triangle formations trading strategies for forex, EURUSD, is 8.48%; for stocks, AAPL, is 3.6% and for cryptocurrency, BTCUSD, is 14.24%.
Below is an illustration of the results in a table.
Conclusion
To sum up, the triangle patterns is a good strategy for all types of traders with a very decent win rate that is profitable. It also gives a good average rewards to risk ratio of more than 1.5. In addition, the profitability in terms of percentage gain for 10 trades ranges for 3.6% to 14.24%, which is phenomenal for a trading strategy. The strategies for the triangle trading patterns as a whole is no doubt repetitive and identical as it bases itself on the theory of support and resistance. That being said, as the strategies are a form of break out play, the placement of stop loss is extremely important. However, the placement of stop losses come from personal trading experiences to further enhance the rewards to risk ratio and thus the profitability of the strategies. Aside from the theoretical knowledge of the placement of stop losses , there will be cases that allows you to minimise your stop loss as well as cases that requires a larger stop loss out of the theoretical approach, to make enhance the strategies. However, one observation you can take away from these strategies is that pending orders before the closing of a candle for the break out is an extremely dangerous approach as it allows your account to be vulnerable to false break outs, whereby the prices spike and trigger your pending entry, but closes back into the triangle or even goes the opposite direction to stop you out. That being said, an omni directional approach to trading any triangle patterns is not advised as even if some triangle pattern forex tend toward a certain market sentiment, there might still be a probability of it heading to the opposite direction. Therefore, when caught off guard without a trade plan, traders may tend to panic enter or risk forgoing a good opportunity.
Further read: 28 Forex Patterns
Rating
7/10
Infographic