In the dynamic world of financial trading, the Three-River Bottom pattern stands out as a notable bullish reversal indicator. Recognizing and effectively trading this pattern can provide traders with valuable opportunities. This article delves into understanding, spotting, and trading the Three-River Bottom pattern, leveraging other indicators for confirmation, and assessing its pros and cons.
Understanding the formation of the Three-River Bottom pattern is crucial for traders looking to capitalize on bullish reversals in downtrending markets. By identifying it accurately and using additional indicators for confirmation, traders can enhance their trading strategies. Despite its benefits, it's essential to acknowledge the pattern's limitations and combine it with sound risk management practices to ensure successful trading outcomes.
What is the Unique Three-River Bottom Pattern?
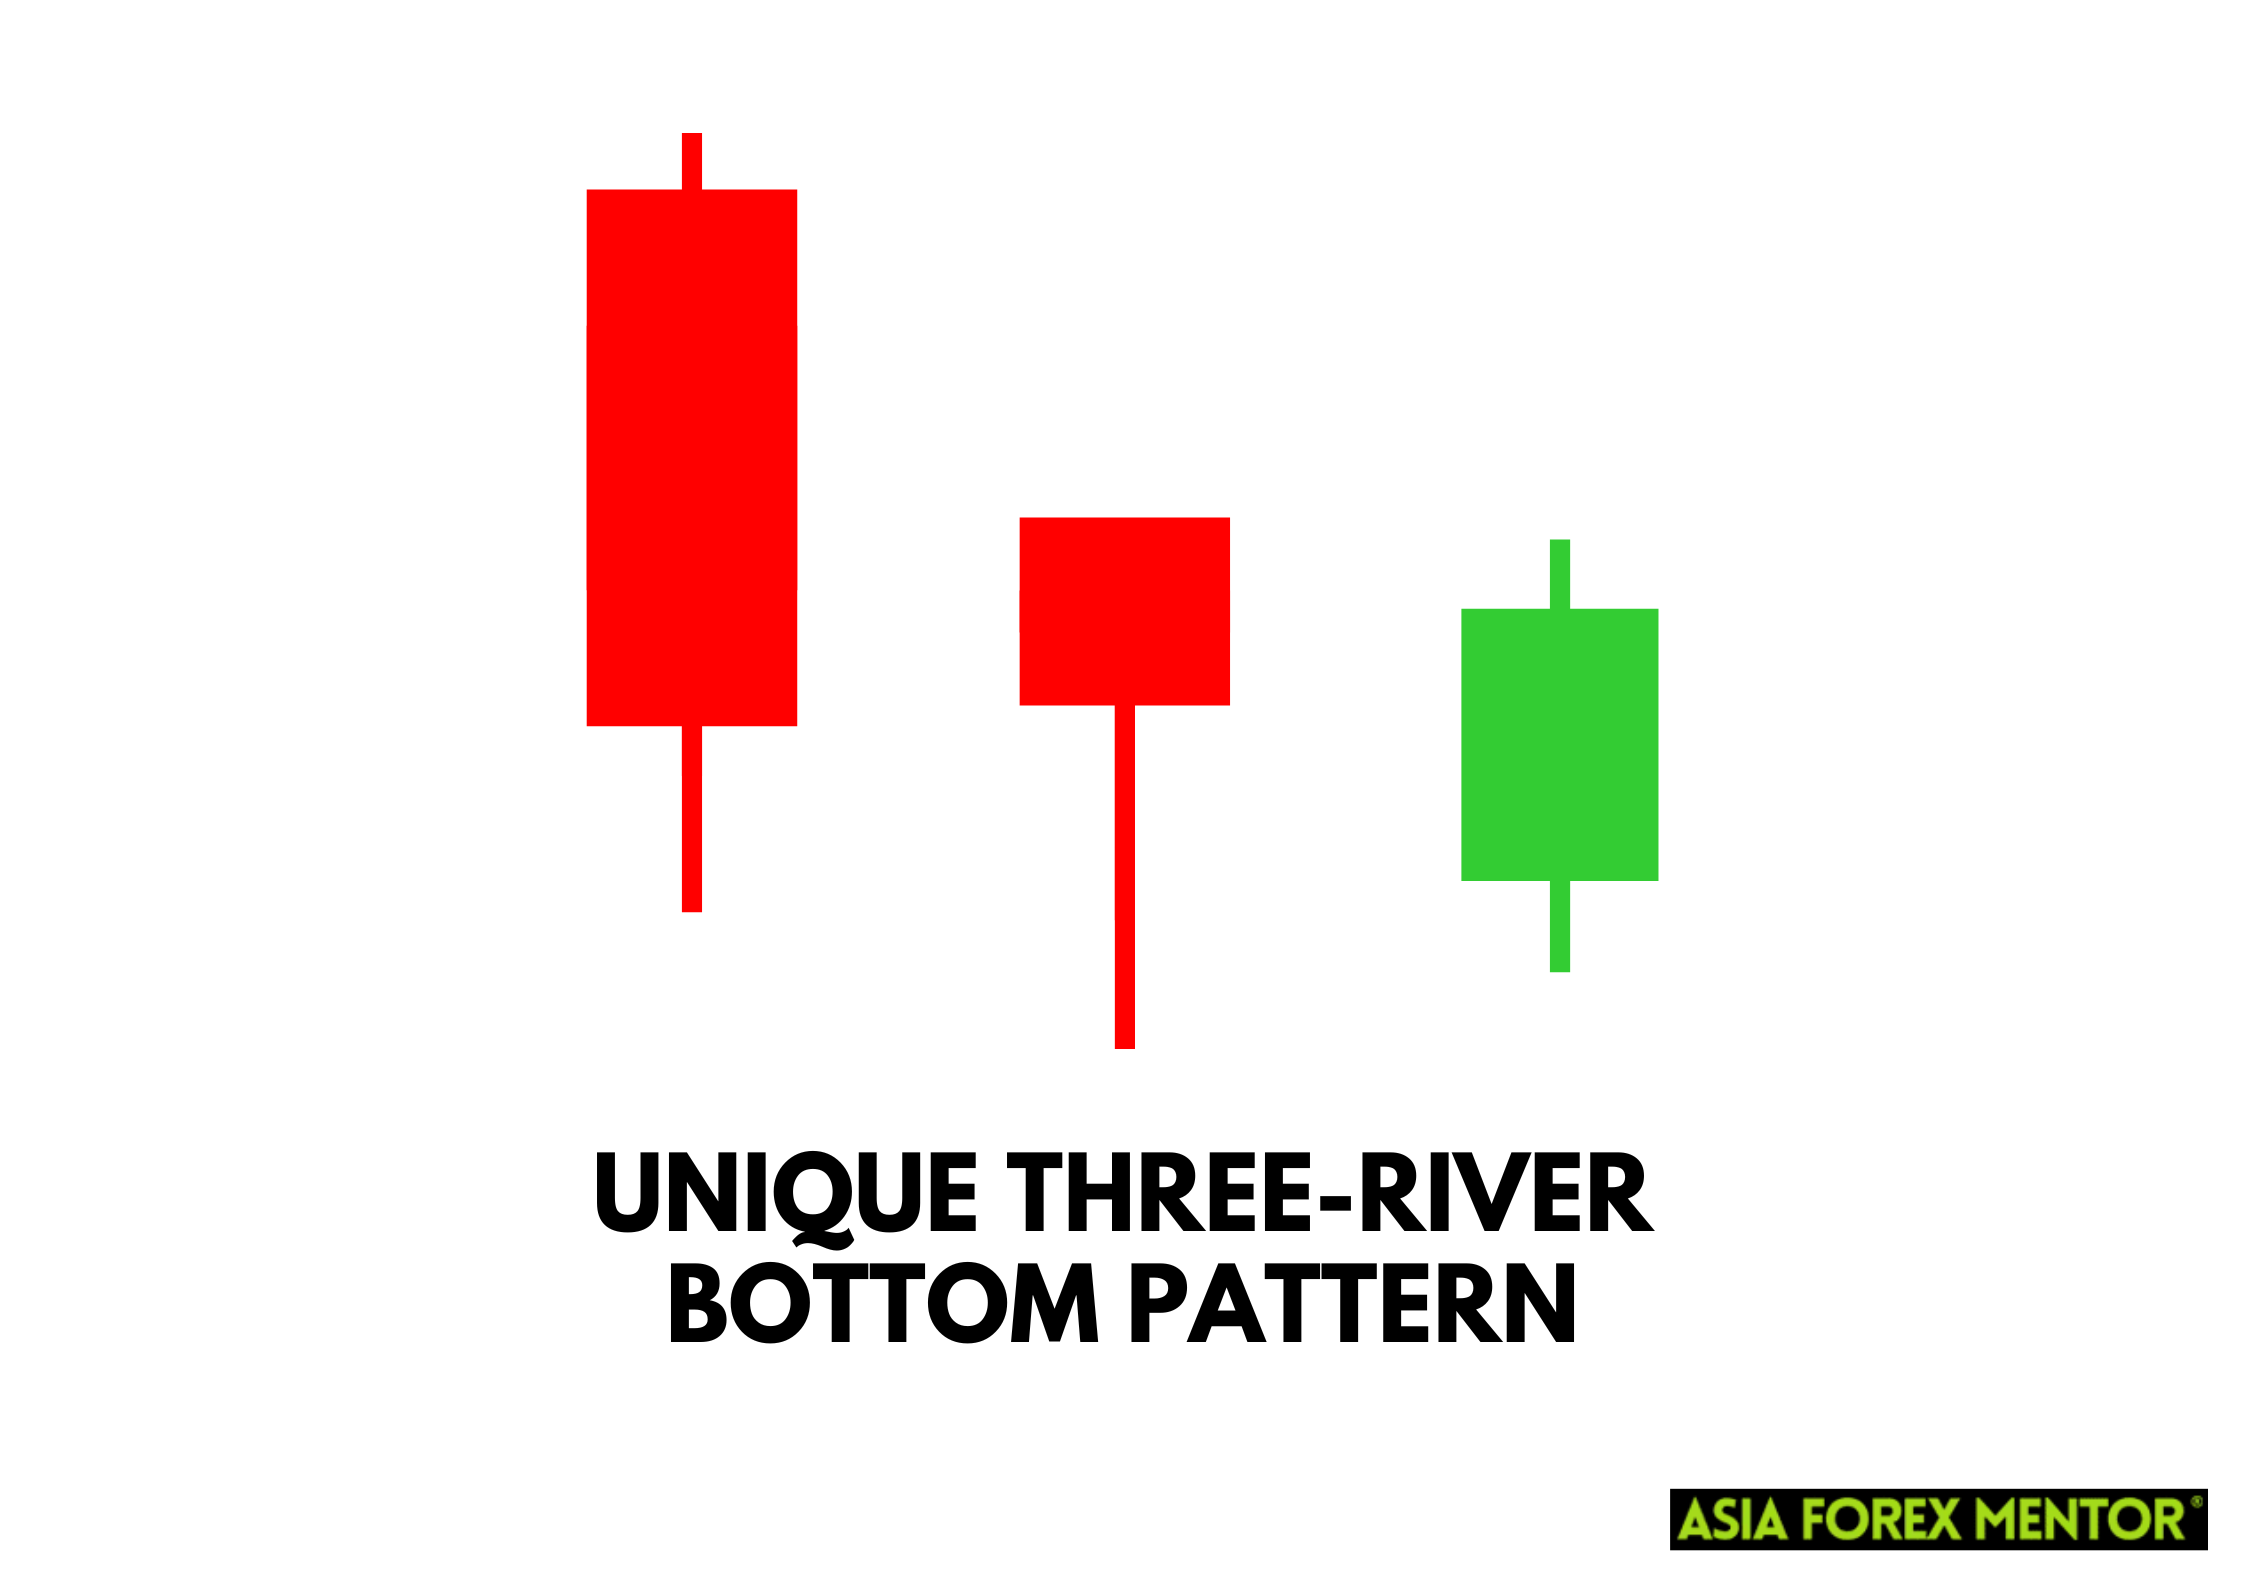
The Three-River Bottom is a bullish reversal candlestick pattern typically found at the end of a downtrend. It signifies a potential shift from a downtrend to an uptrend. This pattern comprises three candles:
- The first candle is a long bearish (red) candle, indicating the continuation of the existing downtrend.
- The second candle is a small-bodied candlestick (can be bullish or bearish), known as a doji or spinning top, showing market indecision.
- The third candle is a bullish (green) candlestick that closes above the high of the second candle, confirming the potential reversal.
Also Read: The 28 Forex Patterns Complete Guide
How to Spot the Unique Three-River Bottom Pattern
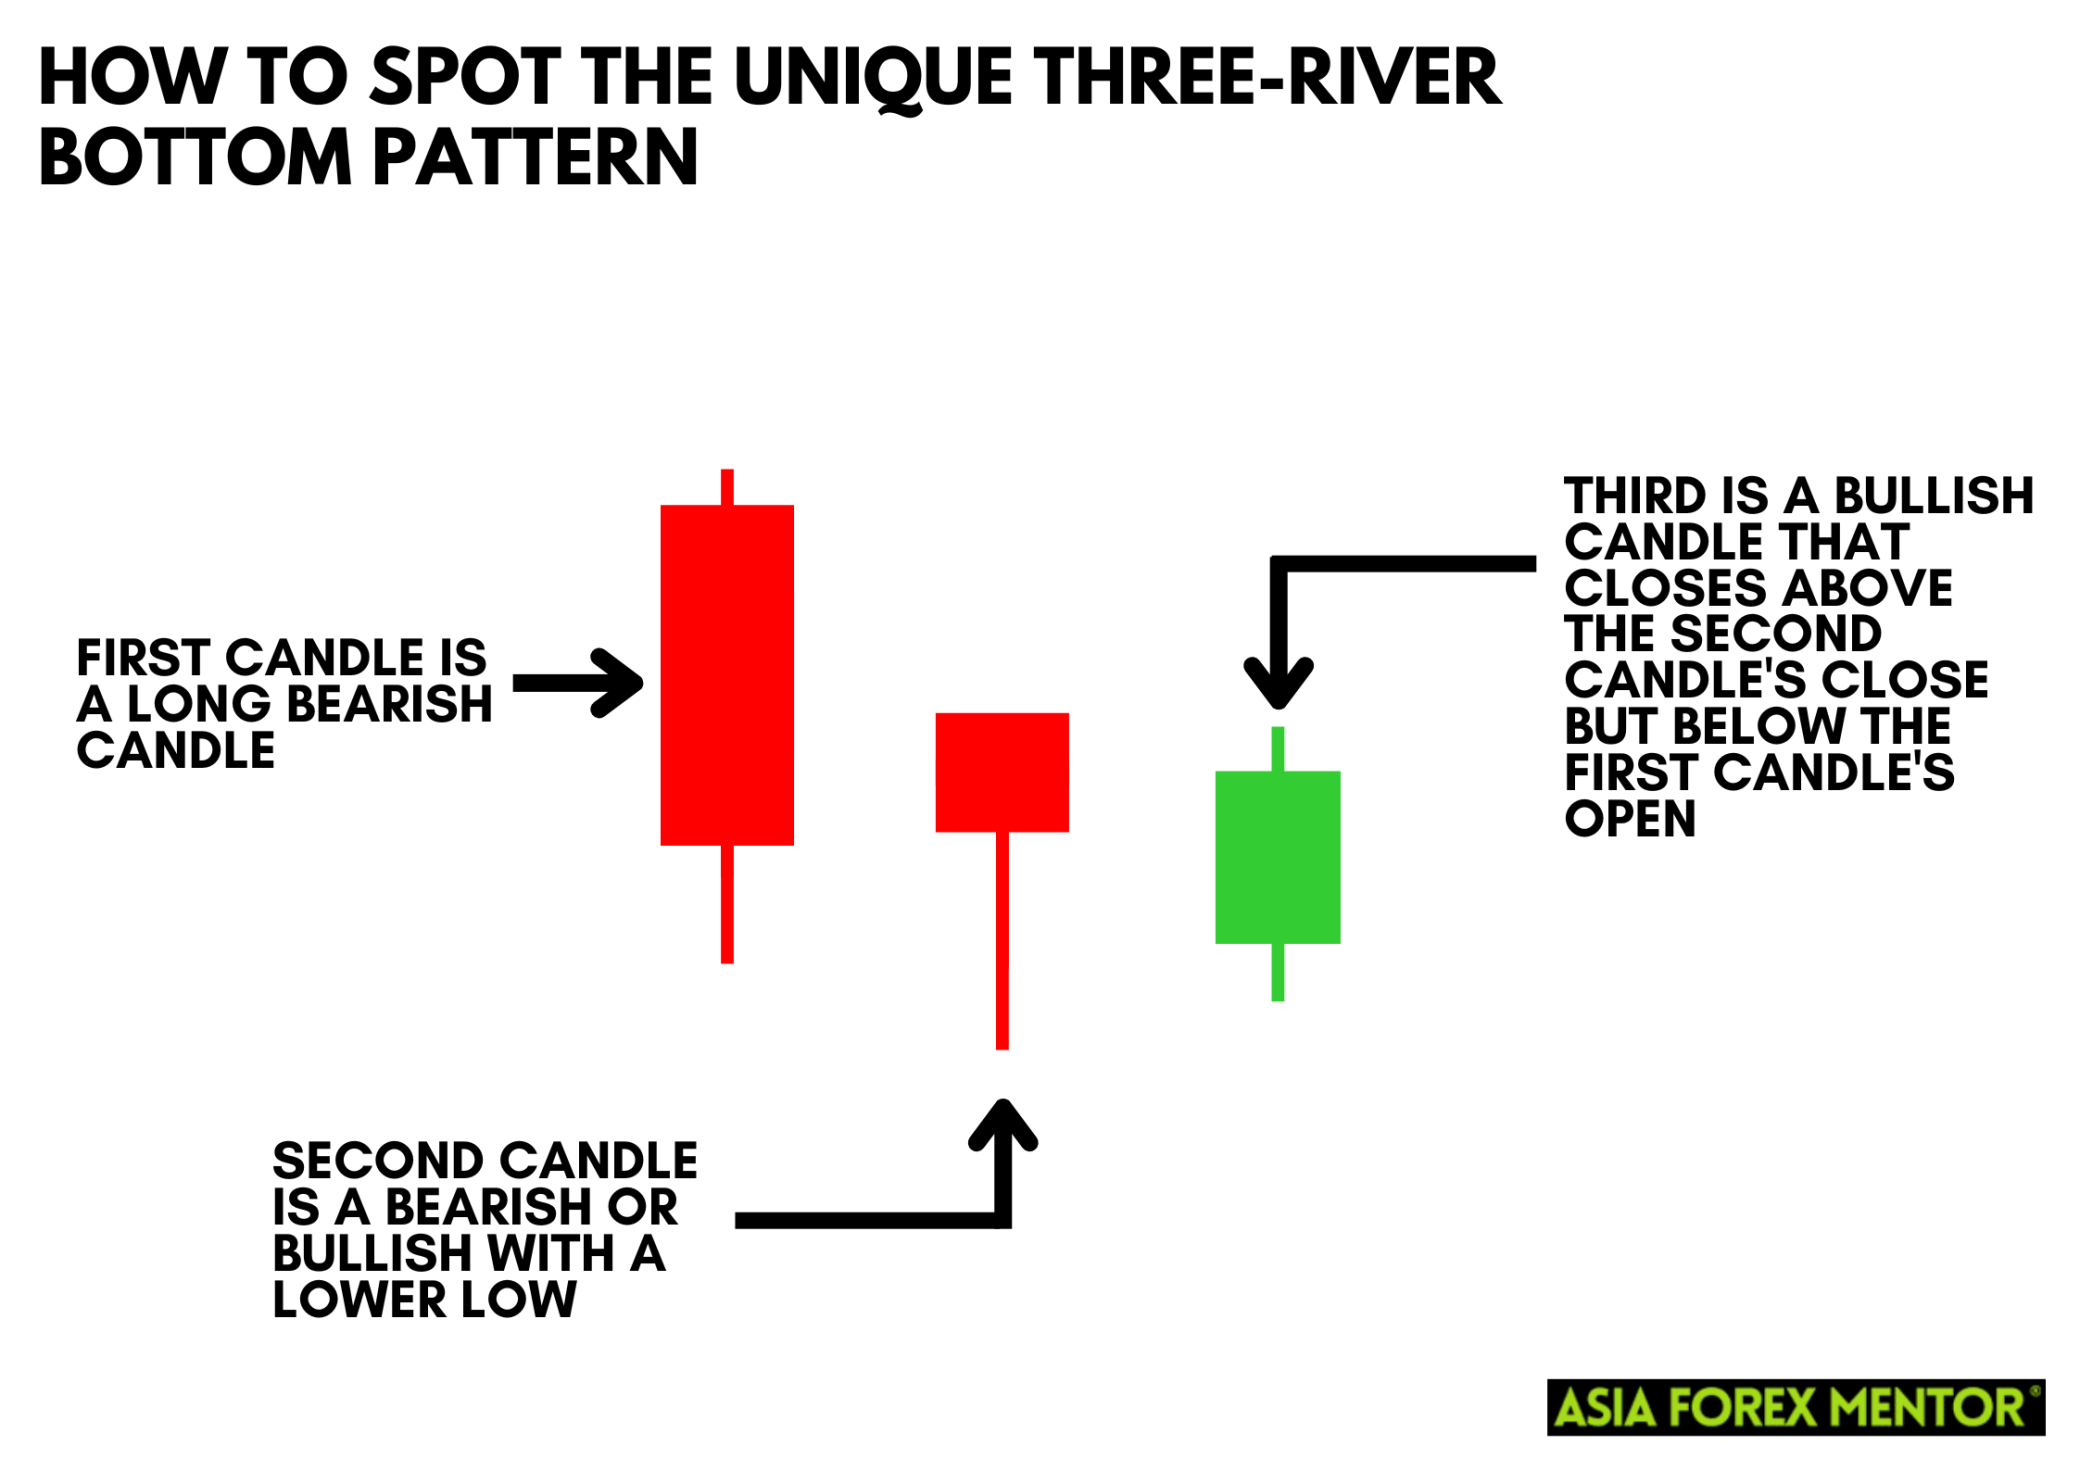
Identifying the Three-River Bottom pattern involves meticulous observation of candlestick charts. This candlestick chart pattern emerges during critical moments in market movements and recognizing it can significantly enhance trading decisions. Here's how to spot it effectively:
- Look for the pattern at the end of a pronounced downtrend: The Three-River Bottom pattern is a reversal signal, so it must occur after a clear and sustained downtrend. Ensure the preceding trend is well-defined and not just a minor pullback.
- Confirm the first candle as a long bearish candlestick: The first candle in this pattern should be a long red candle, which indicates that the bearish sentiment is still strong. This candle sets the stage for the pattern by reflecting the market's existing downtrend.
- The second candle should be a small-bodied candlestick, preferably a doji, indicating market indecision: The second candle is critical as it shows a halt in the downtrend. A doji, which has little to no body, signifies that neither the bulls nor the bears have gained control, indicating market indecision.
- The third candle must be a bullish candlestick that closes above the second candle's high: The third and final candle should be a green candle that closes above the high of the second candle. This bullish candlestick confirms the reversal by demonstrating a shift in market sentiment from bearish to bullish.
Traders often use daily charts to spot this pattern, but it can be identified on different time frames depending on the trading strategy. While daily charts provide a broader perspective, intraday charts can also reveal the pattern for shorter-term trading. Adjusting the time frame to suit your trading style can help in spotting the Three-River Bottom pattern more effectively.
How Do You Trade This Pattern?
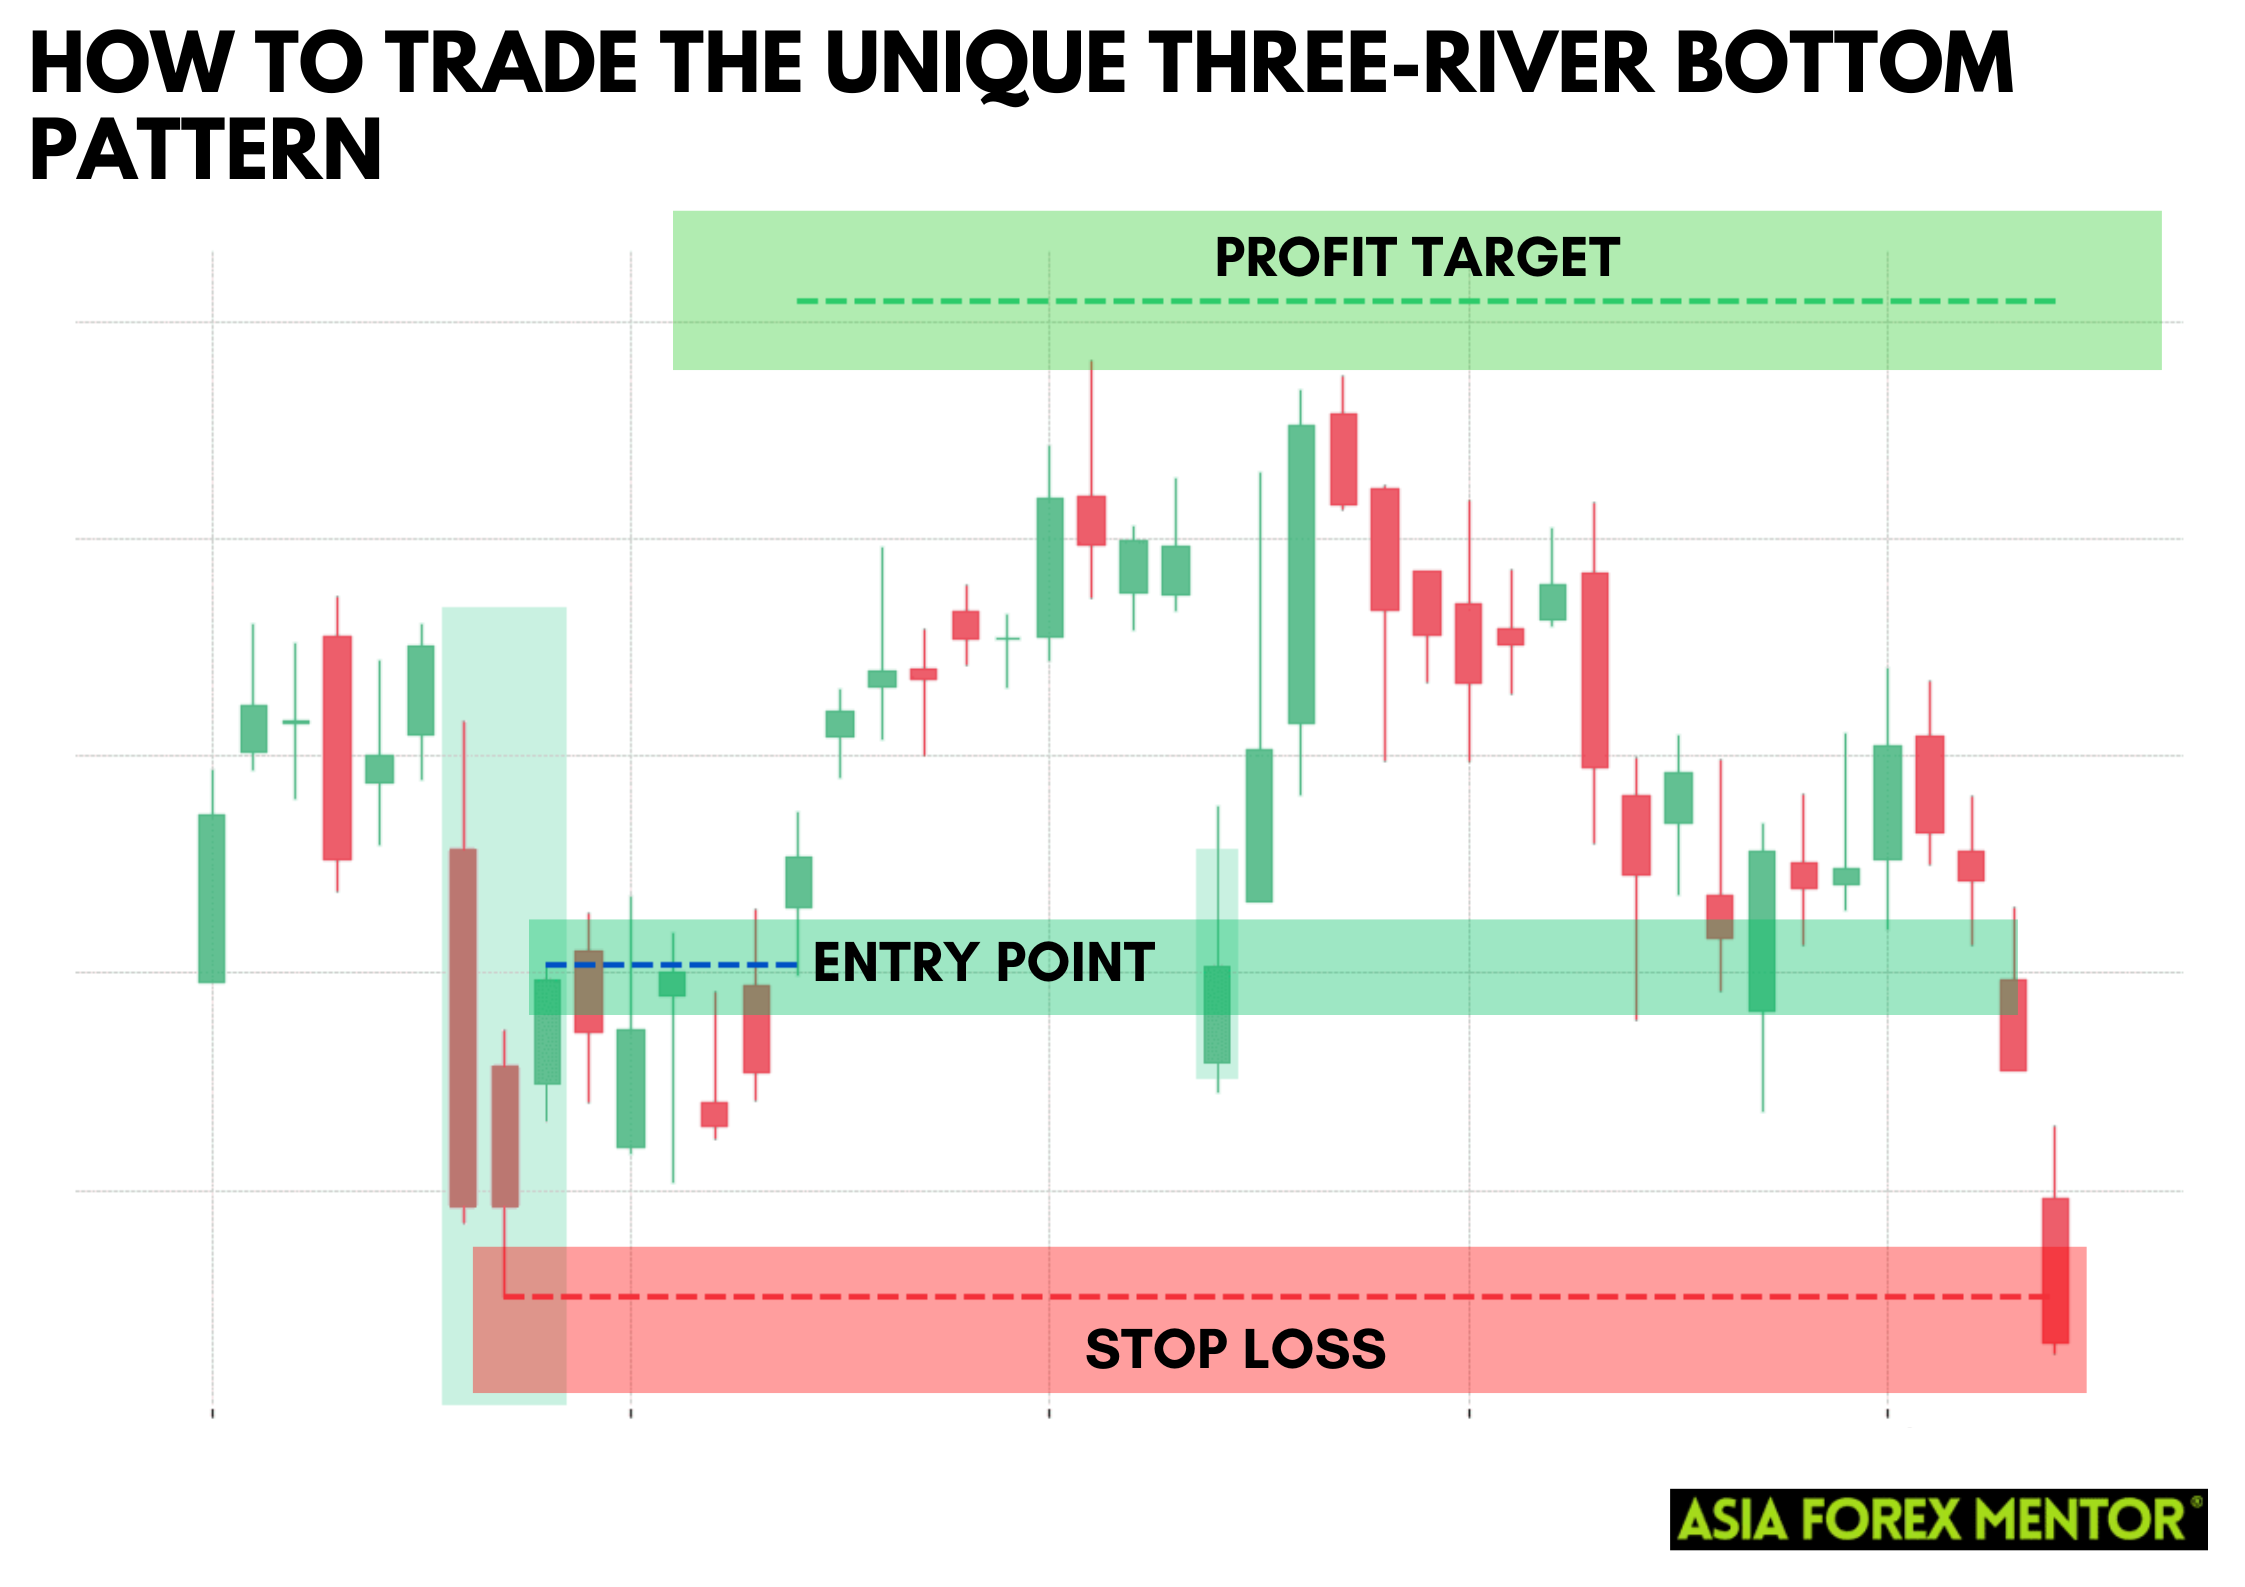
Trading the Three-River Bottom pattern effectively requires precise execution of entry and exit strategies to maximize potential gains and minimize risks. Here are detailed steps for trading this pattern:
Entry Point
Enter a long position at the close of the third bullish candle. This entry point is crucial because the third candle confirms the pattern and indicates a shift in market sentiment from bearish to bullish. By waiting for the third candle to close, traders can be more confident that the reversal is genuine. This approach helps in avoiding premature entries that might occur if the market hasn't fully shifted its sentiment.
Stop Loss
Place a stop loss just below the low of the second candle. This strategy is designed to minimize potential losses if the pattern fails and the market continues to trend downwards. The low of the second candle is a critical level because it represents the point of market indecision. If the price drops below this level, it suggests that the bearish trend may still be in control, making it a logical place to limit losses. Setting the stop loss here ensures that traders are protected against significant drawdowns while giving the trade enough room to develop.
Profit Target
Set a profit target based on key resistance levels or use a risk-reward ratio of 1:2 or 1:3. Identifying key resistance levels involves analyzing previous price action to find areas where the price has struggled to break through in the past. These levels can act as natural profit targets. Alternatively, using a predefined risk-reward ratio ensures a disciplined approach to trading. For example, with a 1:2 risk-reward ratio, if the stop loss is set 10 points below the entry price, the profit target would be set 20 points above the entry price. This method ensures that the potential reward justifies the risk taken on the trade, promoting a balanced approach to risk management and profit maximization.
Using Other Indicators to Confirm the Pattern
Relying solely on the Unique Three-River pattern might lead to false signals. Therefore, using additional indicators can enhance the reliability of trades:
- Moving Averages: A crossover of short-term and long-term moving averages can confirm the trend reversal.
- Relative Strength Index (RSI): An RSI below 30 and rising can indicate oversold conditions and a potential upward movement.
- Volume: An increase in volume on the third candle adds validity to the bullish reversal.
- Bollinger Bands: A pattern forming near the lower Bollinger Band can signify a reversal.
Pros and Cons
Pros
- Provides an early indication of a potential bullish reversal.
- Recognizing the pattern requires basic knowledge of candlestick charts.
- Works well in identifying reversals in downtrending markets.
- Clear entry, stop loss, and profit target levels help manage risk.
- Can be applied to various financial instruments and time frames.
Cons
- Can produce false signals, especially in volatile markets.
- Reliance on additional indicators for confirmation is necessary.
- May signal short-term reversals that don’t sustain long-term trends.
- Similar patterns can be confused, leading to incorrect trades.
- Less effective in sideways or low-volume markets.
Conclusion
The Unique Three-River candlestick pattern is a valuable tool for traders seeking to capitalize on bullish reversals in downtrending markets. By understanding its formation, identifying it accurately, and using additional indicators for confirmation, traders can enhance their trading strategies. Despite its benefits, it's essential to acknowledge the pattern's limitations and combine it with sound risk management practices to ensure successful trading outcomes.
Also Read: How to Trade the Downside Gap Two Rabbits Pattern
FAQs
Can the Three-River Bottom pattern be used in all markets?
Yes, it can be applied to various markets, including stocks, forex, and commodities, but always confirm with other indicators.
What is the most critical aspect of trading the Three-River Bottom pattern?
The most crucial aspect is confirmation. Always use additional indicators or volume to confirm the pattern before entering a trade.
How often does the Three-River Bottom pattern appear?
The pattern is relatively rare but significant when it appears, particularly after a strong downtrend.