When you are Forex trading, understanding candlestick patterns is crucial for making informed decisions. These patterns offer valuable insights into market sentiment and potential price movements, enabling traders to anticipate trends and make strategic trades. One such pattern that traders often look for is the Gap Side-by-Side White Lines. Recognizing this pattern can provide traders with clear signals about market direction and momentum, making it an essential tool in a trader's arsenal.
This article will explore both the Up and Down Gap Side-by-Side White Lines patterns, including how to spot them, how to trade them, and their respective pros and cons. By mastering these patterns, traders can enhance their ability to identify potential entry and exit points, thus improving their overall trading performance. Understanding how to effectively utilize these patterns can lead to more confident trading decisions and better risk management in the ever-volatile Forex market.
Also Read: The 28 Forex Patterns Complete Guide
What is the Up Gap Side-by-Side White Lines?
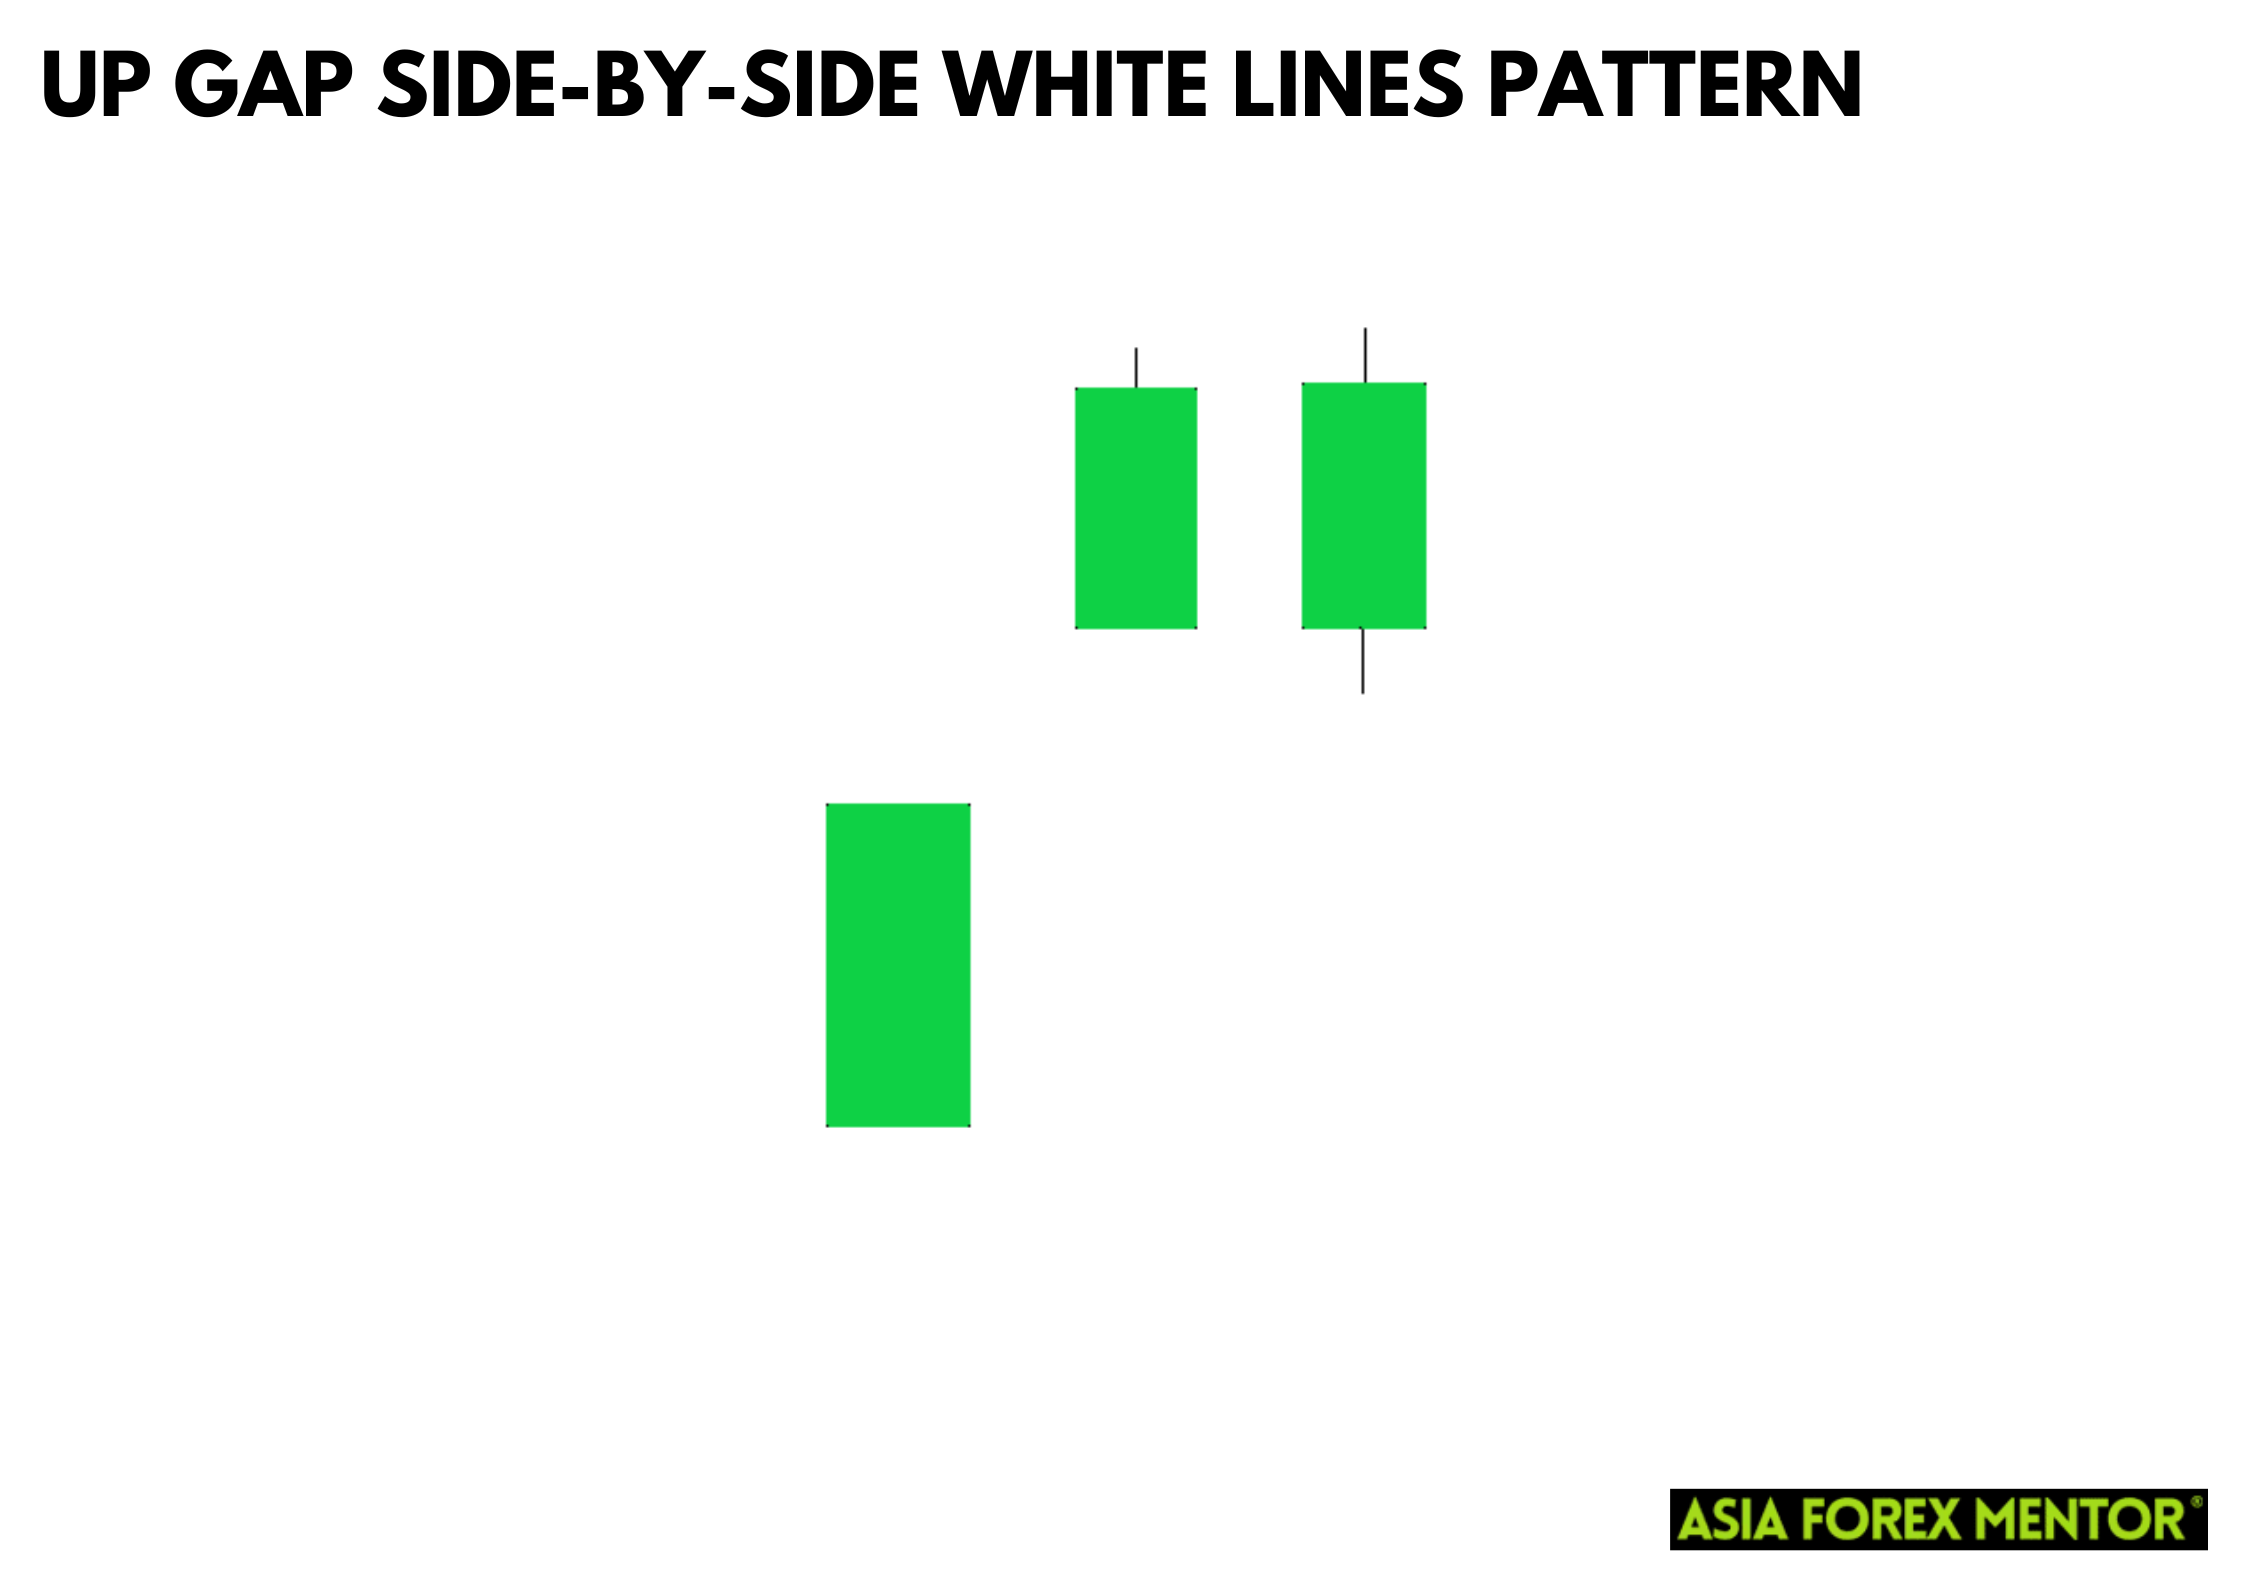
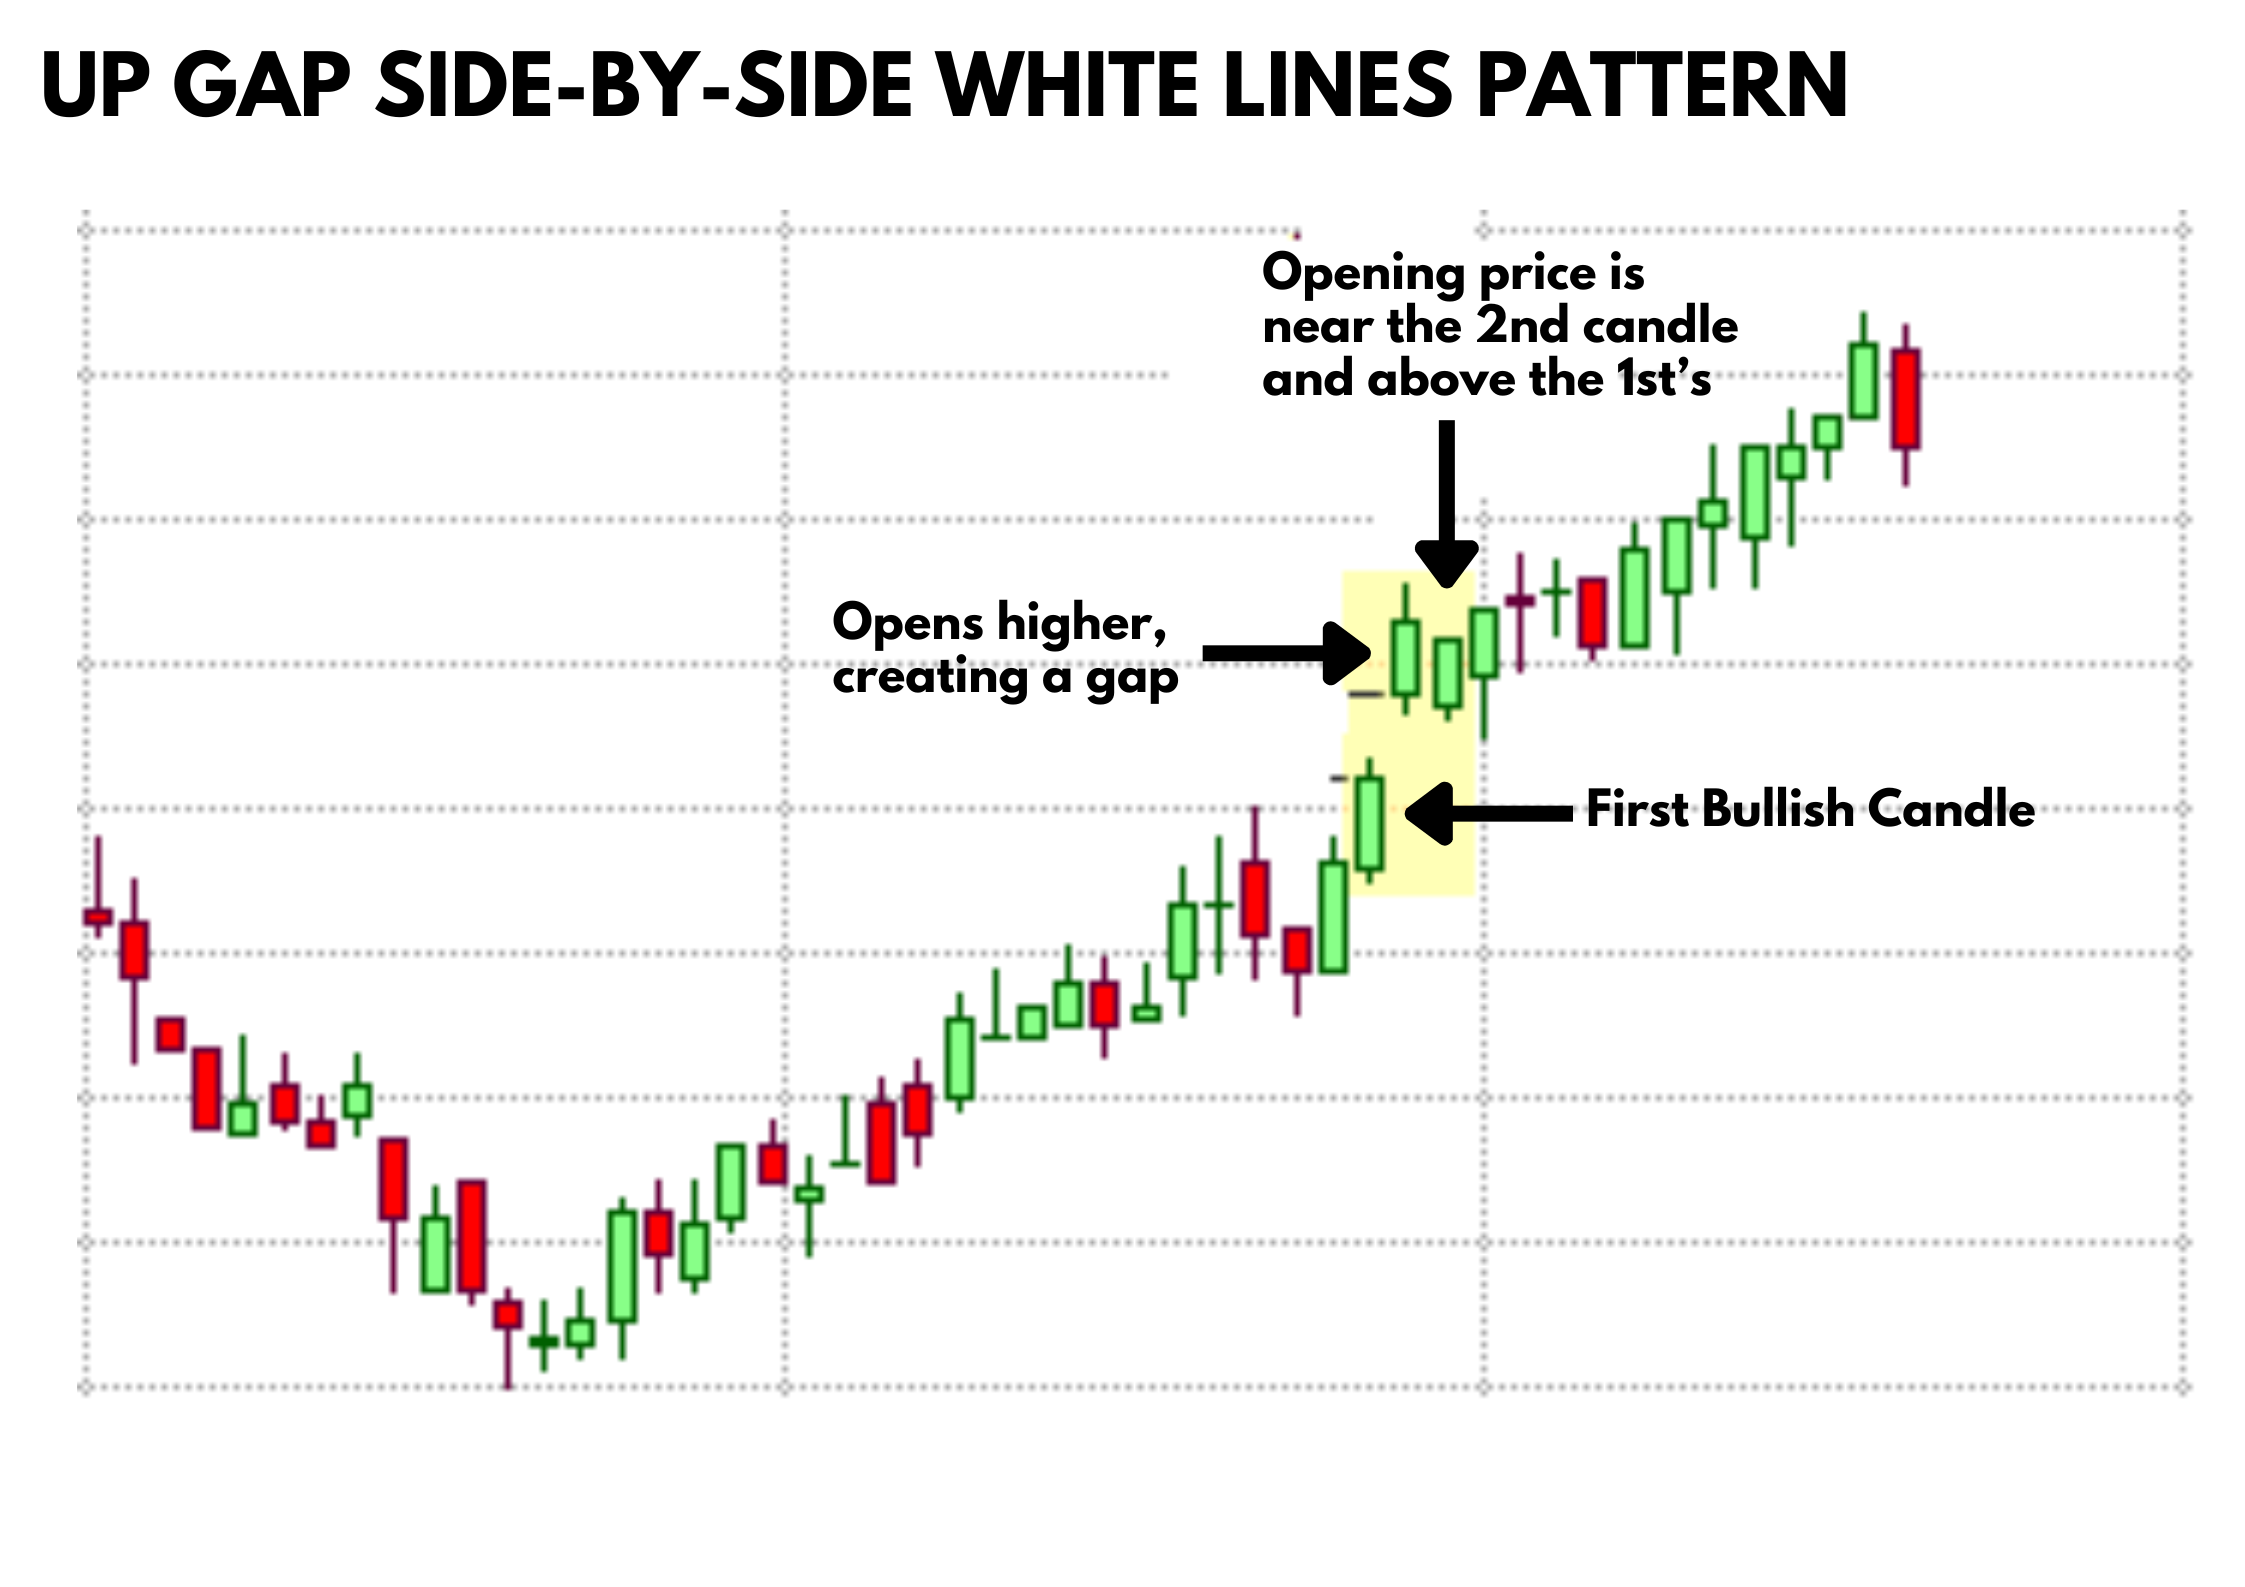
The Up Gap Side-by-Side White Lines is a bullish continuation pattern that signals strong upward momentum in the market. It consists of three candlesticks, beginning with a bullish candle that indicates initial buying interest. This is followed by a gap up, where the opening price of the second candlestick is significantly higher than the close of the first, reflecting a surge in bullish sentiment. The pattern is completed by two additional bullish candles that have similar opening prices, reinforcing the continuation of the bullish trend.
Traders look for the Up Gap Side-by-Side White Lines as it provides a clear indication of market confidence and sustained buying pressure. Spotting this pattern involves identifying the initial bullish candle, confirming the presence of a gap up, and ensuring the subsequent candles maintain their bullish nature with similar openings. Recognizing this pattern can help traders to capitalize on bullish trends, providing strategic entry points for long positions while offering insights into potential market behavior.
How to Spot the Up Gap Side-by-Side White Lines
To identify the Up Gap Side-by-Side White Lines pattern in Forex charts, look for the following:
- First Candle: A bullish (white or green) candlestick.
- Gap Up: The second candlestick opens higher than the close of the first candle, creating a gap.
- Second and Third Candles: Both are bullish candles with their opening prices near each other and above the first candle’s closing price.
How to Trade the Up Gap Side-by-Side White Lines
Trading the Up Gap Side-by-Side White Lines involves:
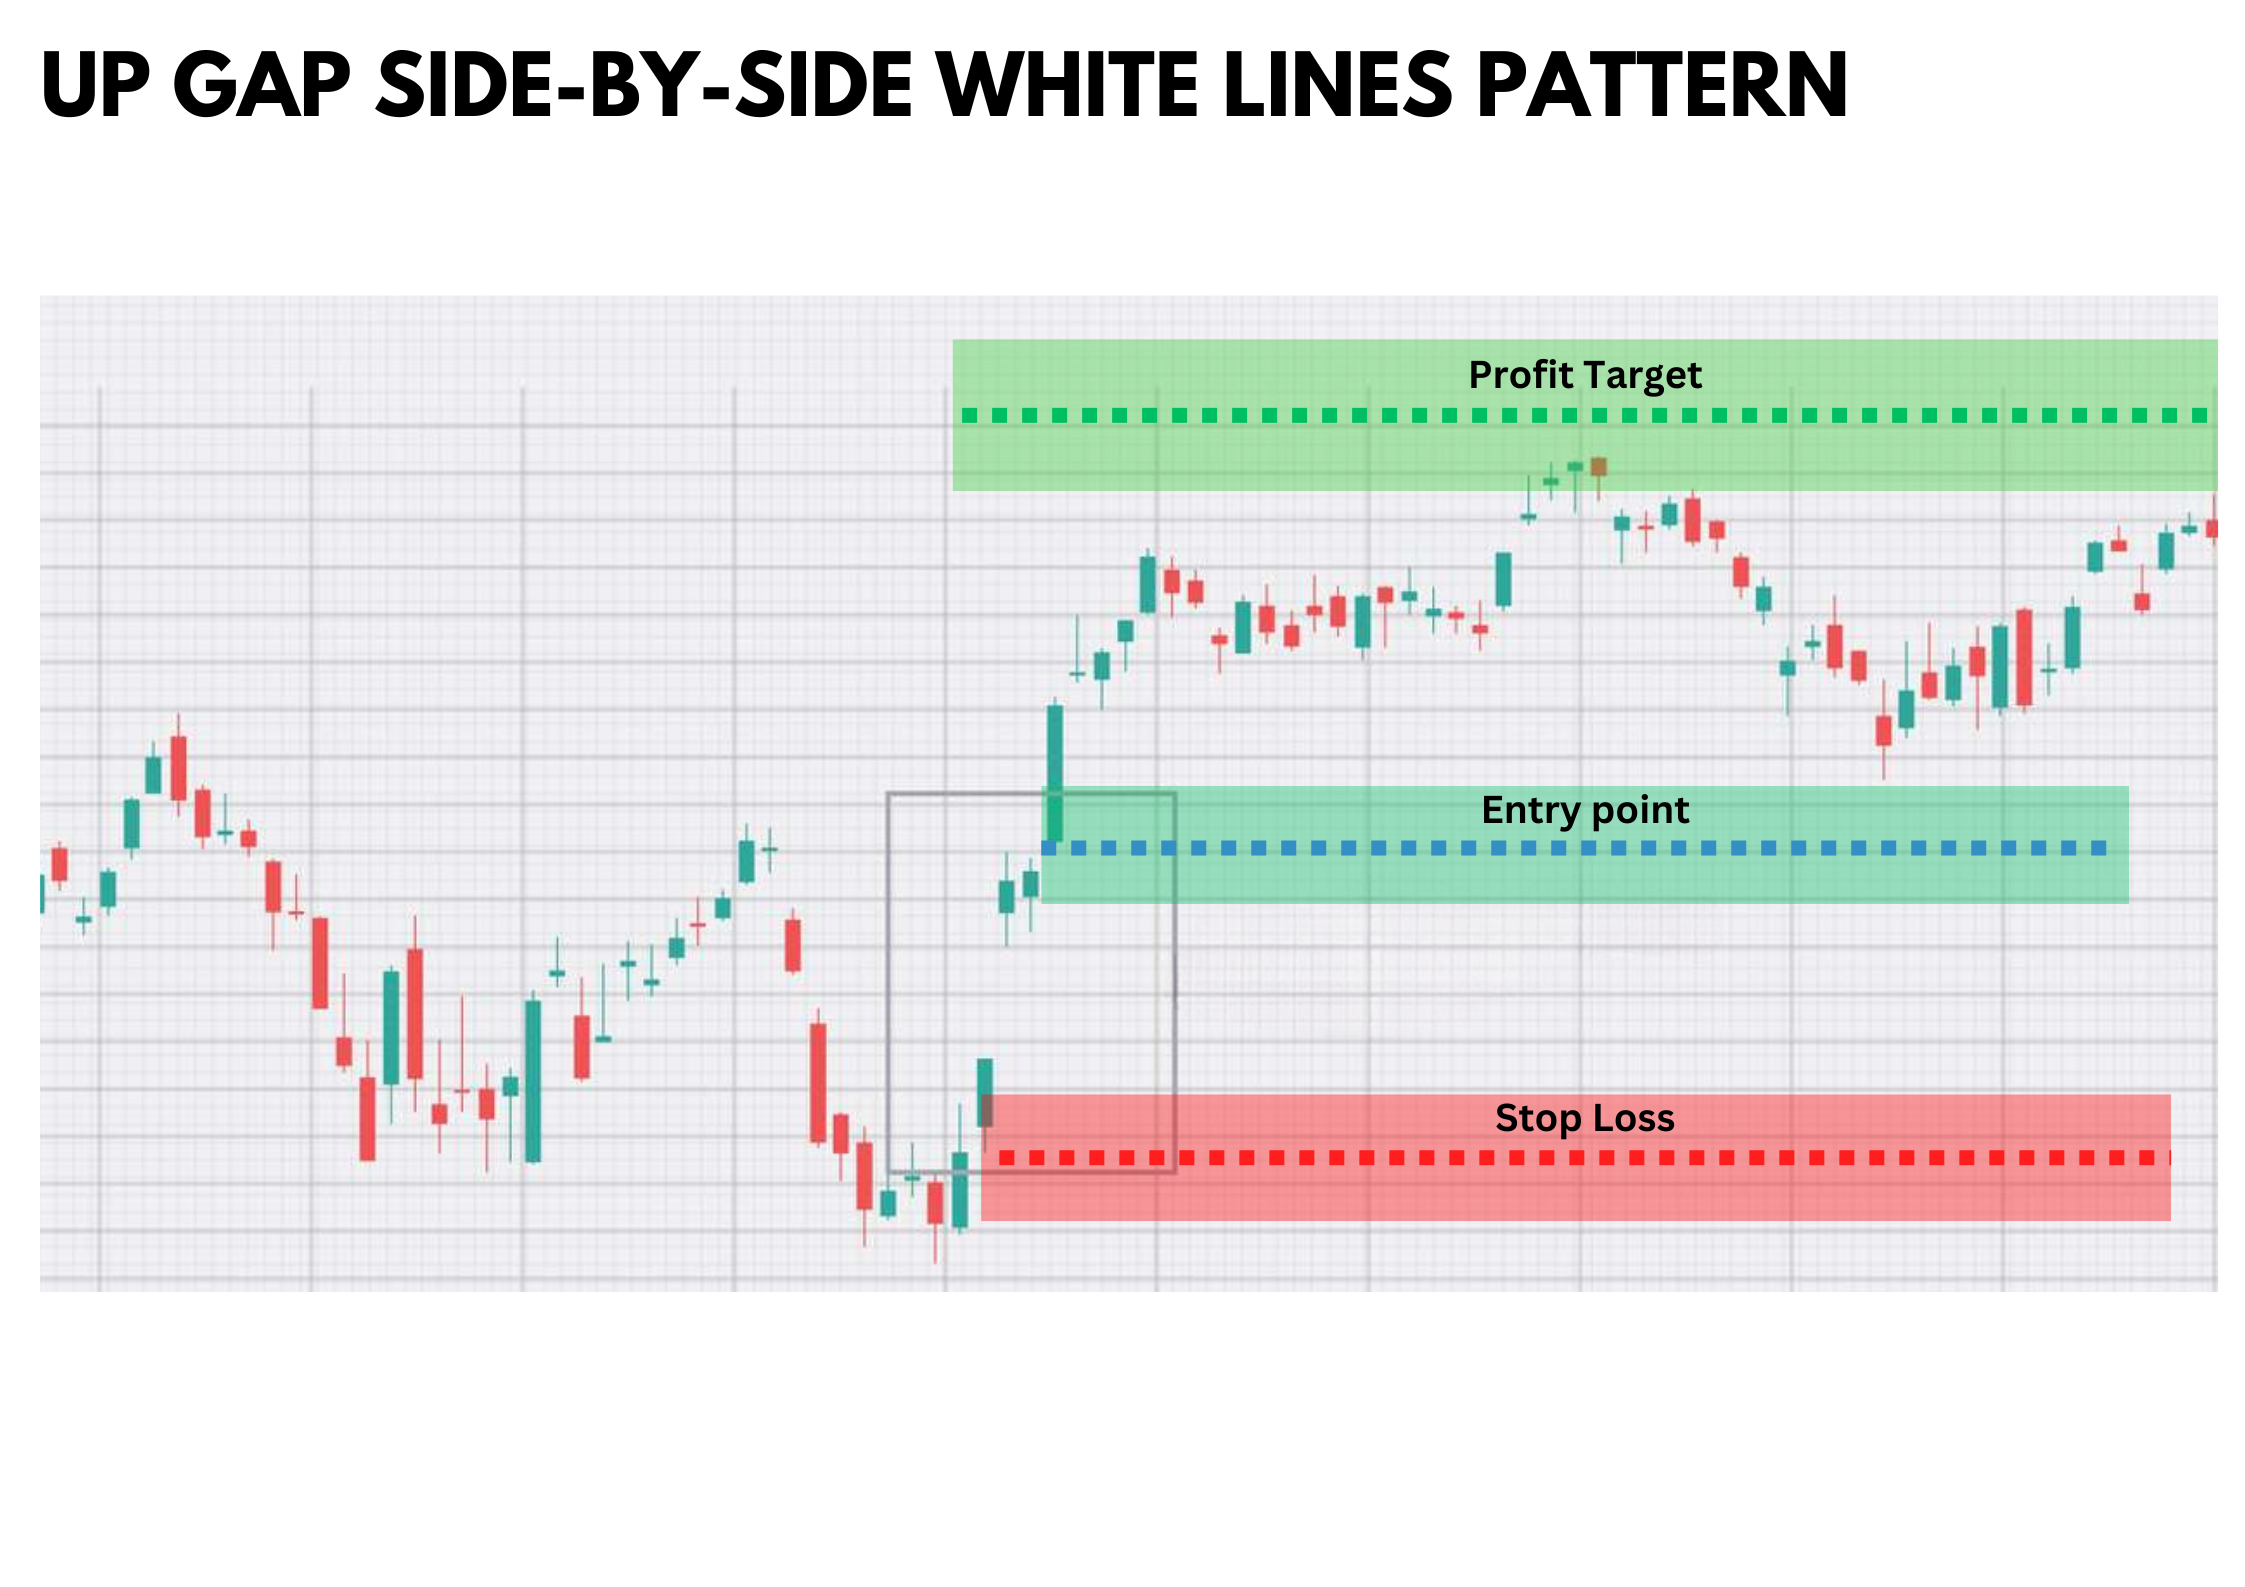
- Entry Point: Enter a long position at the close of the third candle.
- Stop Loss: Place a stop loss below the low of the first candle to manage risk.
- Take Profit: Use a trailing stop or set a target based on a prior resistance level or a risk-reward ratio of at least 1:2.
Pros and Cons of the Up Gap Side-by-Side White Lines
Pros
- Indicates strong bullish momentum.
- Can provide a clear entry point for long positions.
- Relatively easy to spot on charts.
Cons
- Requires a gap, which may not always occur.
- False signals can occur in highly volatile markets.
- Depends on the overall market trend for accuracy.
What is the Down Gap Side-by-Side White Lines?
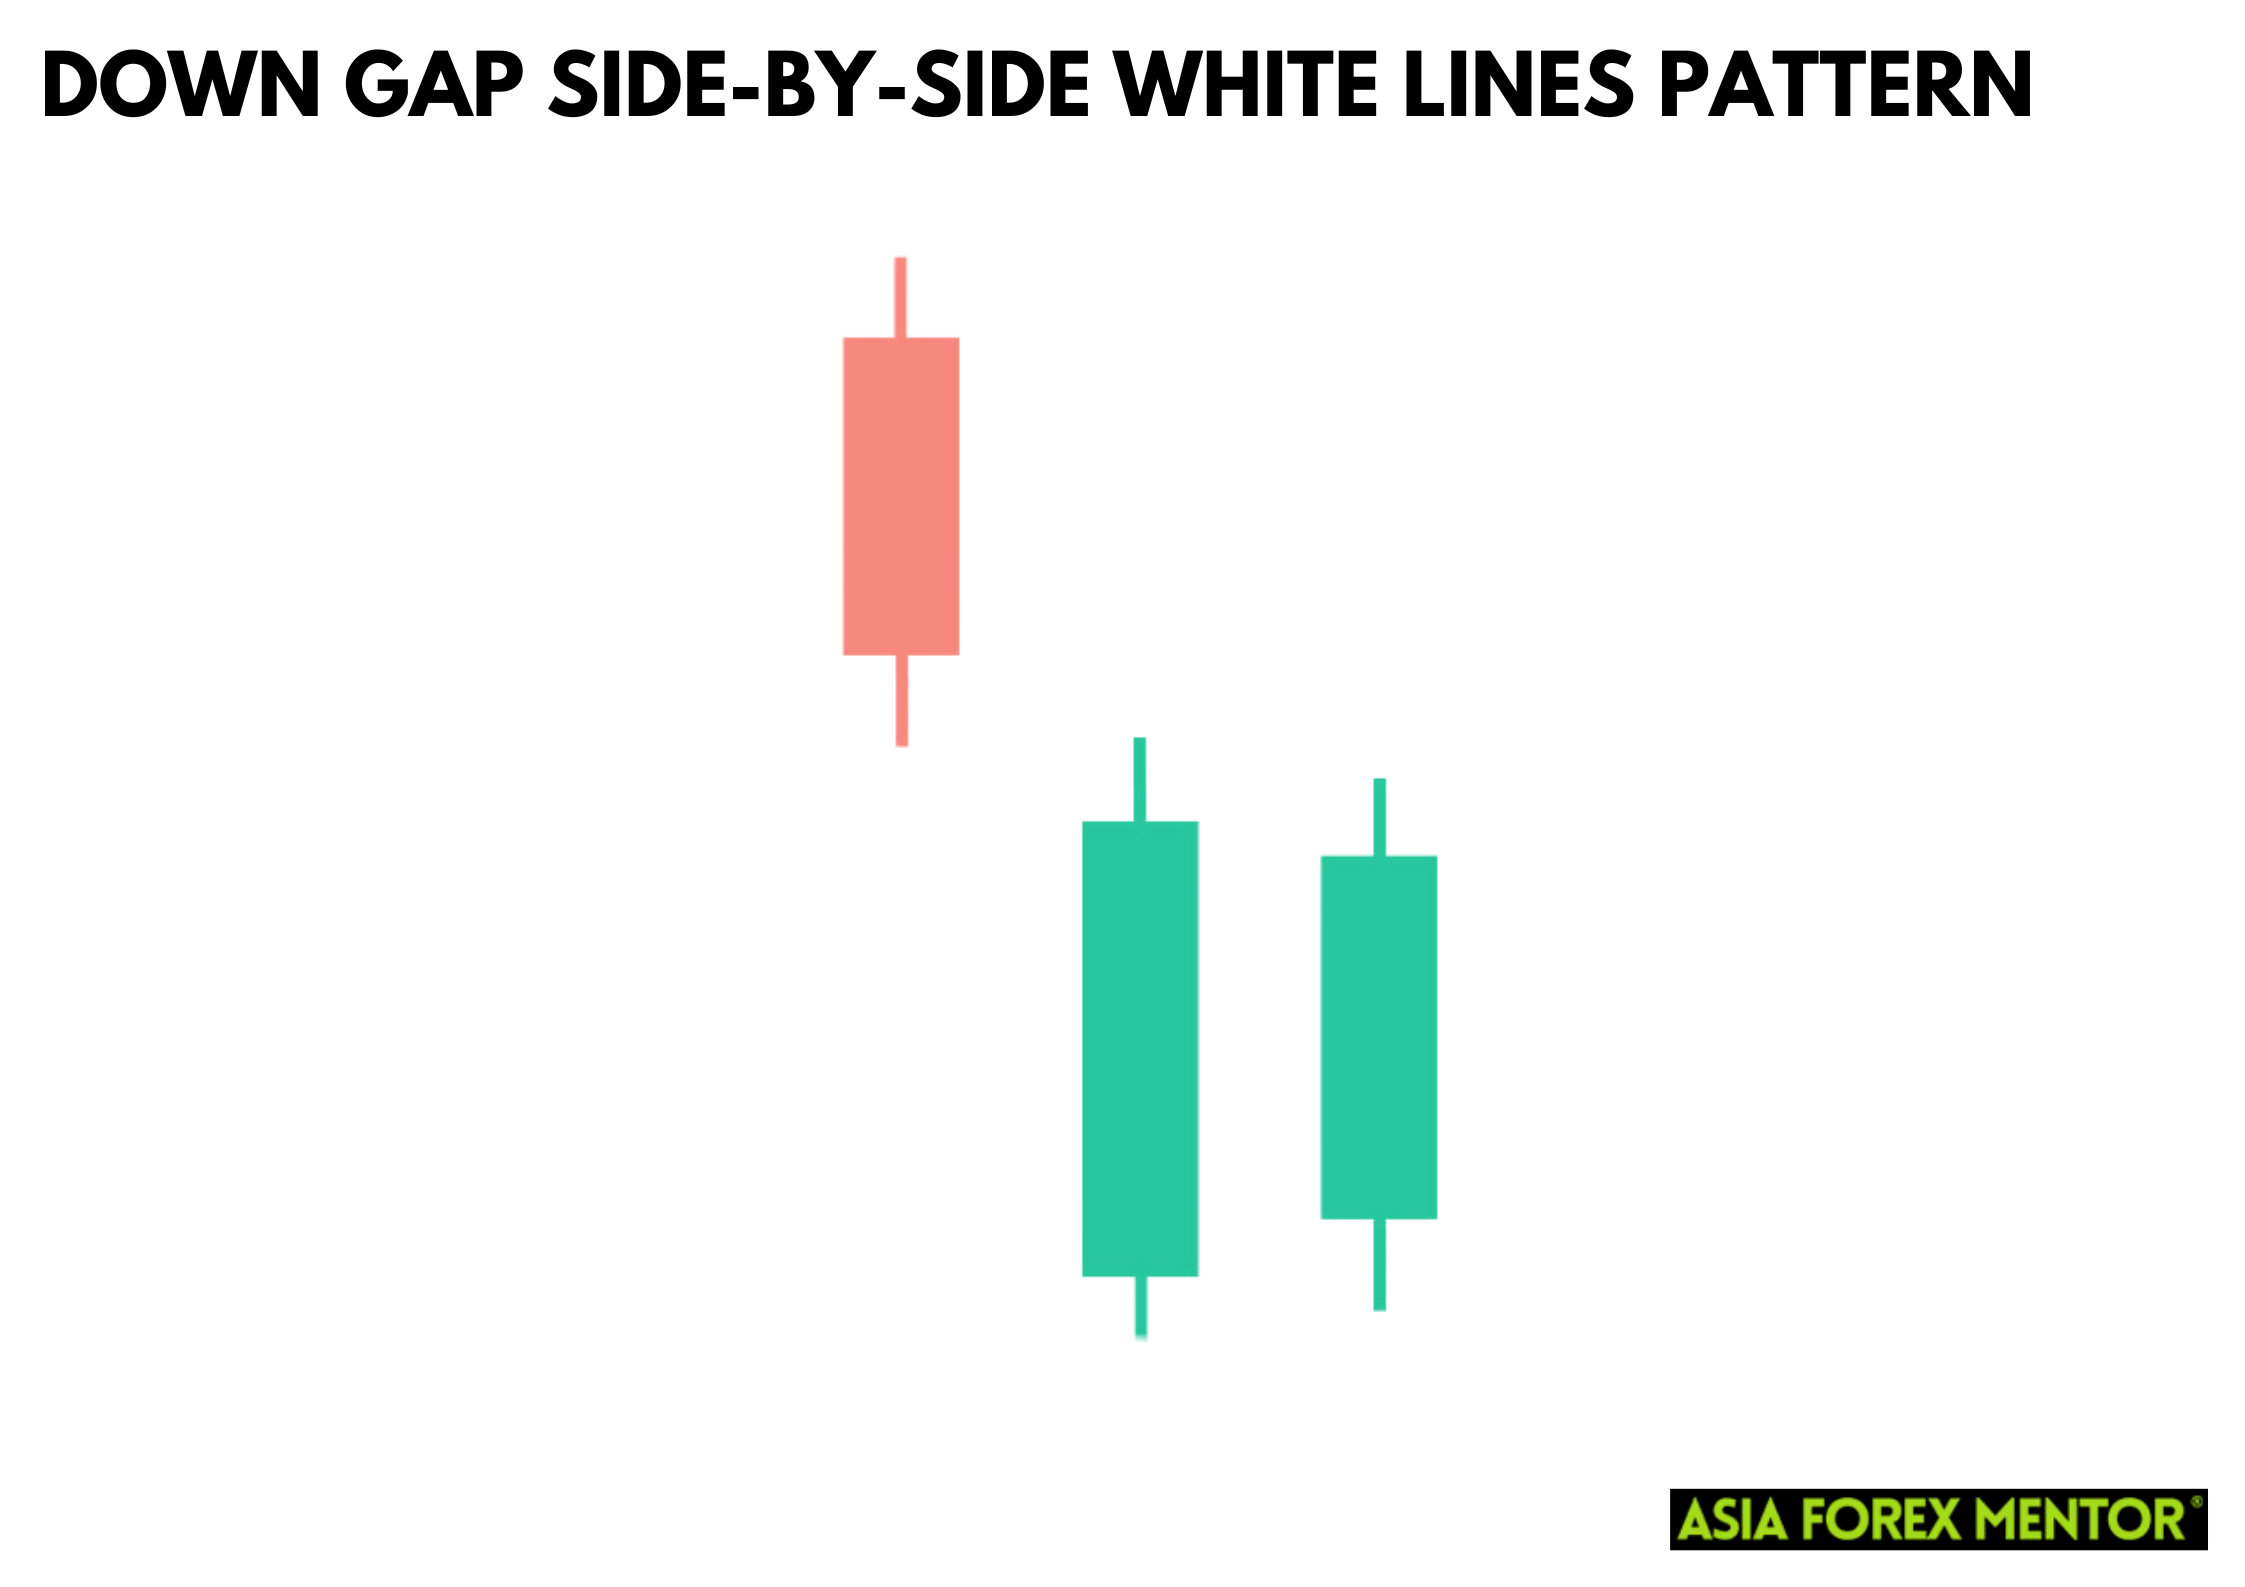
The Down Gap Side-by-Side White Lines is a bearish continuation candlestick pattern that indicates ongoing downward pressure in the market. This continuation pattern is composed of three candlesticks, beginning with a bearish candle that reflects initial selling interest. This is followed by a gap down, where the opening price of the second candlestick is significantly lower than the close of the first, showcasing a strong bearish sentiment. The pattern is completed by two additional bearish candles that have similar opening prices, underscoring the continuation of the downward trend.
Traders seek out the Down Gap Side-by-Side White Lines as it provides a clear signal of market pessimism and persistent selling pressure. Identifying this pattern involves spotting the initial bearish candle, confirming the presence of a gap down, and ensuring the subsequent candles maintain their bearish nature with similar openings.
How to Spot the Down Gap Side-by-Side White Lines
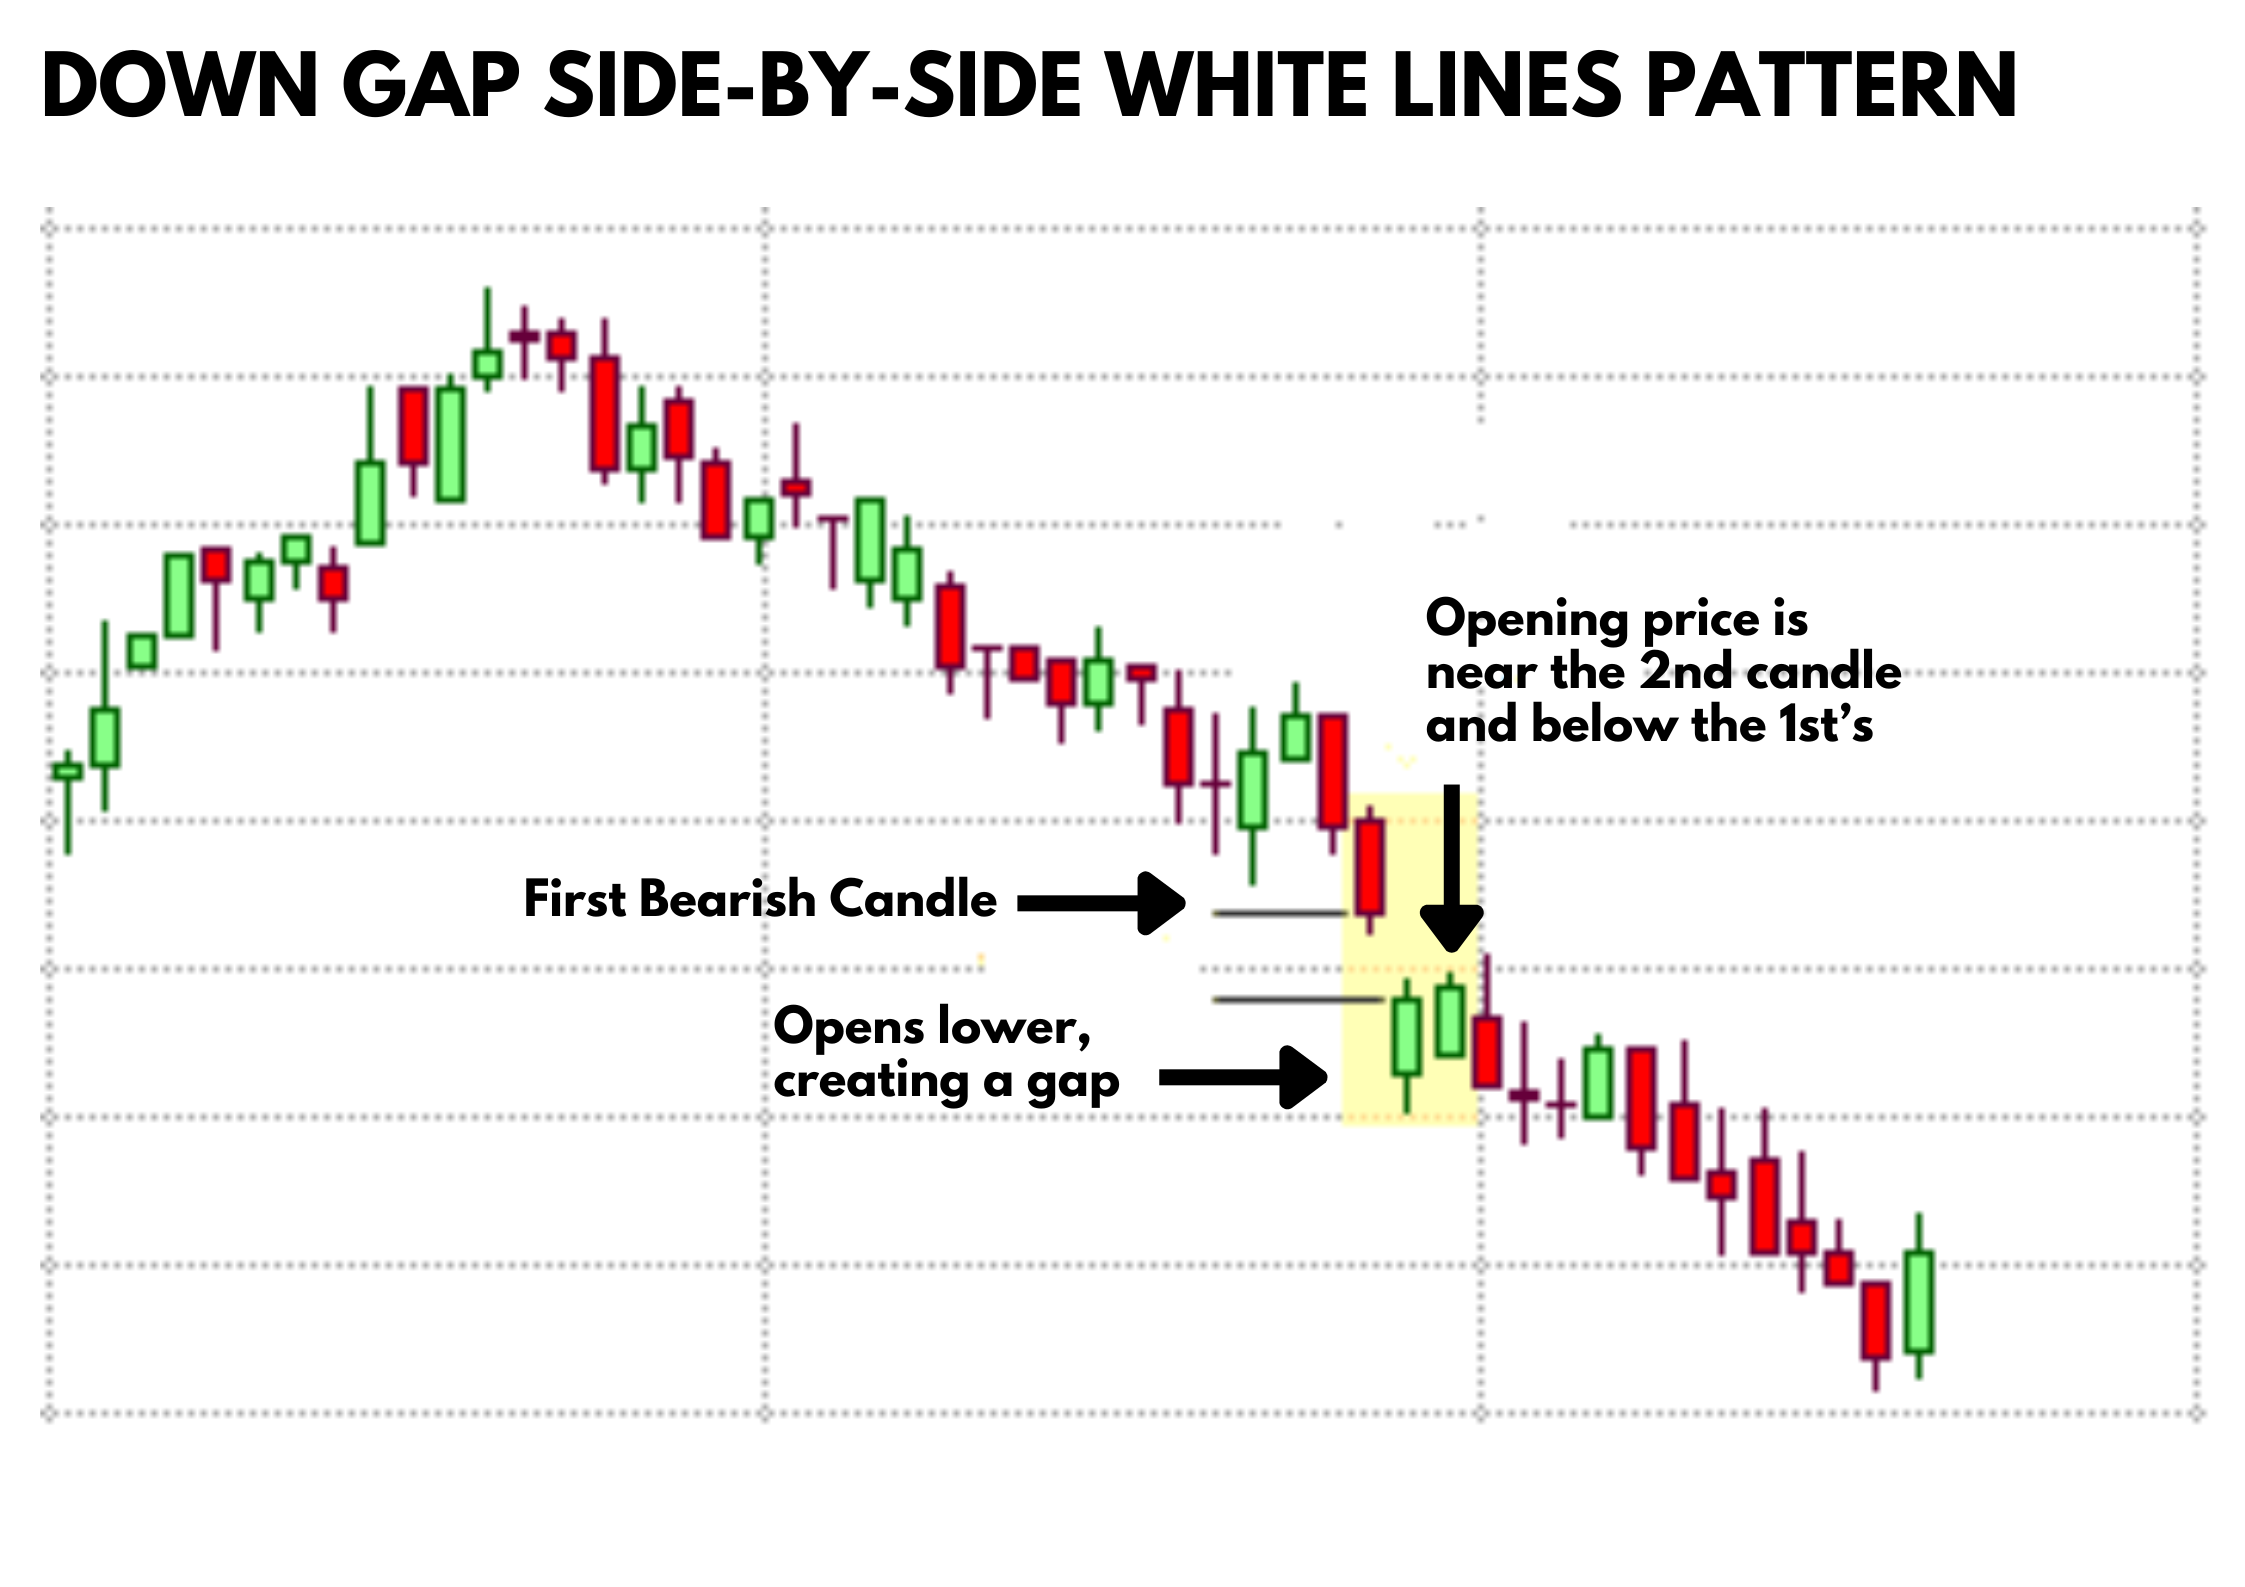
To identify the Down Gap Side-by-Side White Lines pattern in Forex charts, look for the following:
- First Candle: A bearish (black or red) candlestick.
- Gap Down: The second candlestick opens lower than the close of the first candle, creating a gap.
- Second and Third Candles: Both are bearish candles with their opening prices near each other and below the first candle’s closing price.
How to Trade the Down Gap Side-by-Side White Lines
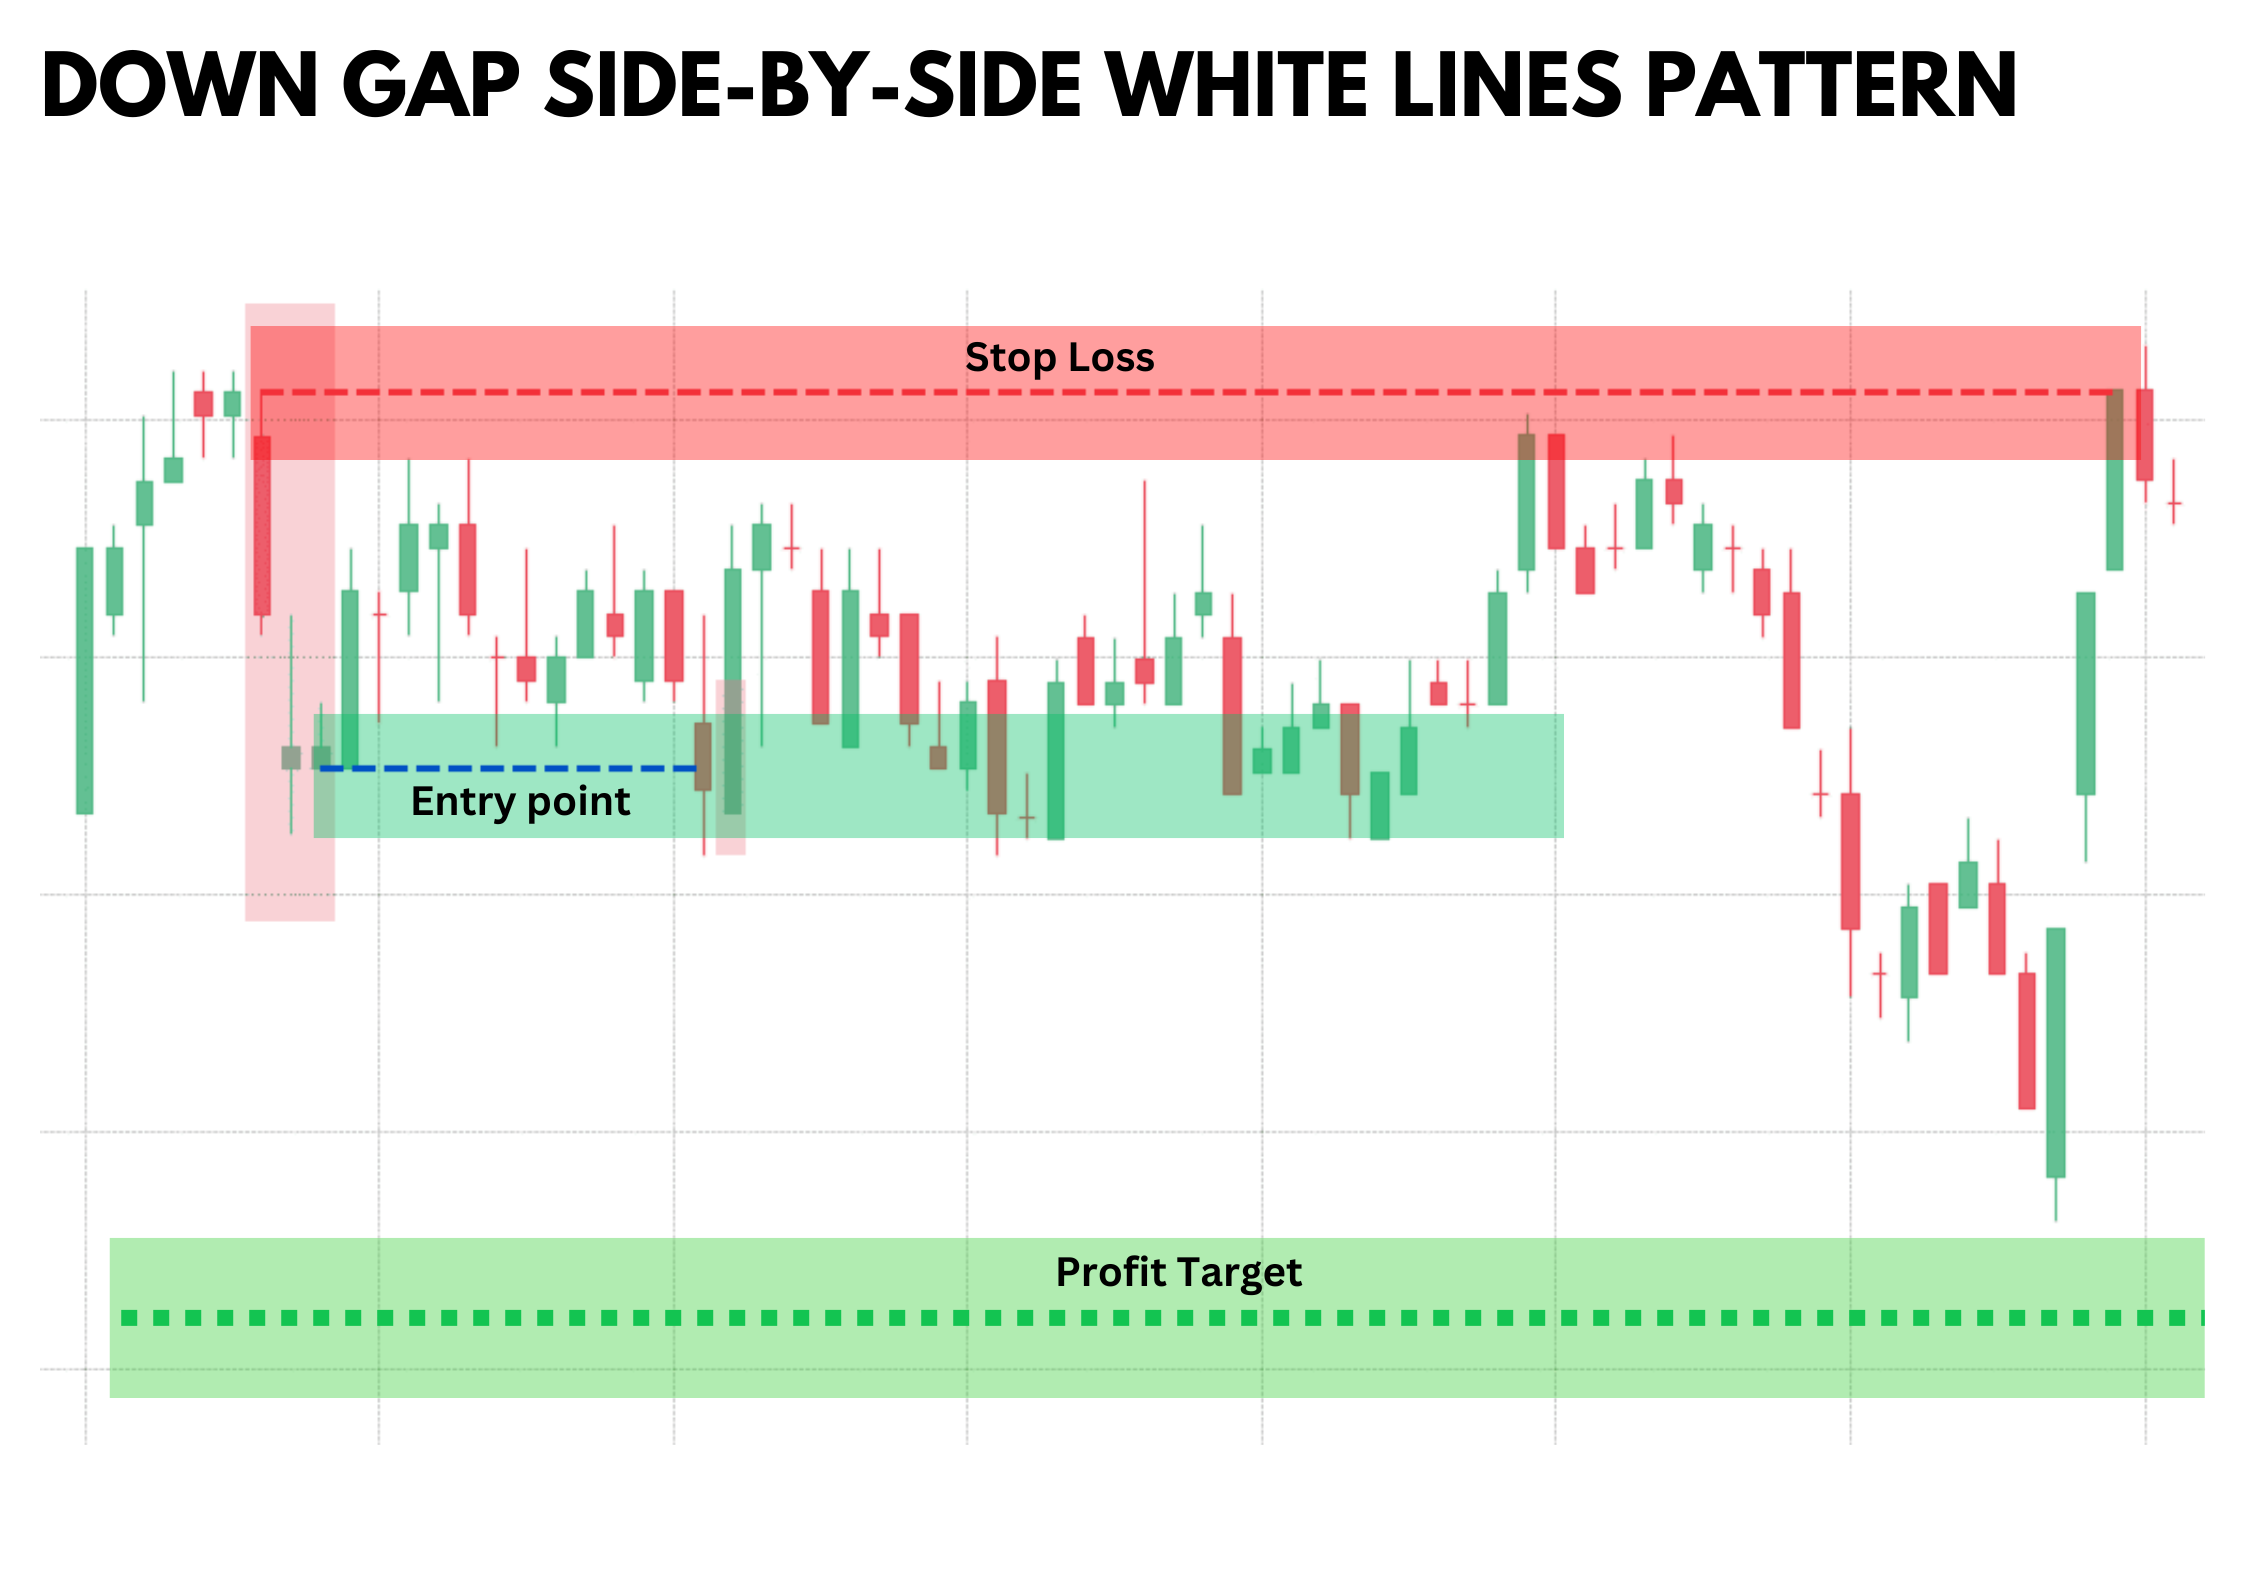
Trading the Down Gap Side-by-Side White Lines involves:
- Entry Point: Enter a short position at the close of the third candle.
- Stop Loss: Place a stop loss above the high of the first candle to manage risk.
- Take Profit: Use a trailing stop or set a target based on a prior support level or a risk-reward ratio of at least 1:2.
Pros and Cons of the Down Gap Side-by-Side White Lines
Pros
- Indicates strong bearish momentum.
- Can provide a clear entry point for short positions.
- Relatively easy to spot on charts.
Cons
- This pattern is relatively rare.
- Reliability is moderate.
- The pattern does not provide specific price targets.
Conclusion
Understanding and identifying the Up and Down Gap Side-by-Side White Lines patterns can be beneficial for Forex traders looking to capitalize on continuation trends. While these patterns provide clear entry points and indicate strong momentum, they require careful consideration of market conditions and proper risk management to be effectively utilized.
Also Read: What is the Breakaway Candlestick Pattern?
FAQs
What are the key features of the Up Gap Side-by-Side White Lines pattern?
The pattern features a bullish candle, a gap up, followed by two bullish candles with similar opening prices.
Can the Gap Side-by-Side White Lines patterns occur in any market
Yes, these patterns can appear in any market, but they are more commonly observed in markets with high volatility.
What is the main risk of trading these patterns?
The main risk is false signals, especially in highly volatile markets, making it essential to use proper risk management techniques.