
Technical analysts need to learn theories that define the cycles and structure of the stock market. At the top of the list are the Dow theory and the Elliot Wave principle. Yet it would not be a mistake if the Wyckoff method finds a place in that group. The method gets used for market analysis in every freely traded market.
In reality, different forces influence the market. The price of an asset usually moves vertically in an upward or downward trajectory, depending on the dominant forces. The key to a solid investment decision is to locate the forces that drive prices, and with that info, you can forecast the movement of the price in the future.
In financial markets, the Wyckoff method gets used to assess the connection between the factors that determine supply and demand. With that data, investors can assess the market index and estimate the market performance. The technical analysis tool was created by Richard Wyckoff, who was active in the stock exchange two centuries ago, starting his career in 1888 as a teenager stock runner.
The trading methodology of Wyckoff was based on inspecting the activates of successful investors, people that possessed relevant information’s about industry situations and had the power to influence trends.
His techniques try to ascertain the movement of smart money and locate the direction of price by using the fractal of the price range.
The individual power of brokers got diminished in today's ear of hedge funds and corporations, yet the method is the same, observe the big players in the market.
Wyckoff's method assimilates some of the best practices and formulates a chart-based method.
The theory helps traders protect themselves from fluctuations, and identify a probable future trend and price movements.
Also Read: What Is The Andrews Pitchfork Indicator?
Contents
- Rules of Wyckoff Method for Financial Markets
- Grasping the Meaning of the Wyckoff Laws
- The First Law of Demand & Supply
- The Second Law of Cause & Effect
- The Third Law of Effort & Result
- The Wyckoff Price Cycle in Freely Traded Market
- Wyckoff Trading Strategy
- How Accurate Is the Wyckoff Method in the Stock Market
- Conclusion
- FAQs
Rules of Wyckoff Method for Financial Markets
The theory Wyckoff developed is based on price action and the different cyclical stages of the market. It is essential to understand the core principle behind the Wyckoff method to be implemented in trading strategies.
- The first principle states that the market is unique, the price action will never repeat past moves.
- The second rule is connected to the first principle and emphasizes that the original nature of every price move makes it a crucial element when contrasted to the preceding conduct of the price.
Grasping the Meaning of the Wyckoff Laws
We already mention that the core idea behind the Wyckoff method is to uncover the plans of super traders on the market. Richard was convinced that the dynamic identified through volume and price movements was the determining factor in forecasting upcoming market movements.
These realizations made him formulate his set of three laws: the law of effort and result, cause and effect, supply and demand patterns.
We can explore the laws in more detail, to get a quality comprehension of the trading methodology.
The First Law of Demand & Supply
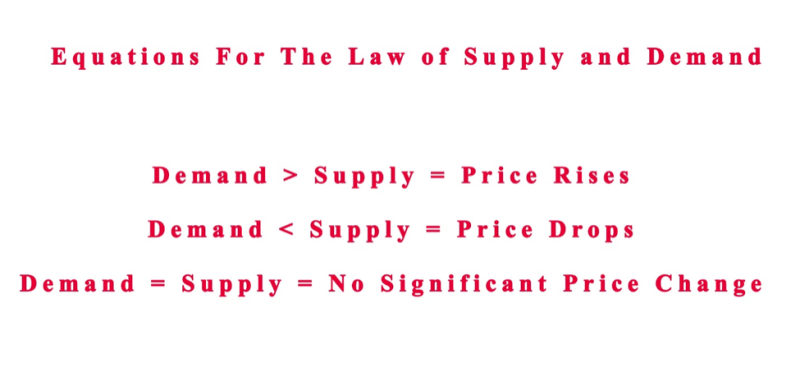
The first law states if demand exceeds supply, there will be an increase in stock prices. If the decreasing demand is lower than supply, the prices will decline. When the price rises, it signals that a large number of investors are purchasing the stock, while the decline in price signals that the market is occupied predominantly with sellers.
Wyckoff implemented a basic charting method to ascertain the results of the source. He offered practical techniques for displaying trading targets based on the extent of both accumulation and distribution periods. The outcome for traders is to decide the extension of market volume after breaking out of the period where price breakdown gets expected to pause.
The Second Law of Cause & Effect
With law number two Wyckoff’s implies, that the variation amid demand & supply is not accidental, it is guided by an underlying logic. Richard uses accumulation and distribution for his second law.
Accumulation arrives after a period of significant economic news and events. At this stage accumulation, results in a markup. In the case of the distribution stage, the price decreases, producing a markdown.
Wyckoff used an original charting method to measure the possible results of an accumulation. Richard formulated techniques of demarketing trading metrics focusing on the distribution & accumulation periods.
The law attempts to predict how the distribution and accumulation are going to turn out in the new trend. And a point and figure chart can be implemented to express a cause and predict the level of its effect.
Making it possible to calculate the potential prolongation in the trend of a market following a push out of the trading range.
The Third Law of Effort & Result
These Wyckoff law implies that trading volume is an effort the contributes to the alterations in the price of a stock. When the price action aligns with the volume, it is a solid possibility the trend will keep its course. When there is a separation by a wide margin among the price and volume, the trend is probably going to change course or stop.
For example, if hypothetically the price of Bitcoin rises and begins to integrate with a large volume following a trend of bearish nature. The volume remains high in the consolidation stage, and the price is stagnating.
Making for a large number of Bitcoin transactions, but the price is not declining. In this scenario, there is a likelihood of a swing in the current momentum.
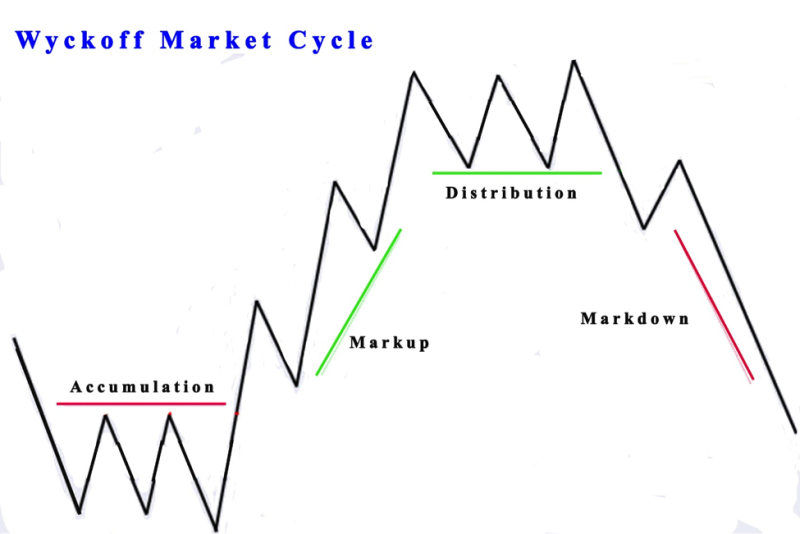
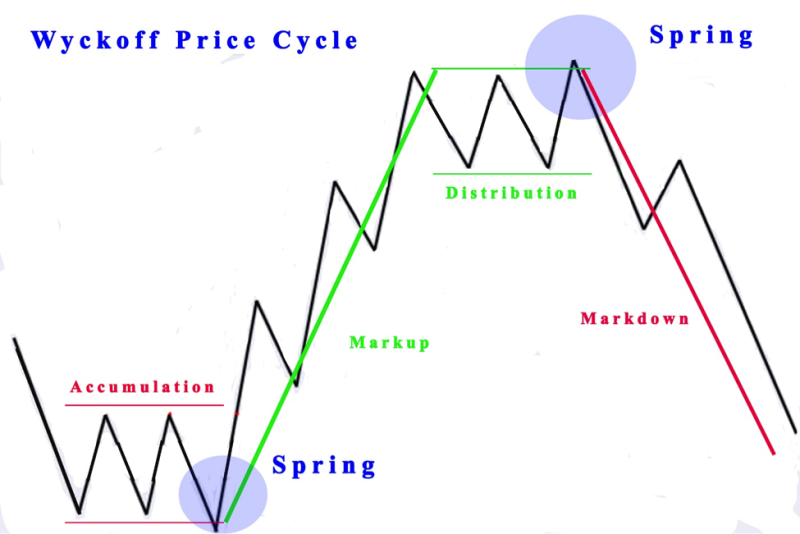
The Wyckoff Price Cycle in Freely Traded Market
Traders can expect movement in price by looking at comprehensive research of demand & supply and demand that gets achieved by looking at volume, time and price action. Wyckoff inspected the strategies of profitable traders, breaking down their tactics with different type of charts.
This technique observes how players organize and realize their plans in the bear and bull markets during price cycles. Traders need to open a buy position at the uptrend stage and sell positions at the downtrend stage.
Observe Fluctuations in Supply & Demand
In the Wyckoff method the course of the market is set concerning the demand and supply. The prices rise will continue because the interest for the asset surpasses supply. Price reverses as quickly as supply surpasses demand. Most traders have to observe the fluctuation in demand versus supply, contrasting them to volume and price over time.
The Time Frame Is an Important Element
The most crucial factor in the Wyckoff market cycle is timing. The cycle transitions from uptrend to downtrend, and the best purchasing and selling location is justifiable when the schedule is appropriate.
If the price stays in the trading range, investors can transition to a lower time frame to improve their position for joining the trade. The goal is to initiate a buy position when the accumulation has ended and a sell spot when the distribution is over.
Trading Volume
By itself, price action is not a factor to decide the possible price movement from the Wyckoff accumulation area. Bullish movement from the accumulation area or bearish movement from the distribution area is sustainable when the volume rises to a given level. Professional traders have to locate the suitable price action with an increasing volume to perceive the price movement as opportunistic.
Price Action
This method that helps to foresee the direction of the price by looking at the price. It is a practical option to forecast the movement of prices, and it works in every market. Investors use candlesticks, support and resistance, trend lines, and few other elements.
The concept is that when price breaks over the level of resistance, it has a higher chance of staying the course with its pressure of the bullish type. Within the Wyckoff market cycles, the accumulation stage depicts a range, and going out of he range with corresponding price action can signal potent bullish movement.
The Composite Man Concept
To better understand the price movement, Wyckoff proposed the Composite Man concept . The idea is for a fictional individual, that is a stand-in for powerful market players that influence the market. This heuristic device intends to enable investors to get a better perspective of the market and price moves.
Traders get advised to research the fluctuations of different stocks. By playing the Composite man, investors get an insight into the potential plans of big players that move the market.
In turn, influences trade at the expanse of smaller investors, that have not figured out the market game. Logically if traders understand the game they can play by the same rules and profit.
The goal of Wyckoff was for retail investors to act like the Composite Man. Still, the reality he encountered was the opposite. The strategy Richard proposes is predictable, but traders can still benefit from the strategy. The Composite Man idea can be used to describe a basic market cycle, that is built from four stages: accumulation and distribution processes, uptrend, and downtrend.
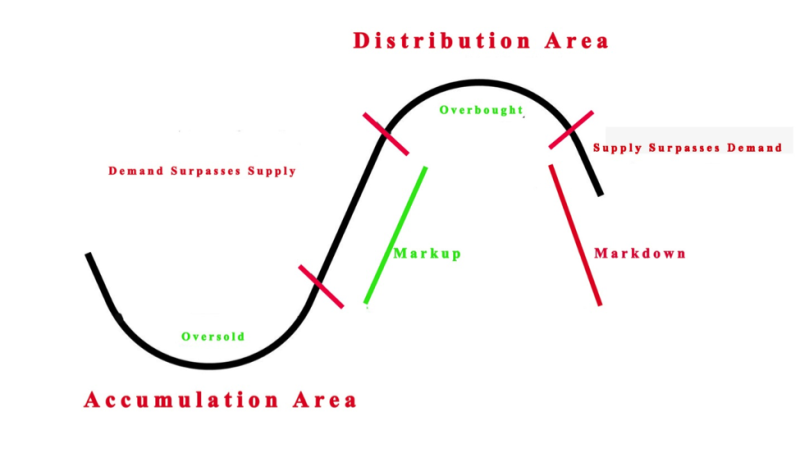
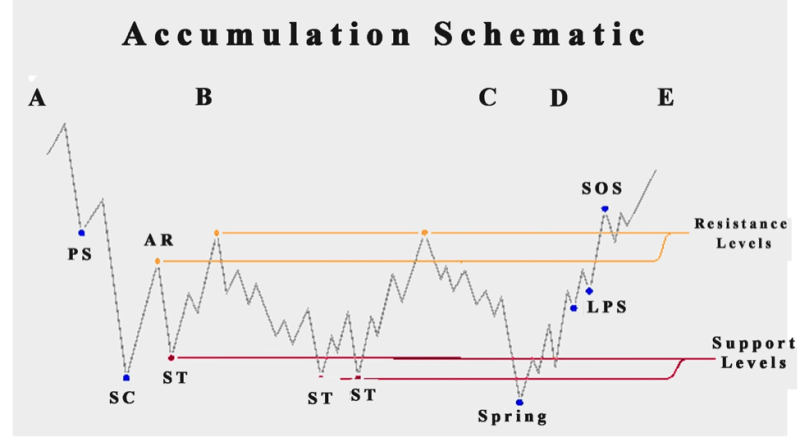
Accumulation Stage
The first phase of the cycle is a result of demand. Bulls are steadily increasing their influence. This produces a situation where they can drive the prices higher. The price action of the chart structure stays flat, even though in the accumulation stage the bull’s power is on the rise. The best signal of the accumulation phase is a rising bottom.
Uptrend Stage
If a large number of shares are in the possession of the Composite Man, and the selling pressure gets reduced, he begins driving the market up. Logically the surfacing trend appeals to more investors, resulting in a rise in demand.
In an uptrend, there are several stages of accumulation during an uptrend. It's possible for the larger trend to pause and consolidate, before carrying on with an upward movement. The uptrend of the market structure inspires traders to purchase. Causing an avalanche effect getting the public in the game and resulting in demand that can keep up with supply.
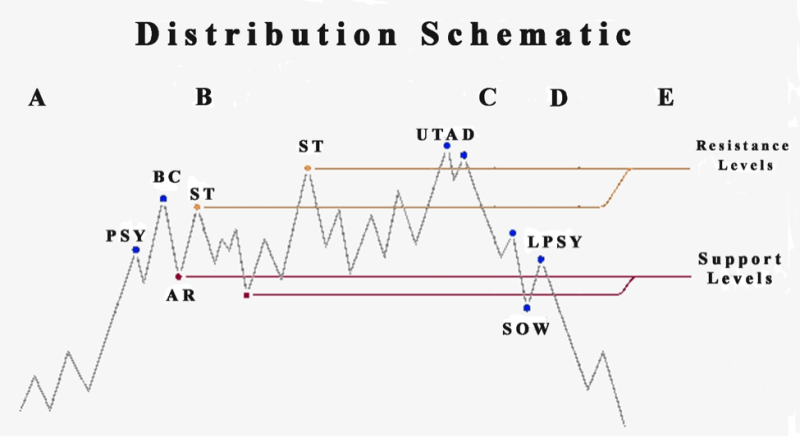
Distribution Stage
The Distribution phase is the point where bears try to take control of the market. On the charts, the price action is flat, similar to the accumulation stages.
The sure sign that the market is in a Distribution phase is the continued lack of success of the price to form higher bottoms on the chart. The price action generates lower tops, and it's a sign that the market is presently facing a selloff.
Downtrend Stage
The final phase is a downward trend, signaling that bears have assumed control, and are driving the price lower. The supply will be larger than demand, and a downtrend gets created. The verification arrives when the price action breaks under the distribution stage.
The point of any cycle is to repeat itself, and when the bearish cycle is over, the new accumulation stage begins.
Wyckoff Trading Strategy
With the Wyckoff trading method, investors can identify the present market cycle. The recognition by itself is not enough, traders have to prepare a trading strategy that will work in the price cycle.
Trade Entry
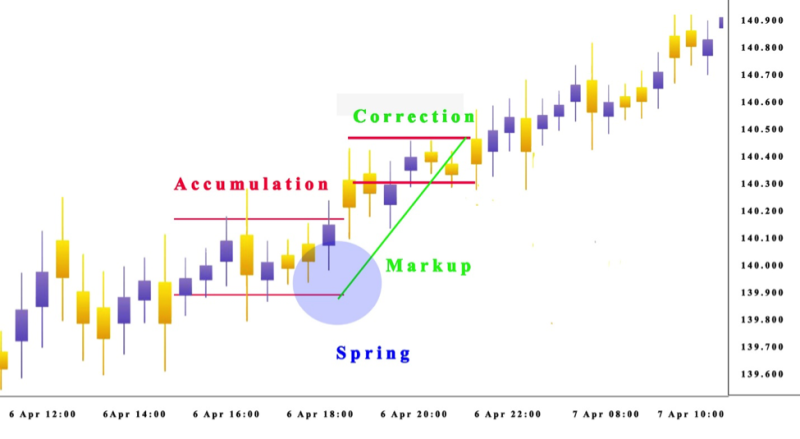
Investors need to start a trade when the price action gets moving from accumulation to uptrend and from distribution to downtrend. Initially, investors have to verify the present phase. Both can get confirmed with chart patterns. Alternatively, it can get identified with a Spring, that is the transitional price action attitude that frequently happens amid the phases of the cycle.
The trade comes when the price action breaks the range in the direction of the expected move. It's important to observe the volume for additional signals that verify the decision.
Stop Loss Order
There are no guarantees, and traders have to place a stop-loss. In an uptrend, the stop loss should get located under the lowest point of the accumulation. While in the downtrend the stop loss has to be located over the highest point of the distribution stage.
Take Profit
The investor can use price action analysis to coordinate the take profit points. One signal that the price is moving from an uptrend to distribution is the presence of descending tops on the chart. This can signal that a potential selloff is happening.
The alternative exit signal on the chart can be a bearish spring on the chart. When traders observe it, they can leave the trade, the reason is that the price action has entered the late phase of the distribution curve.
Another option to manage the exit is to observe the developing chart patterns and candlestick patterns. Seeing the reversal is an indication the price may face a correction, or there can be a shift in the trend.
A price action analysis is an excellent option to coordinate trades in the Wyckoff price cycle. Investors need to be flexible and react to the market.
Also Read: How To Use Momentum Trading
How Accurate Is the Wyckoff Method in the Stock Market
The market is not in a habit of following theoretical models. In reality, distribution & accumulation can happen in different ways. Certain situations may prevail for a longer time than expected, and some may not even materialize.
Wyckoff provides a large selection of proven techniques, that were created from different experiences and market rules. The work Richard had produced is beneficial to a large number of investors and analysts around the globe.
His schematics based on distribution & accumulation are practical in understanding the normal cycles of financial markets. The theory is useful for technical analysis but has limitations when implemented in trading.
It’s not easy to spot the accumulation and distribution phase. Traders can miss read the signals and interpret an accumulation stage as a distribution, and the opposite is possible. Meaning the market is not acting as expectedly.
Trading downtrend and uptrend is also more difficult it requires serious knowledge to trade price action patterns that emerge in those phases. Also, the possibility of a reversal in trend is bigger than the continuation. Timing entries out of accumulation or distribution phases is complicated. It can be hard to buy or sell as there are no clear positions for stop-losses.
Wyckoff’s price cycle is a fine theoretical concept, but in practice, it doesn’t stick to the rules put to paper it can take a random course.
Conclusion
Over a century has passed since Wyckoff created his method, which gets used globally even today. This is not a standard technical indicator, it’s more of a system that combines different principles and theories to explore market trends.
The point of the Wyckoff Method is to help experienced traders make educated choices instead of relying on emotions to drive their broad market performance. However, no technique offers guaranteed results, risk is present.
The price of a stock changes as a result of different factors. For some investors forecasting price, movements are fantasy, while others have built careers using chart patterns to decide if they should sell or buy.
The selling climax is created by traders surrendering their position with intense selling pressure.
The Wyckoff method can get implemented at all time frames and in every type of market. The best investment advice is to get a practical understanding of the method.
By looking at how the market moves on a price chart retail traders and institutional traders will locate the course of the market and become solid market forecaster and in turn, become successful traders. Helping to expect the changes in the market and respond appropriately at the correct moment in the markets.
FAQs
What Is Wyckoff Method?
The Wyckoff method is a five-step method of market analysis for determining the current position and possible upcoming trends of the market.
Is Wyckoff Method Effective?
The Wyckoff method is effective in recognizing price targets for long and short trades.
Does Wyckoff Method Work on Stocks?
Yes, it be used to trade stocks, and other types of assets like bonds, commodities, and currencies.
What Timeframe Is Best for Wyckoff?
Wyckoff is effective in intraday time frames and gets used in short-term, intermediate, and long-term time frames.


