Imagine you’re standing around your water cooler on a Sunday afternoon after a fishing weekend. If you had some luck, you may want to share the experience with all your friends, during which you’ll probably describe your biggest catch as being 40 inches long.
While a mere number does provide your friends with the facts, it’s still hard to grasp and visualize the size in reality. Instead, you might want to stretch your arm and exclaim, “It was this long!”
Candlesticks, also known as Japanese candlesticks, provide traders and investors the same visual context for how much a stock’s price is swinging over time. And, in today’s guide, we’re going to take an in-depth look at candlesticks and how to read them in order to create a working trading strategy.
Also Read: Day Trading Options: A Risky Yet Profitable Strategy
Contents
- What Is a Candlestick?
- The History of Candlestick Chart Patterns
- Top Candlestick Patterns Everyone Should Master
- How To Use and Read Candlestick Patterns
- What Is The Most Reliable Candlestick Pattern?
- Candlestick Patterns Vs. OHLC (HLOC) Bar Charts
- Conclusion
What Is a Candlestick?
A candlestick is a visual tool in financial markets that depicts fluctuations in a financial asset’s current and past prices. The other two kinds of visual tools that perform the same role as candlestick charts include the line chart and the bar chart.
Regarding their use, candlestick charts are used by traders in technical analysis to help predict market movements more accurately. These traders will look at the color and shape of said candlesticks to get some sense of price trends and how they form patterns in a given market condition.
Candlesticks are used in all forms of financial trading, including, but not limited to commodities, stock market, indices, and forex trading. Also worth noting, candlestick charts depict price data over a set period. This will usually range between a minute and a day, depending on the time frame selected.
Now that you know what a candlestick chart is, let’s skip to the next section of the guide and take a look at how to read a candlestick chart.
A single candlestick (be it a red candle or green candle) can be easily analyzed as follows.
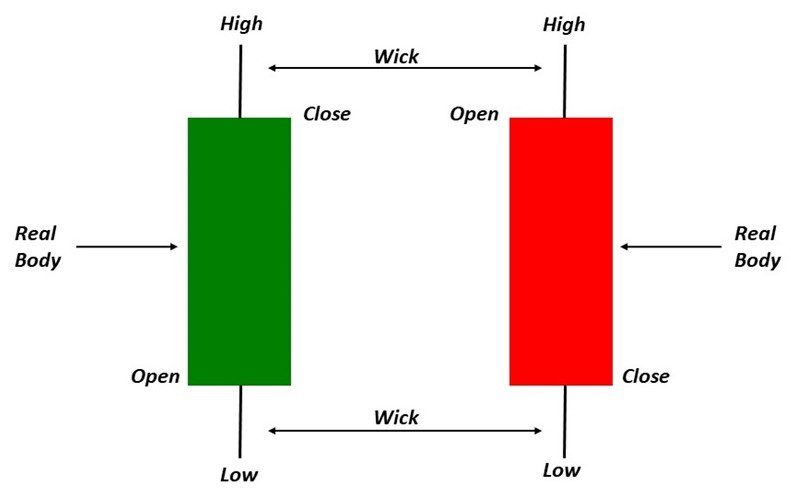
As depicted in the image above, a candlestick displays four distinct price action levels, depending on where the stock price hit during the candlestick’s session. These include the highest and lowest price points in the asset’s price, as well as the opening and closing prices. We’ll take a look at all these in detail. All you’ll need to note to learn how to read candlestick charts is that you only need the candle’s wicks, body, and color.
Let’s take a look at each one of these.
Wicks Of the Candlesticks
The wicks (aka the shadows) of candlesticks show the highest and lowest prices reached by the financial asset in the given time period that the candlestick formed. The upper shadow, also known as the top wick is the highest price while the lower shadow, also known as the bottom wick is the lowest price point.
As such, a candlestick with a short lower shadow but a long upper shadow indicates that buyers (bulls) were extremely active during the beginning of the trading period but sometime before the end of the candlestick trading session, sellers kicked in and caused a price decrease from the aforementioned high, causing the price to close lower than where the upper shadow hit. So basically, the weak closing price resulted in the upper wick.
On the other hand, a candlestick with a short upper shadow but a long lower shadow shows that sellers initially had the power to drive prices lower before buyers jumped in, bought cheap, and caused the price to recover before the candlestick closed. The evidence of the market finishing strongly in that session is evidenced by the long wick underneath.
The Candlestick Body
The candlestick’s body shows the trader the difference between the financial asset’s opening and closing prices as well as the current price as indicated by the candlestick located on the far right. These candlesticks will usually have one of two colors. If they’re green candles, then the bottom part of the candlestick represents the opening price whereas the topmost part of the body represents the closing price.
On the other hand, if what you have is a red candle, then the opposite is true. The bottommost part of the candlestick represents the session’s closing price, whereas the topmost part represents the opening price of the candlestick.
With that in mind, if the candlestick’s body is quite long, then that is an indication that the period has experienced intense buying or selling pressure. If the candlestick body is short or small, on the other hand, then it’s a signal that price action has consolidated during the formation of said candlestick.
Color of the Candlestick
As you may have denoted so far, traders use a candlestick’s color to determine the way in which the asset’s price moved previously or may be currently moving. As you’ve just seen from the images above, if the closing price is higher than the opening price, then the candle will be a green one. Conversely, whenever the closing prices are higher than the opening prices, the candlesticks are red.
This means you can use the shade of the most recent candlesticks as a great indicator of whether the financial market you’re tracking is denoting bearish or bullish signals during a given period.
When you’re tracking candlestick charts, the candlesticks on the far right represent the most current or newest trading periods while the ones on the far left represent the oldest trading periods. Another thing worth noting while learning how to read candlestick charts; the current candle on the price chart will be moving because the session is yet to deplete, which, in turn, implies that you may also notice the candlestick’s color shifting from red to green or vice versa as the price changes before the candlestick period is over.
Some other traders prefer having their candlestick charts filled and not filled instead of red and green. A black or filled candlestick is similar to red candlesticks while white or unfilled candlesticks are similar to green candlesticks.
Here is a real example from the stock markets:
On April 20, 2020, 3M’s stock opened at $144 and closed at $143.66 per stock. On the daily candlestick chart, those two price points make up for the candlestick’s body. Also, since the price traded closed lower than it opened, the candle will be red.
What’s more? On the same day, the highest price the price hit was $147.03, which resulted in an upper shadow to that price point. The lowest price point during that same session was $143.66, which also happens to be the closing price. As such, there wasn’t a lower shadow that formed on that day.
The History of Candlestick Chart Patterns
The history of the candlestick as well as its chart patterns can be traced back to the mid-18th century. In around 1750, Munehisa Honma, a rich merchant from Sakata, Japan, invented the Japanese candlesticks to start gauging the potential price of rice before committing to any specific rice contract.
Over time, this Japanese businessman discovered that even rice followed certain price patterns and that the specific price movements varied depending on supply, demand, and market sentiment. Today, the same system Honma created is widely used in every financial market. There, investors, intraday traders, and other market participants use past price movements and candlestick chart patterns to predict possible price declines or inclines as well as the performance of a particular security.
Here are the 9 top candlestick chart patterns you’ll need to master to effectively master Japanese candlestick charting techniques.
Top Candlestick Patterns Everyone Should Master
In the forex market, there are between 38 and 45 candlestick patterns one can use to predict price movement. The ones we’ll look at today are arguably the most effective as tried and tested by seasoned traders throughout history.
As you’re about to see, we’ve separated most candlestick patterns into bearish and bullish. Bearish patterns indicate that price is likely to fall whereas bullish ones signify that price is about to rise.
-
Bearish Three Line Strike
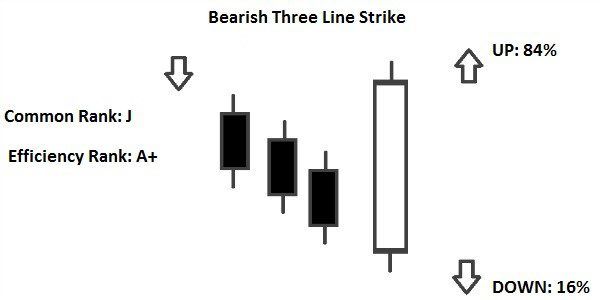
This is one of the most successful trading strategies out there. The candle pattern begins with a strong bearish candle. This is then followed by three small bullish candles that make upward progress but still remain within the limits of the strong bearish candle.
The bearish candlestick pattern then completes when the fifth candlestick makes another huge downward move. It signifies that selling pressure has kicked back in and prices are likely to keep dipping moving forward.
-
Bullish Three Line Strike
Also known as the bullish rising three, this pattern is the opposite of the bearish alternative we just looked at. The pattern begins with what traders call the “long white day.” In the next three trading sessions, small real bodies move the price lower but remain within the limits of the first, long bullish candle.
If the fourth-day candlestick is another long white day, then it's confirmation that a bullish trend may be incoming.
-
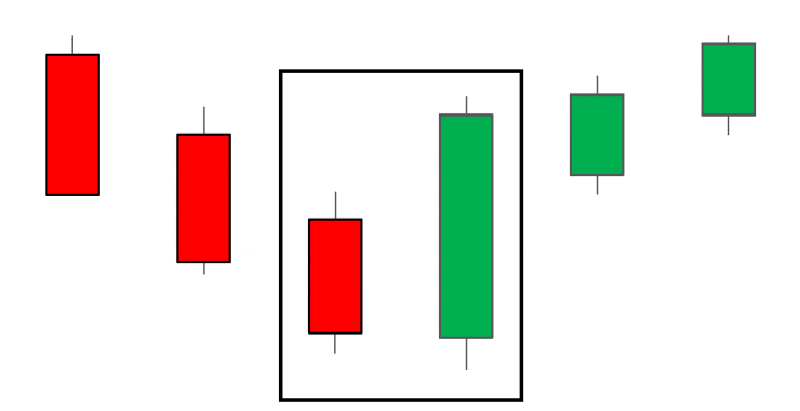
Bullish Harami
The bullish harami appears when a downtrend is in play and an extremely small green candle is inside a large red one from the previous day. This candle represents an upcoming pause in the trend, which traders and investors can use as a confirmation for their bullish bias.
If the bullish harami is followed by bullish candles over the coming days, then it's a further sign that the market could be indeed gearing for an uptrend.
-
Bearish Harami
The bearish harami is the opposite of the bullish harami. This bearish reversal pattern is represented by a small red body that appears completely inside the last day’s candle’s real body. Like the bullish harami, the bearish harami isn’t necessarily a signal that you should act on right away.
All the bearish candle pattern shows at that point is that indecision is manifesting among buyers. As such, just wait to see how the price plays out in the coming days. If the uptrend resumes, then chances are it was a false signal. If the bearish harami is followed by a down candle, however, you can expect a further decline.
-
Bullish Engulfing Pattern
A bullish engulfing candlestick pattern appears when buyers in the market outpace the sellers. This is usually reflected in the long green candle whose real body has engulfed that of the previous red candle. With the buyers having established control at that point, the price can be expected to push even higher.
-
Bearish Engulfing Pattern
The bearish engulfing pattern establishes itself during an uptrend when selling pressure overcomes buying pressure. This action is usually reflected by an extremely long red engulfing candle that fully encompasses the previously green real body.
The pattern indicates that sellers have started establishing control and that there could be an upcoming price reversal.
-
Doji Candlestick
Doji candlestick patterns look like a cross or star, which is supposed to show indecision in the market. They appear when the asset’s price opens and closes almost at the same price point, meaning that the candlestick won’t have any body.
-
Spinning Tops
Spinning Tops are almost exactly like Doji candlesticks, the only difference being that spinning tops have a slightly bigger body and long shadow. The body is extremely small compared to the shadow, but it’s still there nonetheless.
When a spinning top appears at the bottom of a bearish trend followed by a bullish candlestick on the following day, then it's called a morning star pattern. This, like most others we’ve looked at today, is thought of as a sign of hope.
Conversely, if the spinning top candlestick appears at the topmost point of an uptrend followed by a decline the following day, then it’s called an evening star. This is taken as a sign of an upcoming price reversal.
-
The Hanging Man
The hanging man, also known as a hammer candlestick pattern will usually happen at the bottommost point of a downtrend. Here, the candlestick bears an extremely small body with a long shadow below. It’s just like the spinning top. The only difference here is that the hanging man doesn’t have a wick at the top.
An inverted hammer is the same as the hanging man, but upside down. Inverted hammers or regular hammers at the top of an uptrend signal that a bearish trend could be beginning. At the bottom of a downtrend, they’re also considered a reversal signal.
How To Use and Read Candlestick Patterns
All the distinct parts of candlestick patterns tell you something. Exactly what they’re communicating, however, is an entirely distinct question. At times, the direction, color, and shape of the candlestick patterns will appear random, but other times (most of the time, actually), they’ll form a discernable pattern.
A major example of such outlines that candlestick patterns can reveal include support and resistance levels, which are valuable to traders who’d like to confirm their biases regarding price movement. That said, it’s also worth noting that there is a lot of data that candlestick patterns cannot tell you. For instance, you cannot use a candle pattern to understand the reason why close and open prices are different or similar.
With that in mind, only use candlestick patterns in conjunction with other forms of trading patterns and technical or fundamental analyses to confirm your suspicions of the overall trend.
Also Read: The Ultimate Rounding Bottom Pattern Strategy Guide
What Is the Most Reliable Candlestick Pattern?
No single trading strategy can perfectly predict the future price movement of a financial asset. However, according to Thomas Bulkowski in the Encyclopedia of Candlestick Charts, the most reliable candlestick pattern is the three-line strike. This formation consists of a three candle pattern, where the first candle, the second candle, and the third candle all are of the same color. These should then be followed by a candlestick of the opposite color that engulfs all the previous three. So basically, if the stock market experiences three straight days of losses then the fourth one regains all the losses, it’s a bullish engulfing pattern (aka bullish three-line strike.)
While this candlestick pattern is the most reliable according to Bulkowski, it’s still only correct approximately 65 percent of the time when giving bullish engulfing candlestick signals and 67 percent when giving off bearish engulfing signals. It’s also one of the rarest in the financial markets, so that limits its usefulness as well.
Candlestick Patterns Vs. OHLC (HLOC) Bar Charts
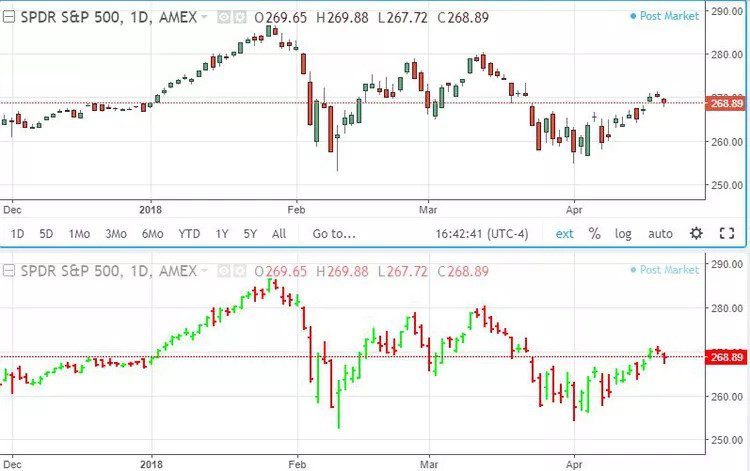
Candlestick graphs are similar to OHLC bar charts in that bar charts also have high and low prices indications as well as open and close spot indications. Both charts are also technical analysis indicators, and both need a specific understanding of dynamic trading strategies to use and analyze effectively.
The key difference between what a candle represents and an OHLC chart is that the latter lays out price data without using a “body” as seen in candlestick charting.
Most traders prefer the aesthetics of candlestick patterns while you’ll come across traders who prefer the simplistic nature of OHLC charts over candlesticks. Some will even claim that a candlestick pattern offers better clarity. I’d suggest testing them both out and sticking with the one you prefer. After all, they both indicate the same thing, the highest and lowest prices, as well as opening and closing prices for the asset in the particular time frame.
Conclusion
While appealing for many reasons, automated trading systems shouldn't be used in place of conservatively executed trading. Because technological failures can occur, these systems do need to be monitored. Traders looking to reduce the risks of mechanical issues may find a solution in server-based platforms. Remember that you should have some trading knowledge and experience before using automated trading systems.
If you want a method that enables you to trade in accordance with predetermined parameters, automated trading can be the best option for you. This is especially useful when attempting to avoid trading emotionally. For those looking for a minimal maintenance trading approach that makes use of cutting-edge technology, automated trading is a realistic option.