When you are into Forex trading, understanding and recognizing various chart patterns is crucial for making profitable trades. One such pattern that traders often look for is the Bearish Quasimodo Pattern. This pattern, known for its reliable reversal signals, can be a valuable tool in a trader's arsenal.
The Bearish Quasimodo Pattern consists of a sequence of price movements: a higher high, followed by a lower low, then another higher high, a lower high, and finally, a lower low, creating a distinctive “V” shaped swing low. Recognizing this pattern involves looking for a prevailing uptrend that begins to break down, signaling a potential trend reversal.
What is the Bearish Quasimodo Pattern
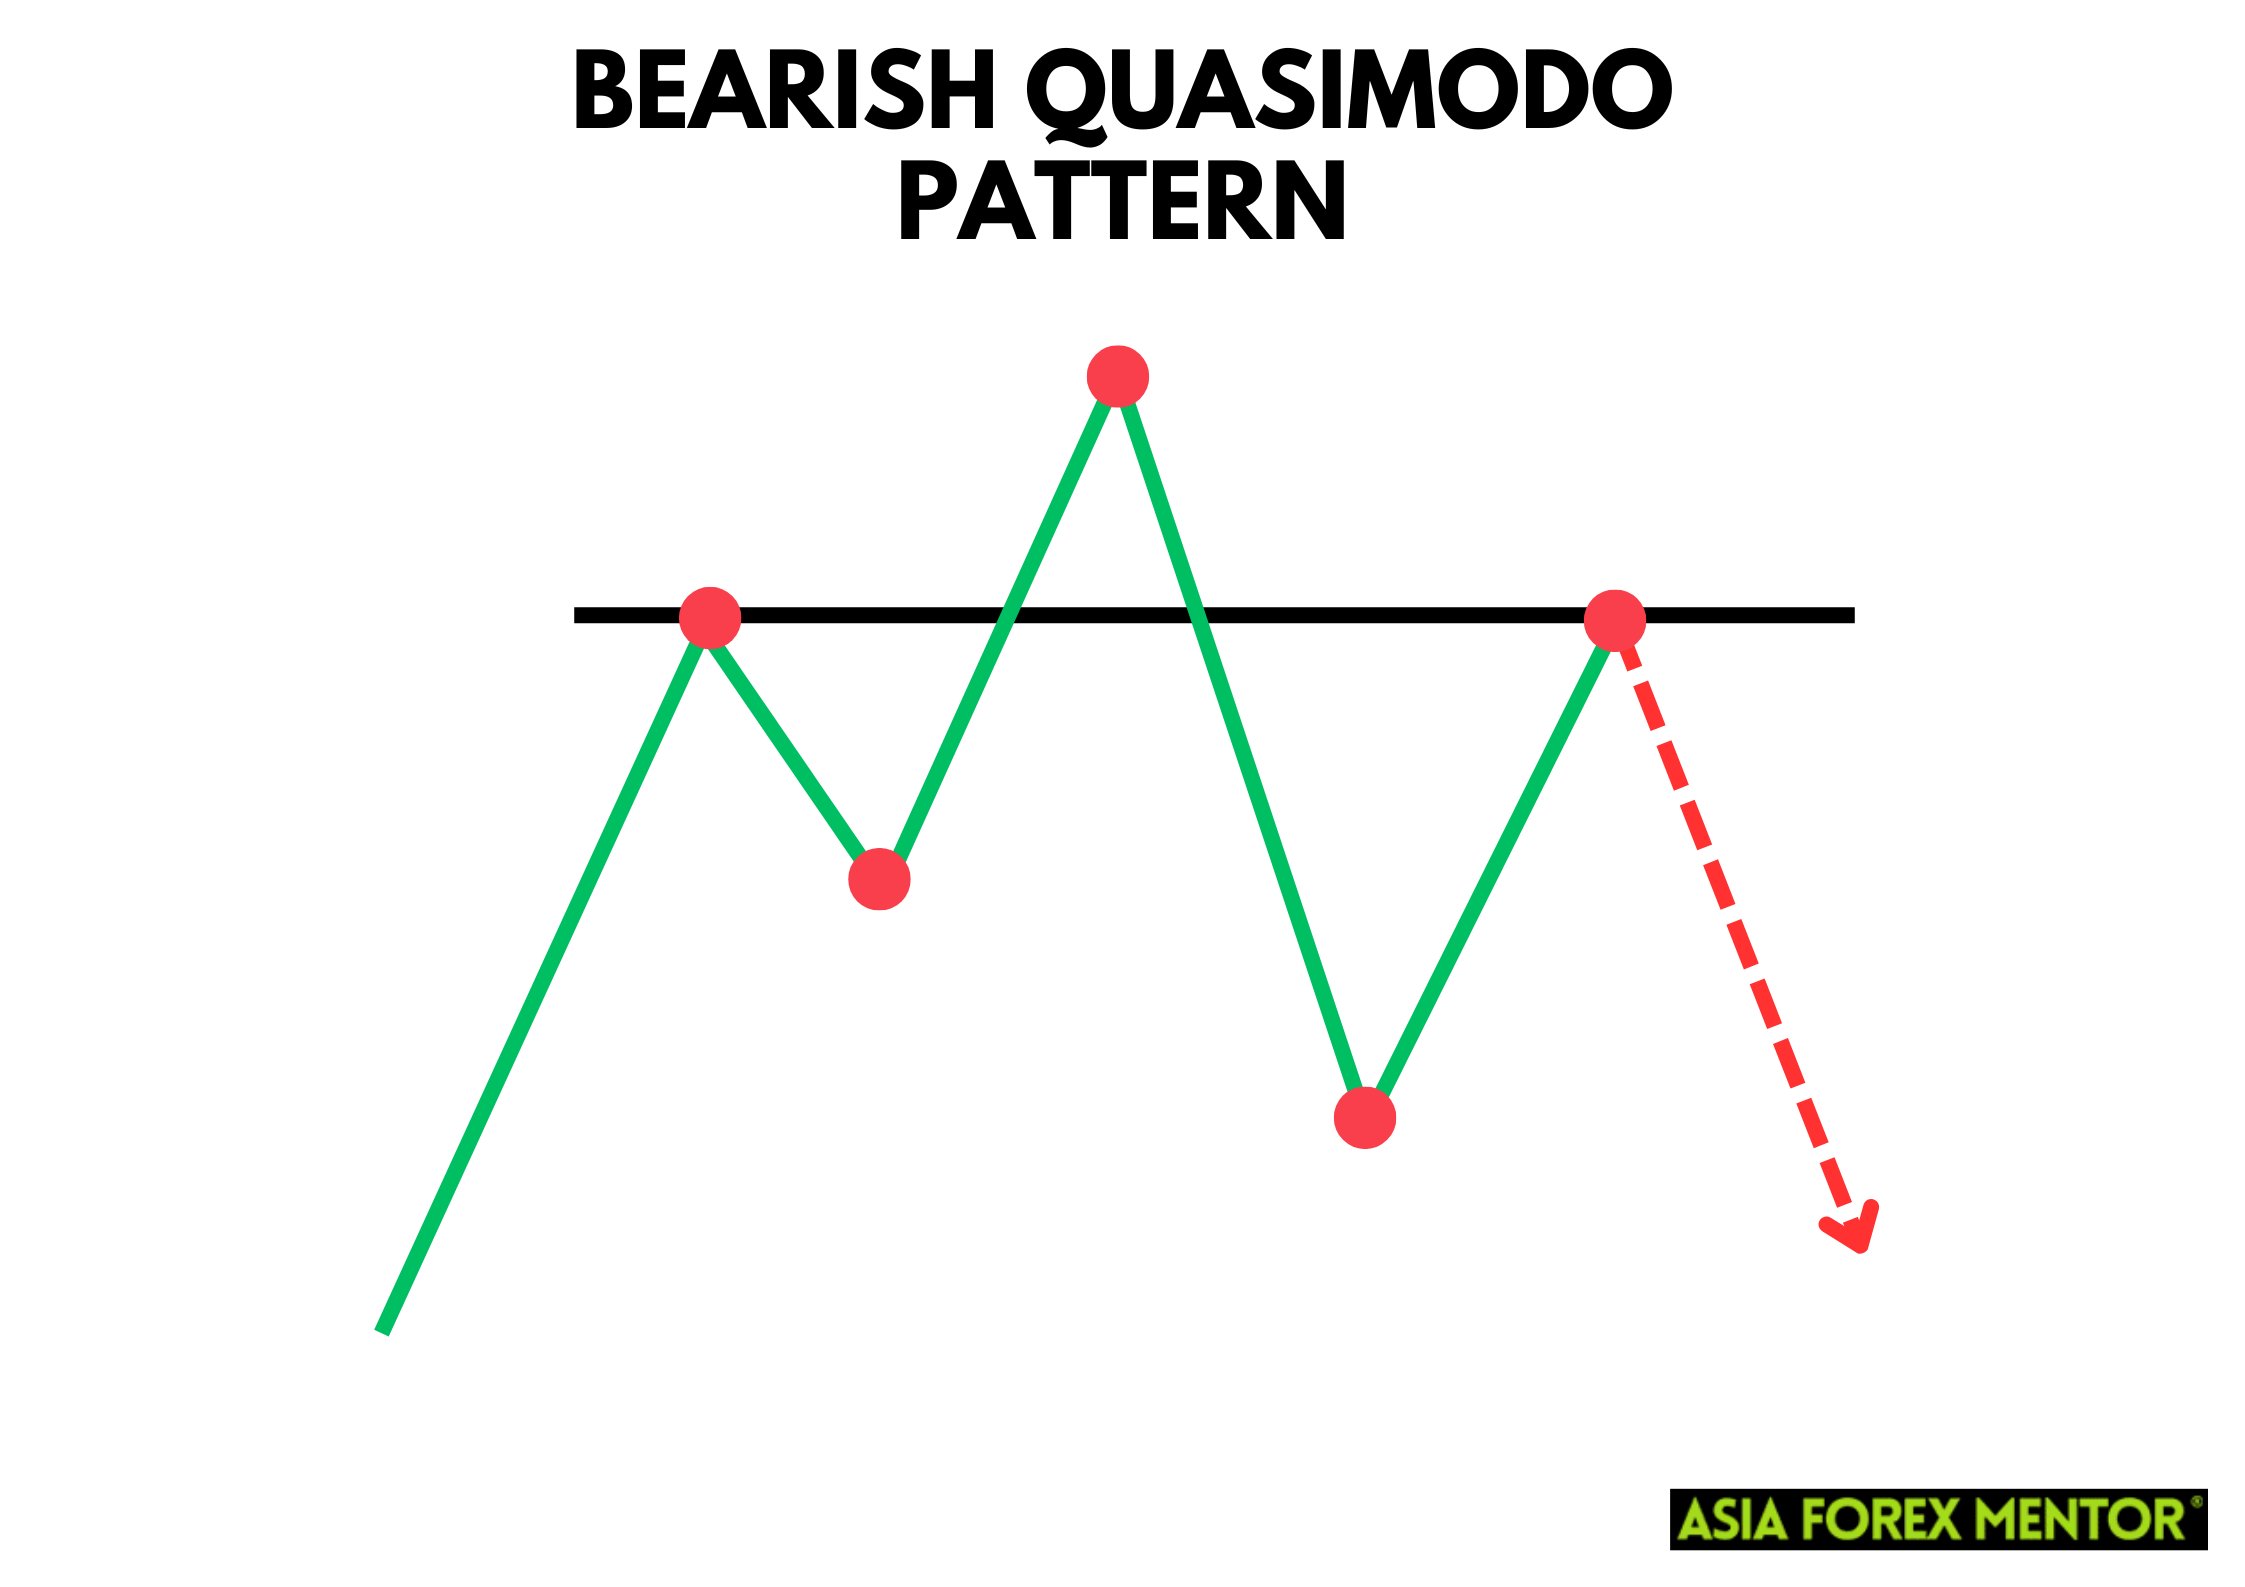
The Bearish Quasimodo Pattern, often referred to as the Quasimodo Chart Pattern or Quasimodo Trading Strategy, is a powerful reversal pattern signaling a potential bearish trend reversal. Named after the hunchback character Quasimodo from Victor Hugo's novel, “The Hunchback of Notre-Dame,” this pattern features a distinctive shape that resembles a hunched figure. It is especially favored among traders for its reliability in indicating that a bullish trend is weakening and a bearish reversal is likely imminent. This pattern is considered one of the more advanced yet highly effective reversal patterns in technical analysis.
The pattern comprises five key points: a higher high, followed by a lower low, another higher high, a lower high, and finally, a lower low. This series of movements creates a “V” shaped swing low in the middle, serving as a reliable signal for trend reversals. The higher high and lower low combination marks the initial signs of a weakening uptrend, while the subsequent lower high and lower low confirm the bearish reversal. Recognizing and trading this pattern involves looking for these specific price movements and often incorporating indicators like the Fibonacci retracement tool to pinpoint precise entry and exit points, enhancing the pattern's effectiveness in real trading scenarios.
Also Read: Everything About Fibonacci Retracement
How to Spot the Bearish Quasimodo Pattern
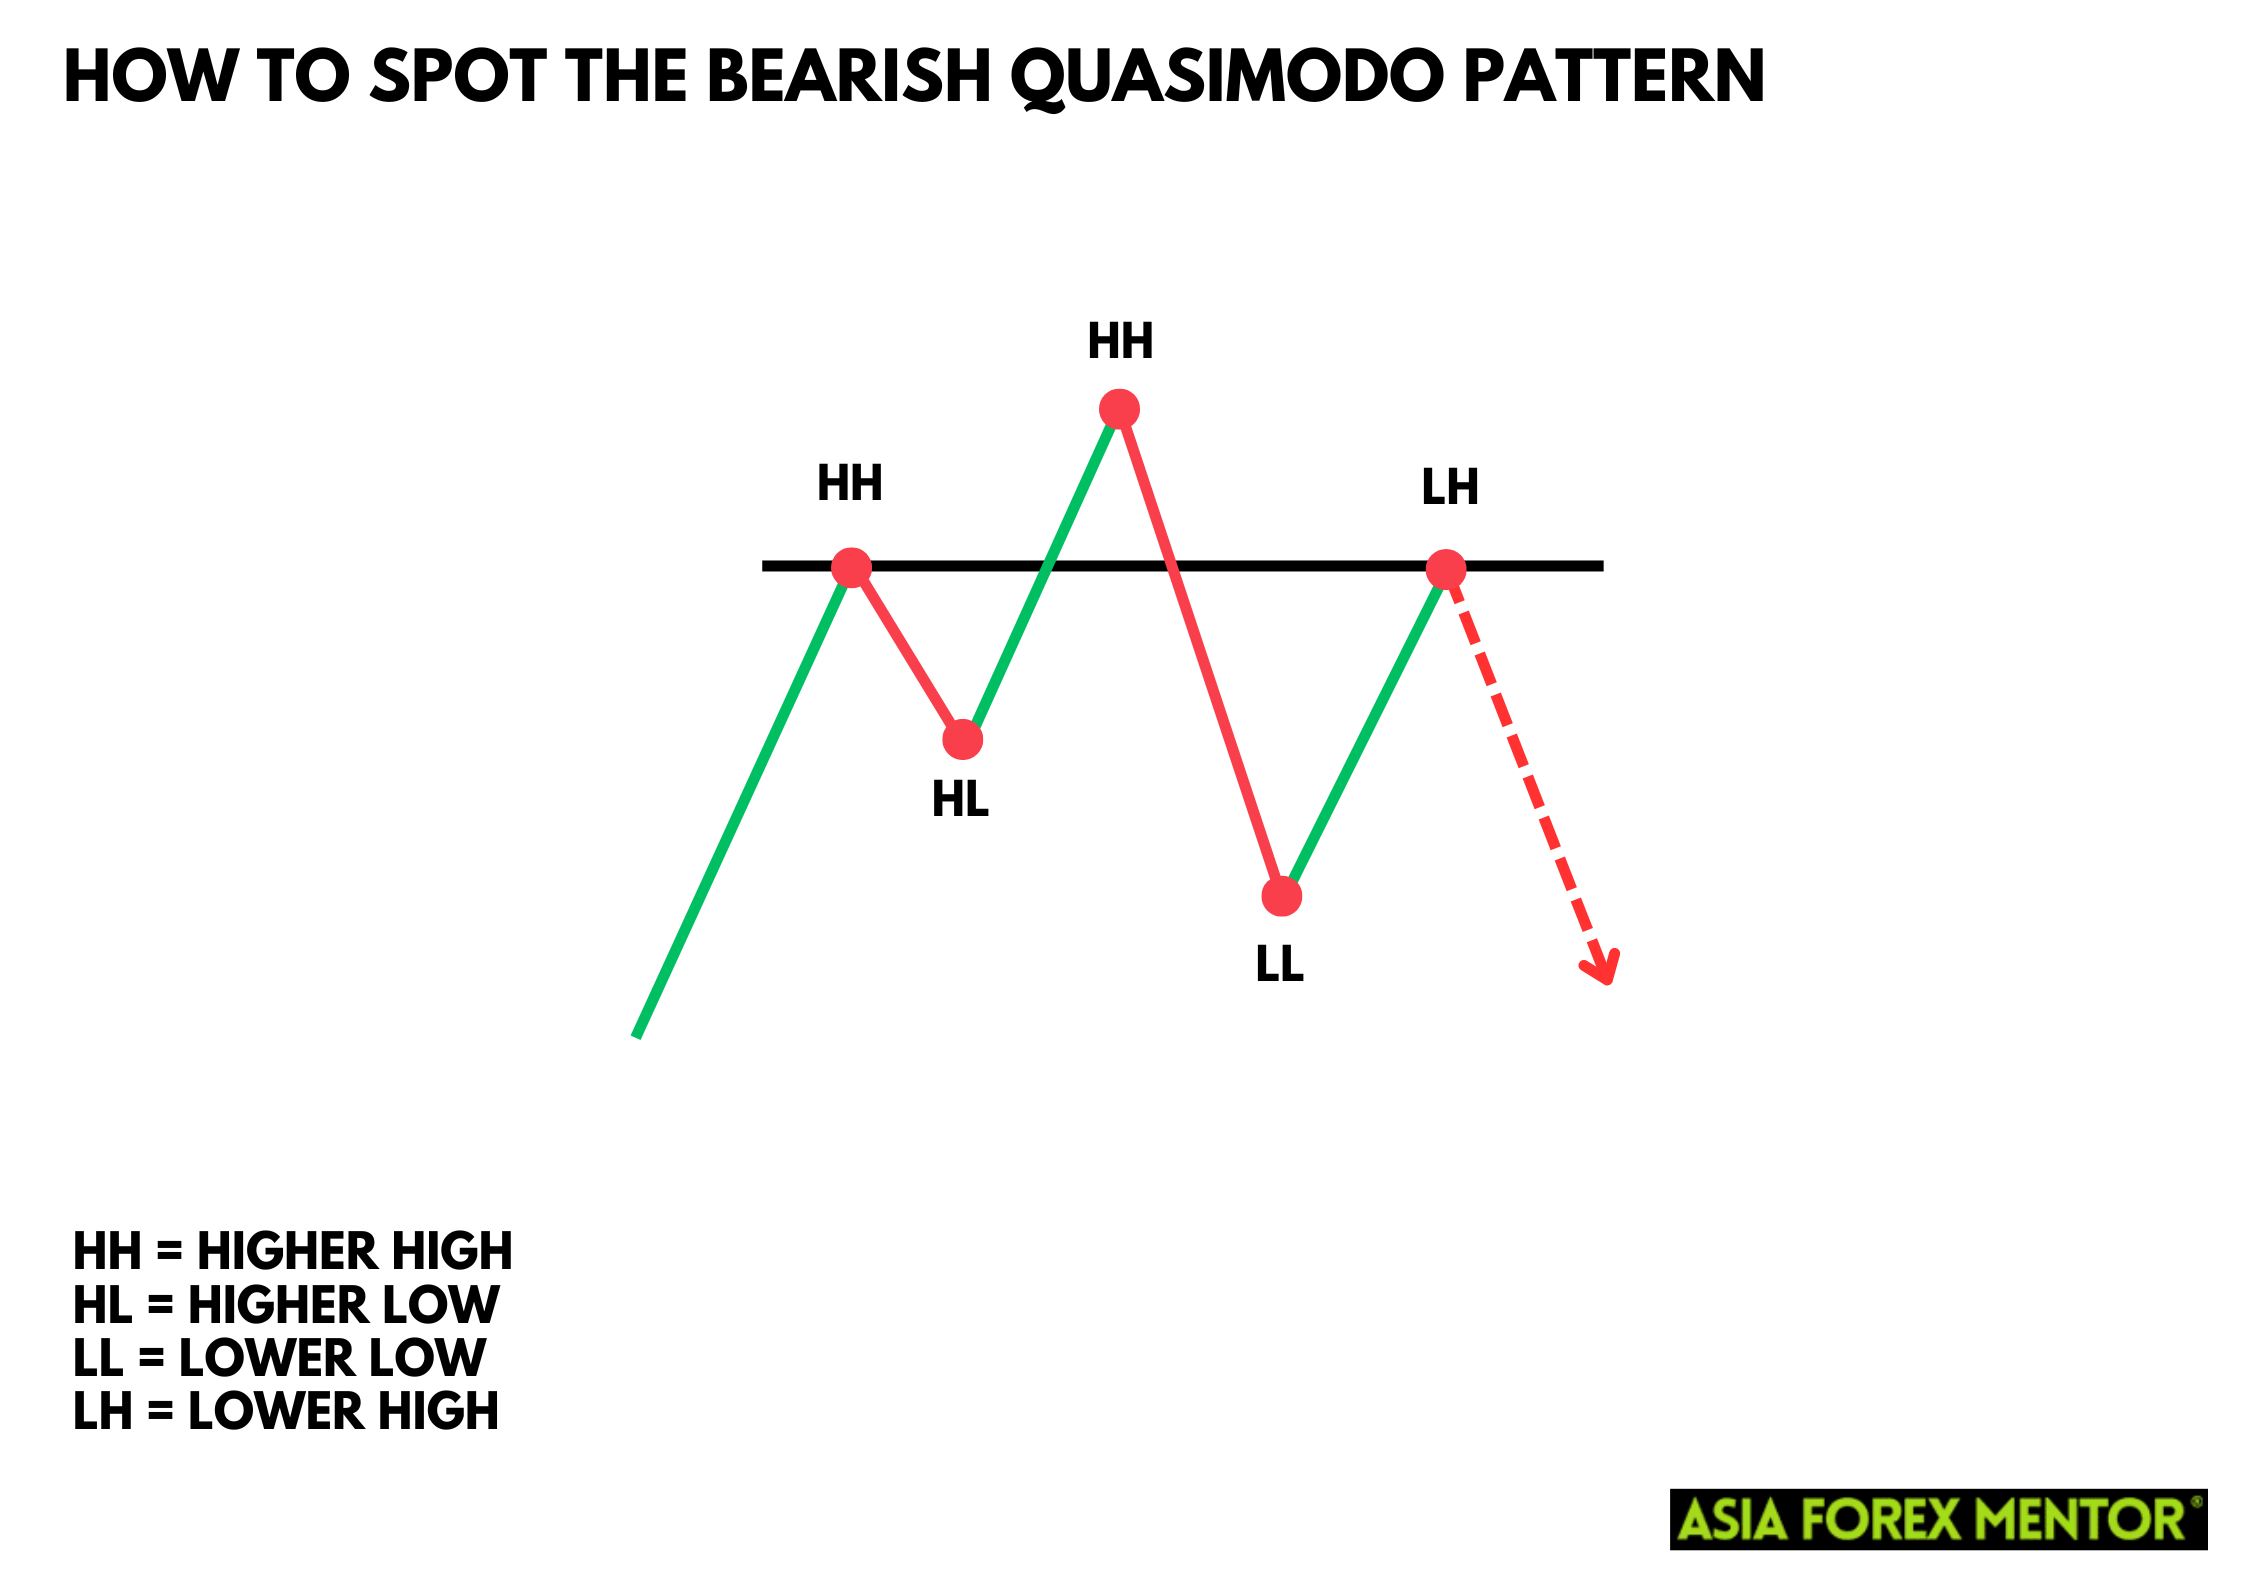
Identifying the Bearish Quasimodo Pattern on a price chart requires a keen eye for detail. Here’s how you can spot it:
- Higher High: Look for a peak in the price chart that surpasses the previous high, indicating bullish momentum. This initial move suggests a strong uptrend, setting the stage for the pattern.
- Lower Low: After the higher high, the price should create a swing low that is lower than the previous low. This breaks the market structure and signals the first sign of a potential reversal.
- Another Higher High: The price then rallies to form another high, which is higher than the previous peak. This second peak reinforces the bullish sentiment but also sets up the next critical point of the pattern.
- Lower High: The price drops again but forms a high that is lower than the previous peak, indicating weakening bullish momentum. This lower high is crucial as it signals the fading strength of the uptrend.
- Lower Low: Finally, the price creates another low, which is lower than the previous low, confirming the bearish reversal. This final point solidifies the pattern, indicating a shift from bullish to bearish sentiment.
To trade the Bearish Quasimodo Pattern, traders should watch for these specific movements and use additional tools like the Fibonacci retracement indicator and moving averages to confirm the pattern.
How to Trade the Bearish Quasimodo Pattern
Entry Point
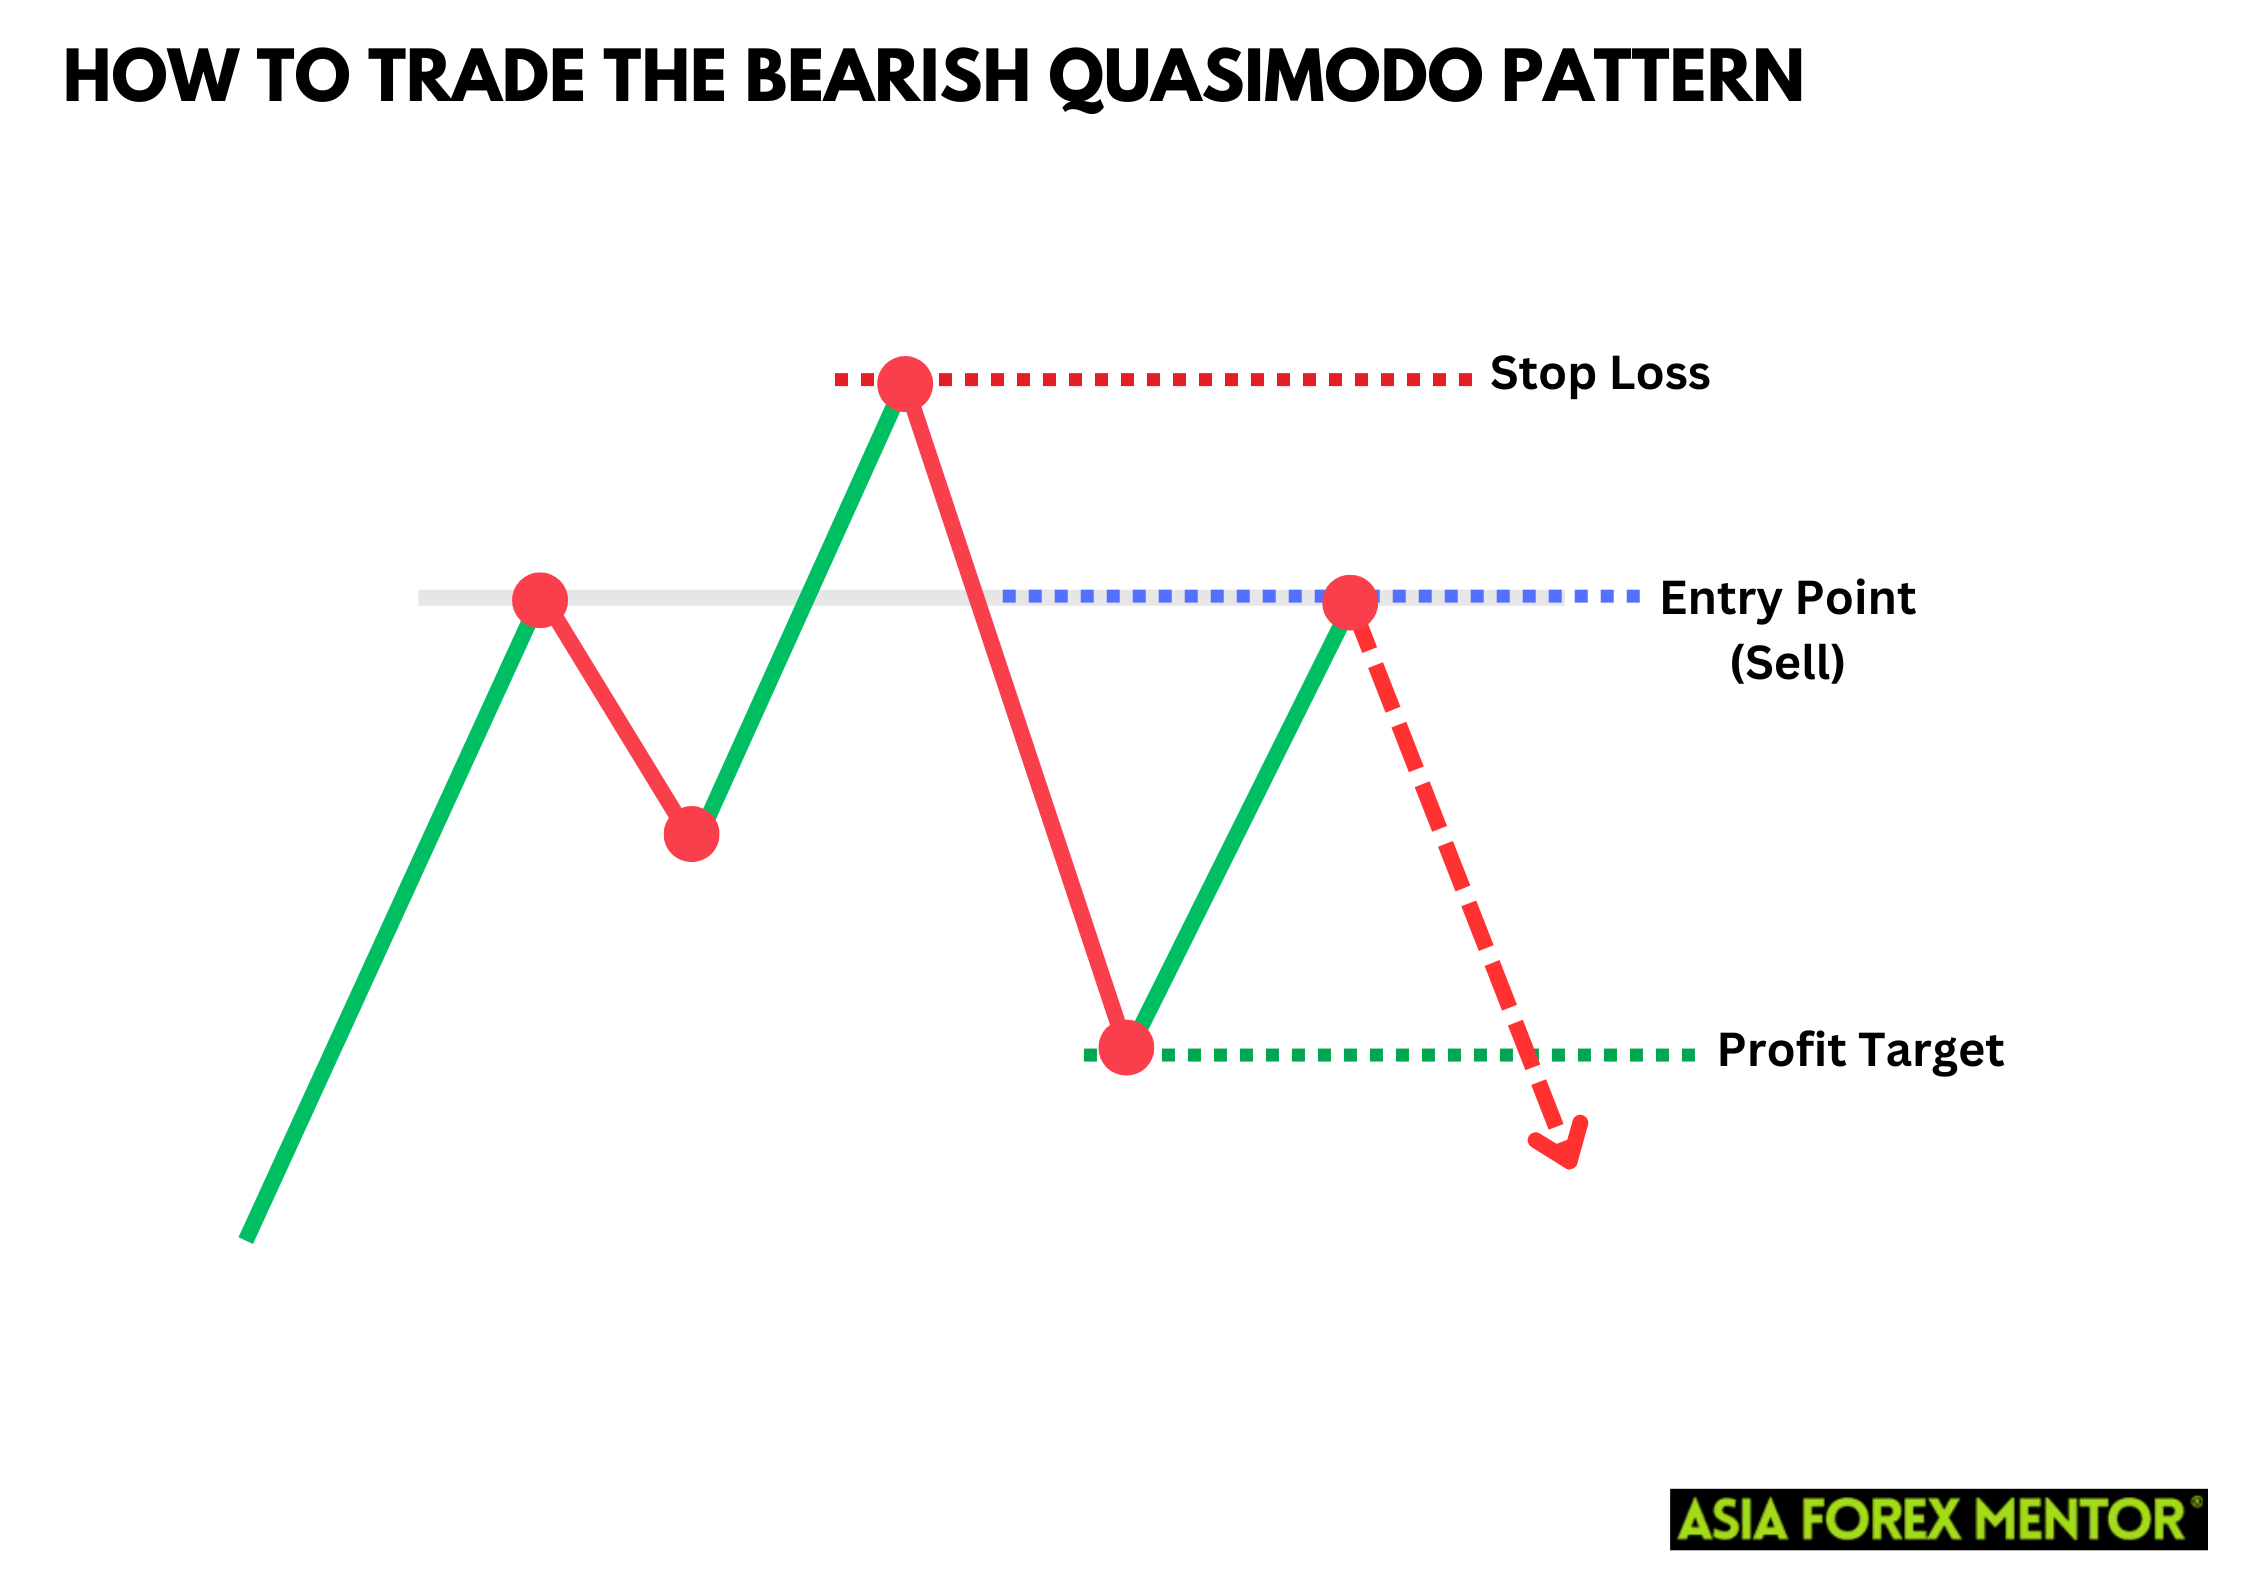
The ideal entry point for a Bearish Quasimodo trade is when the price breaks below the most recent swing low (point 5). This break signifies that the bearish reversal is in effect, and the price is likely to continue downward. Traders should ensure this entry point is backed by confirmation from other indicators or price action signals, such as a bearish candlestick pattern or a break in a support level. Using the Fibonacci retracement tool can also help identify significant levels where the price might react, providing further validation for the trade. This strategic approach ensures that traders are not entering trades prematurely and are waiting for clear signals that the trend reversal is confirmed.
For novice traders, it's crucial to incorporate multiple confirmation signals before entering a Bearish Quasimodo trade. Combining indicators such as the Relative Strength Index (RSI) to check for overbought conditions, or moving averages to confirm the trend direction, can significantly enhance the reliability of the trade setup. Additionally, observing volume patterns can offer insights into the strength of the price movement. By waiting for these confirmations, traders can mitigate the risk of false breakouts and increase the likelihood of entering a profitable trade.
Stop Loss
Setting a stop loss is crucial to manage risk when trading the Bearish Quasimodo Pattern. By placing the stop loss slightly above the lower high (point 4), traders can protect themselves against false breakouts. This strategic placement ensures that if the market moves against your position, the loss will be minimized, allowing you to exit the trade before significant damage occurs. This method leverages the natural resistance created by the lower high, offering a safety buffer against unexpected price movements. Risk management is a cornerstone of successful trading, and properly set stop losses are a critical component of this practice.
Profit Target
Determining the profit target for a Bearish Quasimodo trade involves measuring the distance from the highest high (point 1) to the lowest low (point 2) and projecting this distance downward from the entry point. This method helps traders set realistic and achievable profit targets by using the pattern's inherent price movements. By applying this technique, traders can better gauge the potential price range that the market might cover during the bearish reversal. Incorporating tools like the Fibonacci retracement indicator further refines these targets, offering additional levels where the price might find support or resistance, thereby enhancing the precision of the profit-taking strategy.
Using the Fibonacci retracement indicator, traders can identify key levels such as the 50%, 61.8%, and 100% retracement levels, which often align with significant support or resistance points. These levels provide clear profit targets where traders can anticipate potential market reactions. For example, if the price reaches the 61.8% retracement level, it may encounter significant support, prompting traders to secure profits. This approach ensures that profit targets are not only based on the price structure of the Quasimodo pattern but are also reinforced by widely recognized technical analysis tools.
Pros and Cons of the Bearish Quasimodo Pattern
Pros
- High reliability in trend reversals
- Clear entry and exit points
- Effective risk management with stop-loss
- Can be used in various markets
- Provides strong risk-reward ratio
Cons
- Requires experience to identify accurately
- Can be confused with similar patterns
- Risk of false breakouts
- Needs confirmation from additional indicators
- Not suitable for short-term trading due to complexity
Indicators to Use to Confirm the Pattern
To increase the probability of success, traders often use indicators to confirm the Bearish Quasimodo Pattern. Some useful indicators include:
Fibonacci Retracement Tool
The Fibonacci retracement tool helps identify potential support and resistance levels, which are critical in setting entry and exit points for trades. By marking key Fibonacci levels, such as the 38.2%, 50%, and 61.8% retracement levels, traders can determine areas where the price might react. These levels provide a framework for predicting where the price might reverse, adding confidence to the bearish trend reversal signaled by the Quasimodo pattern. Utilizing the Fibonacci retracement tool ensures that profit targets and stop losses are strategically placed based on historical price movements and natural market tendencies.
Moving Averages
Moving averages are another essential tool for confirming the trend direction when trading the Bearish Quasimodo Pattern. By analyzing different moving averages, such as the 50-day and 200-day moving averages, traders can observe the overall market trend and validate the reversal pattern. When a shorter-term moving average crosses below a longer-term moving average, it indicates a bearish trend, supporting the Quasimodo pattern's signal. This confirmation helps traders enter trades with greater confidence, knowing that the market sentiment aligns with their bearish outlook. Moving averages also smooth out price data, making it easier to spot the underlying trend and reducing the noise from short-term price fluctuations.
Relative Strength Index
The Relative Strength Index (RSI) is crucial for indicating overbought or oversold conditions, which can validate the Bearish Quasimodo Pattern. When the RSI shows an overbought condition (above 70), it suggests that the price may be due for a correction, aligning with the bearish reversal signal of the Quasimodo pattern. Conversely, an oversold condition (below 30) indicates potential bullish momentum. By using the RSI, traders can identify whether the market is primed for a reversal, enhancing the accuracy of their entry and exit points. This indicator helps confirm that the market sentiment supports the pattern, increasing the likelihood of a successful trade.
Volume Indicators
Volume indicators are essential for confirming the strength of the Bearish Quasimodo Pattern. Increasing volume during the formation of the pattern can signal that the reversal is gaining momentum. A higher volume indicates strong market participation, which supports the validity of the trend reversal. Conversely, if the volume is low, it may suggest that the reversal lacks the necessary strength and could lead to a false breakout. By monitoring volume levels, traders can assess the commitment of market participants to the new trend, providing an additional layer of confirmation for the trade setup. This insight helps traders make more informed decisions and improves the overall success rate of trading the Quasimodo pattern.
Conclusion
The Bearish Quasimodo Pattern is a powerful tool for traders seeking to capitalize on bearish reversals. By understanding its formation, spotting it on price charts, and using strategic entry and exit points, traders can effectively incorporate it into their trading strategies. The pattern consists of five key points: a higher high, followed by a lower low, another higher high, a lower high, and finally, a lower low. This sequence creates a distinct shape that signals a weakening bullish momentum and a potential bearish reversal. Traders should look for these specific price movements and validate them with additional tools like the Fibonacci retracement indicator to pinpoint precise entry and exit points, enhancing the pattern's effectiveness.
While the Bearish Quasimodo Pattern offers reliable signals, it is essential to use additional indicators for confirmation and to manage risk with proper stop-loss levels. Indicators such as moving averages, the Relative Strength Index (RSI), and volume indicators can help confirm the trend reversal and provide a more comprehensive analysis. Placing a stop loss slightly above the lower high (point 4) helps protect against false breakouts and minimize potential losses. By combining these techniques, traders can ensure they are making informed decisions and improving their chances of executing profitable trades.
Also Read: How to Trade the Bullish Tri-Star Pattern
FAQs
What is the Bearish Quasimodo Pattern?
The Bearish Quasimodo Pattern is a reversal chart pattern that signals a potential bearish trend reversal, consisting of a higher high, lower low, another higher high, a lower high, and finally a lower low.
How do I confirm the Bearish Quasimodo Pattern?
You can confirm the pattern using indicators such as the Fibonacci retracement tool, moving averages, RSI, and volume indicators.
What are the main advantages of trading the Bearish Quasimodo Pattern?
The main advantages include its reliability in signaling trend reversals and the clear entry and exit points it provides, which make it easier to plan trades effectively.