
The evening star formation is a technical analysis indicator used by traders to identify continuation and reversal trends. This pattern forms over three days. This pattern doesn't occur often. It is often paired with other technical indicators to confirm the strength of the trend and its future direction.
Evening stars are a bearish reversal indicator pattern. The candlestick pattern has three candles. The three candles pattern includes a large bullish candle, a middle candle, and a large bearish candle.
Also Read: Harmonic Patterns: A Complete Guide
Contents
Japanese Candlesticks
Japanese candlesticks are used in forex market charts and other kinds of charts to summarize price movements. The candlestick has a body and 0-2 wicks/shadows. The length of the candle shows the range between the opening and closing price of the asset (e.g., stock, currency).
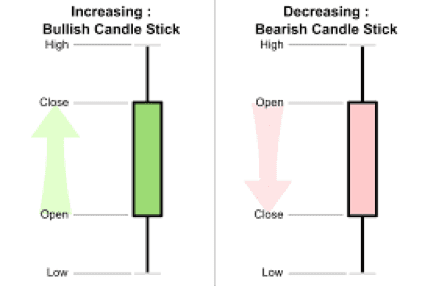
The length of the candlestick has meaning. Long candles are a sign that there is high buying or selling pressure. Short candles mean that there is little to no difference between the opening and closing prices.
Candlestick patterns can signal reversal, bearish, bullish, and continuation trends. There are many kinds of candlestick patterns that traders can use to interpret market charts.
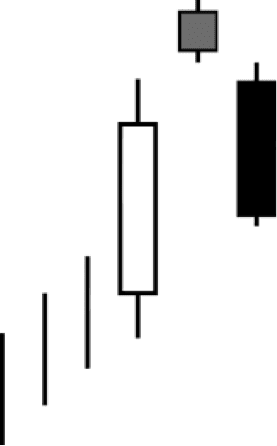
Evening Star Candlestick Formation
Evening star patterns are found in upward price movements. The evening star pattern should have several characteristics before it’s considered a signal that a trend will continue or reverse.
Candlestick Patterns
First Candlestick
The first candlestick will have a long body, with the closing price higher than the opening price. Normally, it is given a red color.
Evening Star Candlestick Pattern
The second candlestick, a small-bodied candle, is called a doji candle. Doji candles are usually smaller than the first and second candlesticks. They are important because the size of the doji candle in an evening star is an indicator of the signal's strength.
If the doji candle is equal in size, the range between opening and closing price, to the first and second candle, the signal has no meaning. It's like noise on a chart.
If the doji is 50% to 75% the size of the first and second candle, then the signal is a weak one. The best signal is one in which the doji is small, 25% or less, of the first and second candlesticks. This doji candle is a strong signal that the market trend will continue or reverse itself.
The absolute best signal that a trader can get is a small-bodied doji candle and a gap between the doji candlestick and the candlesticks on the sides of it.
Third Candlestick
The third candle should extend to at least the mid-length of the first candle. If it extends past the mid-point of the first candle, that is a good sign too. However, if the third candle doesn't extend to the half-way point of the first candle, the signal is weak and cannot be trusted.
Key Chart Lines
Key chart lines are the support and resistance lines on a market chart. These lines mark the highest and lowest points on the chart.
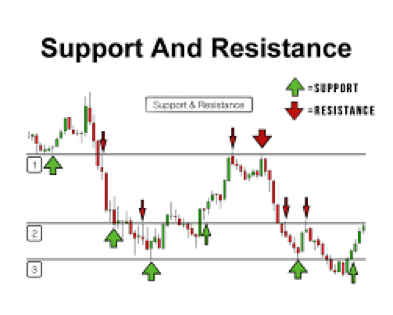
Bearish Reversal Trend
When there is a price uptrend, the evening star has moderate to strong strength, and the evening star pattern is located on the key chart line it signals a bearish reversal trend. This signal can be confirmed by other technical indicators.
The most popular combination is to pair a pinocchio bar and evening star patterns. If both are present and signaling a bear reversal trend, traders will prepare to begin selling their assets or shorting the asset.
Continuation Trend
When there is a price uptrend and there is an evening star with moderate to strong signal strength, the evening star signals trend continuation. The pattern is just a pause in the upward price trend. After the pause, the price will continue to move upward. Note, in this trend, the pattern is located on the key chart line.
Chart Noise
If the evening star signal is weak to moderate and not confirmed by other technical indicators, it should be considered chart noise. The presence of the pattern in a chart is not a determinative. There are instances when the pattern does not indicate anything about the price trend or future direction.
Morning Star Pattern
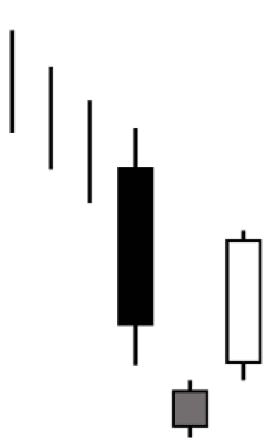
The morning star pattern is the opposite of the evening star pattern. It is an indicator of a bullish reversal pattern. The three candle pattern can signal a continuation or bearish reversal pattern.
When the evening star formation is found in a downward price trend but is not located on a key chart line, it is a continuation trend. The strength of the trend is determined in the same way as the strength of the evening star formation.
However, if the evening star formation is found in a downward price trend and located on a key chart line, the support line, it is a bullish reversal trend.
Morning star patterns should be confirmed by at least one other technical indicator. The indicator of choice is the pinocchio bar pattern. The pinocchio bar, also called the pin bar, is a popular and reliable chart indicator. When paired with the morning star and pinocchio bar patterns are combined, they are strong, reliable indicators of a bullish reversal trend.
Also Read: Bat Pattern Complete Guide 2022
Conclusion
Many traders like using evening star and morning star patterns in combination with the pin bar pattern to read market charts. The patterns take three days to form and when confirmed by other technical indicators have proven to be reliable chart signals.
Novice and experienced traders prefer these technical indicators because they are easy to identify and interpret.
FAQs
Can new traders use the evening star pattern to make good trades?
Yes, the evening star formation is easy to identify, doesn't require quick decision-making, and is a proven reliable market indicator.
Why do traders use more than one technical indicator?
Traders use multiple technical indicators because they want to be certain that they are reading the market correctly. One signal can mislead you, but two or more signals with the same meaning are more likely to be correct.
Which is more common, the evening or morning star formation?
The evening star pattern is more common than the morning star pattern.
Is it difficult to use pin bars?
No, it is very easy to use pin bars. If you want to use pin bars in combination with the evening star or morning star formations, it's even easier. The pin bar will always come before the evening and morning star formations. If you see an evening star or morning star formation, the pin bar should be the candlestick to the left of them.


