
Learn To Trade Forex • Best Forex Trading Course • AsiaForexMentor

GBP/USD Price Forecast: Dives Below 1.3000 and Tests 100-DMA

Written by

Ezekiel Chew

Updated on

January 20, 2025

i

GBP/USD Price Forecast: Dives Below 1.3000 and Tests 100-DMA

Written by:

Last updated on:

January 20, 2025

The GBP/USD pair has fallen below the 1.3000 level, signaling renewed bearish momentum as it now tests the critical 100-day moving average (DMA). This marks a significant move for the British pound, which has been under pressure due to a mix of weaker-than-expected UK economic data and ongoing strength in the U.S. dollar.
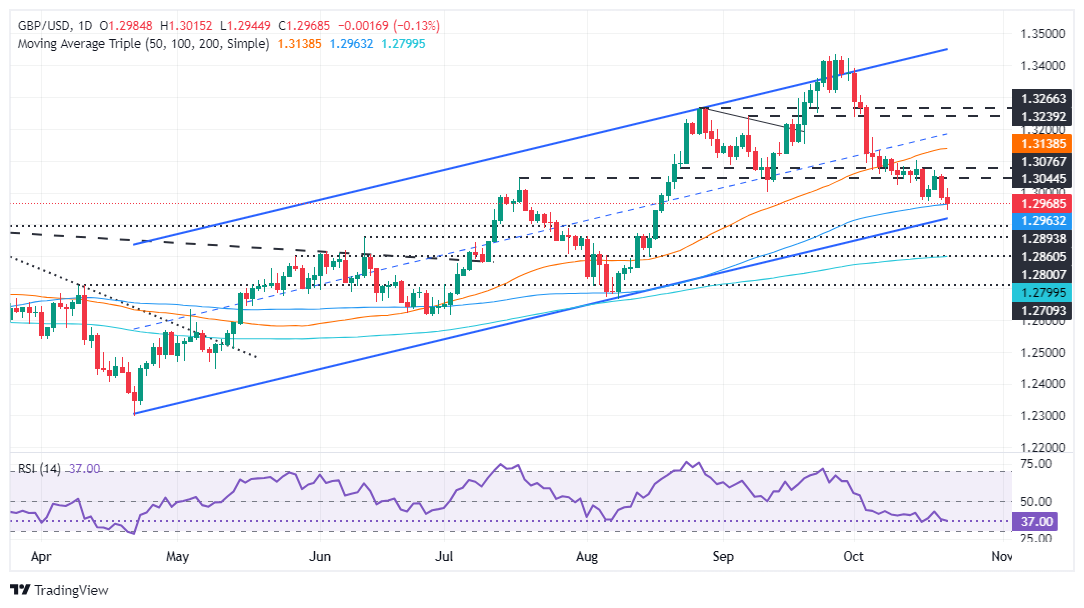
GBP/USD Price Chart Daily as of October 23, 2024 Source – FXStreet

The slide beneath 1.3000 has raised concerns among traders as it suggests that further declines could be on the horizon, especially if the pair fails to hold above the 100-DMA, which is seen as a crucial technical support. A breach of this level could accelerate the sell-off, potentially pushing the pound toward its next key support levels around 1.2900.

The U.S. dollar continues to benefit from robust economic data and the Federal Reserve’s hawkish stance, making it difficult for the pound to recover. Meanwhile, the UK economy has shown signs of slowing, with recent data releases highlighting weakness in consumer spending and industrial output, adding to the downward pressure on the pound.

Looking ahead, investors are focusing on upcoming central bank decisions and key economic reports that could influence the next move in GBP/USD. A recovery above 1.3000 would be needed to reverse the current bearish sentiment, but for now, the pair remains vulnerable to further downside.


About Ezekiel Chew​

Ezekiel Chew, founder and head of training at Asia Forex Mentor, is a renowned forex expert, frequently invited to speak at major industry events. Known for his deep market insights, Ezekiel is one of the top traders committed to supporting the trading community. Making six figures per trade, he also trains traders working in banks, fund management, and prop trading firms.

How to Use Fibonacci Retracement Step by Step in 2026

Most traders learn how to use Fibonacci retracement and immediately draw it wrong. This tool comes from a mathematical sequence first documented in 1202, and institutional traders use it daily to plan entries at precise price levels. The majority of retail traders miss the one placement rule that makes every

Read More

Free Margin in Forex What the MT4 Panel Shows

Free margin in forex is the one figure on the MT4 or MT5 account panel that determines whether another position can open right now, and it is consistently the last number most traders learn to read. ABOUT THIS GUIDE This guide explains what free margin is and how it connects

Read More

Scalping Trading Strategy The Pros Actually Use

The scalping trading strategy most retail traders use is not actually scalping. They are gambling on 1-minute candles with no defined edge, no position-sizing rules, and no plan for when the losses come. ABOUT THIS GUIDE This guide covers what scalping is, how professional scalpers build a repeatable edge, and

Read More

Support and Resistance Levels Most Traders Draw Wrong

Support and resistance levels are the most widely referenced concept in technical analysis , yet retail trading data consistently shows that the majority of traders apply them without structural discipline. They draw too many lines, place them at the wrong prices, and then blame the market when price blows straight

Read More

Why Most Traders Get the Risk Reward Ratio Wrong

Traders who win 70% of their trades still lose money in forex when their average loss is twice their average gain. The risk reward ratio is the math that determines long-term profitability, not the win rate. ABOUT THIS GUIDE This guide breaks down in plain terms: what it means, how

Read More

AFM Trading Summit Live

Date: Coming Soon

Join us at the AFM Trading Summit Live and learn from top industry experts through live trading sessions, market insights, and actionable strategies.

GBP/USD Price Forecast: Dives Below 1.3000 and Tests 100-DMA

4.0
Overall Trust Index

Written by:

Updated:

January 20, 2025
The GBP/USD pair has fallen below the 1.3000 level, signaling renewed bearish momentum as it now tests the critical 100-day moving average (DMA). This marks a significant move for the British pound, which has been under pressure due to a mix of weaker-than-expected UK economic data and ongoing strength in the U.S. dollar.
GBP/USD Price Chart Daily as of October 23, 2024 Source - FXStreet
The slide beneath 1.3000 has raised concerns among traders as it suggests that further declines could be on the horizon, especially if the pair fails to hold above the 100-DMA, which is seen as a crucial technical support. A breach of this level could accelerate the sell-off, potentially pushing the pound toward its next key support levels around 1.2900. The U.S. dollar continues to benefit from robust economic data and the Federal Reserve’s hawkish stance, making it difficult for the pound to recover. Meanwhile, the UK economy has shown signs of slowing, with recent data releases highlighting weakness in consumer spending and industrial output, adding to the downward pressure on the pound. Looking ahead, investors are focusing on upcoming central bank decisions and key economic reports that could influence the next move in GBP/USD. A recovery above 1.3000 would be needed to reverse the current bearish sentiment, but for now, the pair remains vulnerable to further downside.

ezekiel chew asiaforexmentor

About Ezekiel Chew

Ezekiel Chew, founder and head of training at Asia Forex Mentor, is a renowned forex expert, frequently invited to speak at major industry events. Known for his deep market insights, Ezekiel is one of the top traders committed to supporting the trading community. Making six figures per trade, he also trains traders working in banks, fund management, and prop trading firms.

RELATED ARTICLES

GBP/USD Price Forecast: Dives Below 1.3000 and Tests 100-DMA

4.0
Overall Trust Index

Written by:

Updated:

January 20, 2025
The GBP/USD pair has fallen below the 1.3000 level, signaling renewed bearish momentum as it now tests the critical 100-day moving average (DMA). This marks a significant move for the British pound, which has been under pressure due to a mix of weaker-than-expected UK economic data and ongoing strength in the U.S. dollar.
GBP/USD Price Chart Daily as of October 23, 2024 Source - FXStreet
The slide beneath 1.3000 has raised concerns among traders as it suggests that further declines could be on the horizon, especially if the pair fails to hold above the 100-DMA, which is seen as a crucial technical support. A breach of this level could accelerate the sell-off, potentially pushing the pound toward its next key support levels around 1.2900. The U.S. dollar continues to benefit from robust economic data and the Federal Reserve’s hawkish stance, making it difficult for the pound to recover. Meanwhile, the UK economy has shown signs of slowing, with recent data releases highlighting weakness in consumer spending and industrial output, adding to the downward pressure on the pound. Looking ahead, investors are focusing on upcoming central bank decisions and key economic reports that could influence the next move in GBP/USD. A recovery above 1.3000 would be needed to reverse the current bearish sentiment, but for now, the pair remains vulnerable to further downside.

ezekiel chew asiaforexmentor

About Ezekiel Chew

Ezekiel Chew, founder and head of training at Asia Forex Mentor, is a renowned forex expert, frequently invited to speak at major industry events. Known for his deep market insights, Ezekiel is one of the top traders committed to supporting the trading community. Making six figures per trade, he also trains traders working in banks, fund management, and prop trading firms.

RELATED ARTICLES

Join the Live Event
Get Your Free Ticket Now

I consent to receiving emails and/or text message reminders for this event.

REGISTER FOR THE MASTERCLASS!