Hey, what's up guys? It's Ezekiel Chew here. So let me hit you with this. Most traders, they say that they know the CRT, the candle range theory. But the moment the three candles form, they are already trapped. They count the candles, they wait for the close, and then they jump in on the reversal. And then price keeps running. If you are trading the CRT without understanding the trap, you are the liquidity. So today I'm breaking down the three CRT strategies the right way. Want to see how they really work? You won't just spot all the patterns anymore. You're going to start seeing the intention behind it. Let's go.
You're going to learn:
- How the three-candle CRT reversal really works candle one defines the range, candle two performs the sweep, candle three gives you the entry.
- The real engine behind CRT: the AMD structure (accumulation, manipulation, distribution), and why phases matter more than counting candles.
- How to trade CRT with the trend, not just for reversals using corrections, timeframe alignment, and the fair value gap for sniper entries.
By the end, you won't just spot the pattern you'll see the intention behind it, and you'll know how to trade CRT in both directions.
📺 Watch the full breakdown in the video:
What CRT Actually Is
First thing first: CRT, candle range theory. It's simple at its core. Every single candle on your chart holds its own range, from its high to its low. The high becomes a liquidity level. The low becomes another liquidity level. And price constantly reacts to these two points. When the market attacks one side and then it fails to continue, it often shifts towards the opposite end of the range.
That is the basic idea. It's not complicated. It's about liquidity, it's about reaction, and it's about intent in the market. But understanding the idea itself is not enough. The real edge shows up when three candles align in a specific way that reveals a clean reversal blueprint. And this is what strategy number one is all about.
Strategy 1 The Three Candle Reversal Blueprint
This is where most traders miss it. The CRT setup is not random. It follows a three-candle blueprint. Once you understand the role of each candle, the reversal becomes very clear.
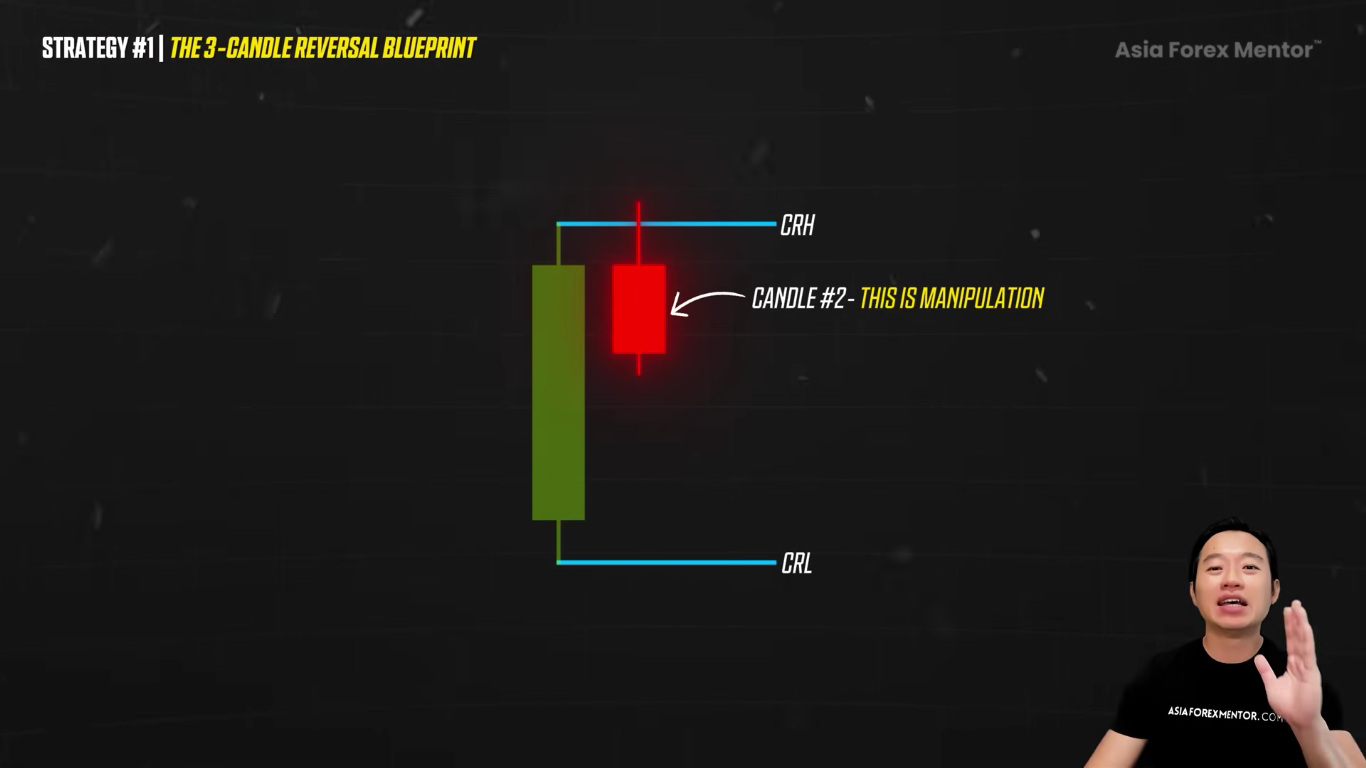
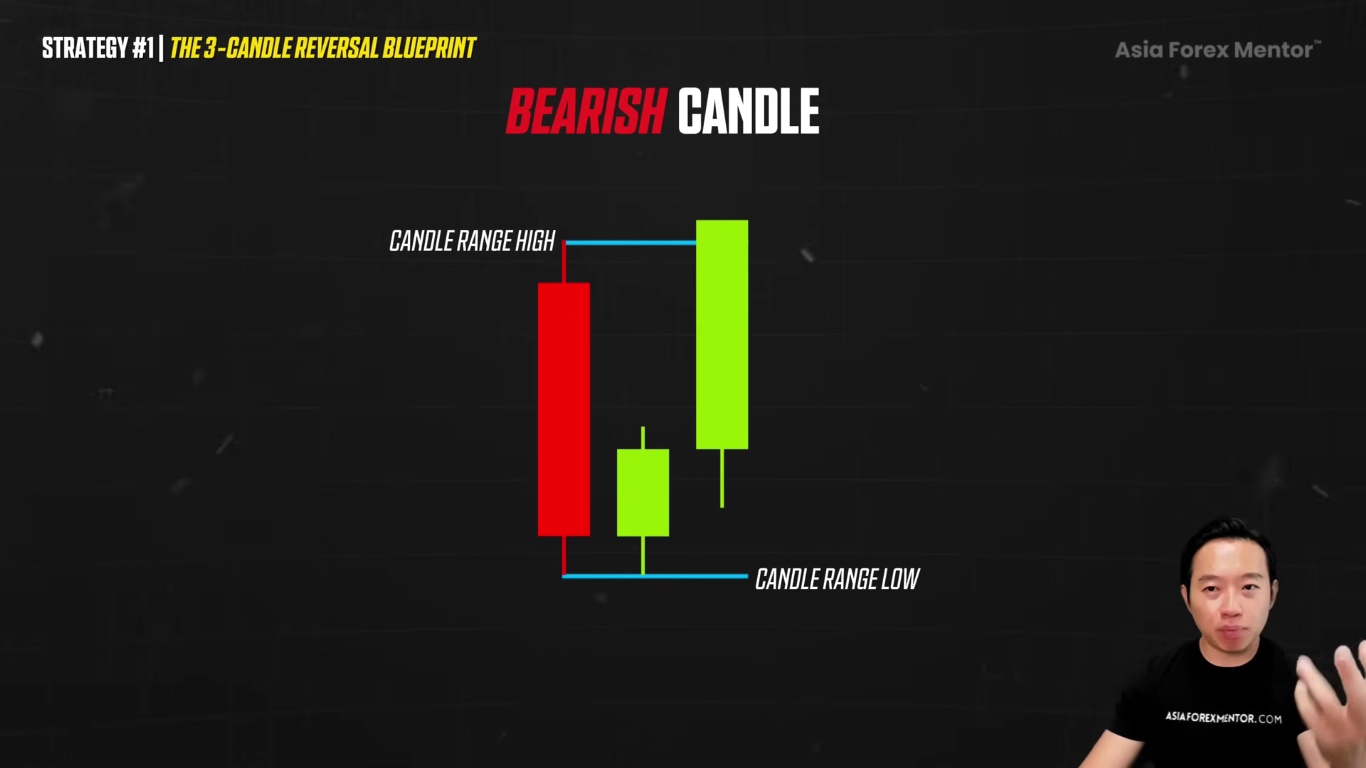
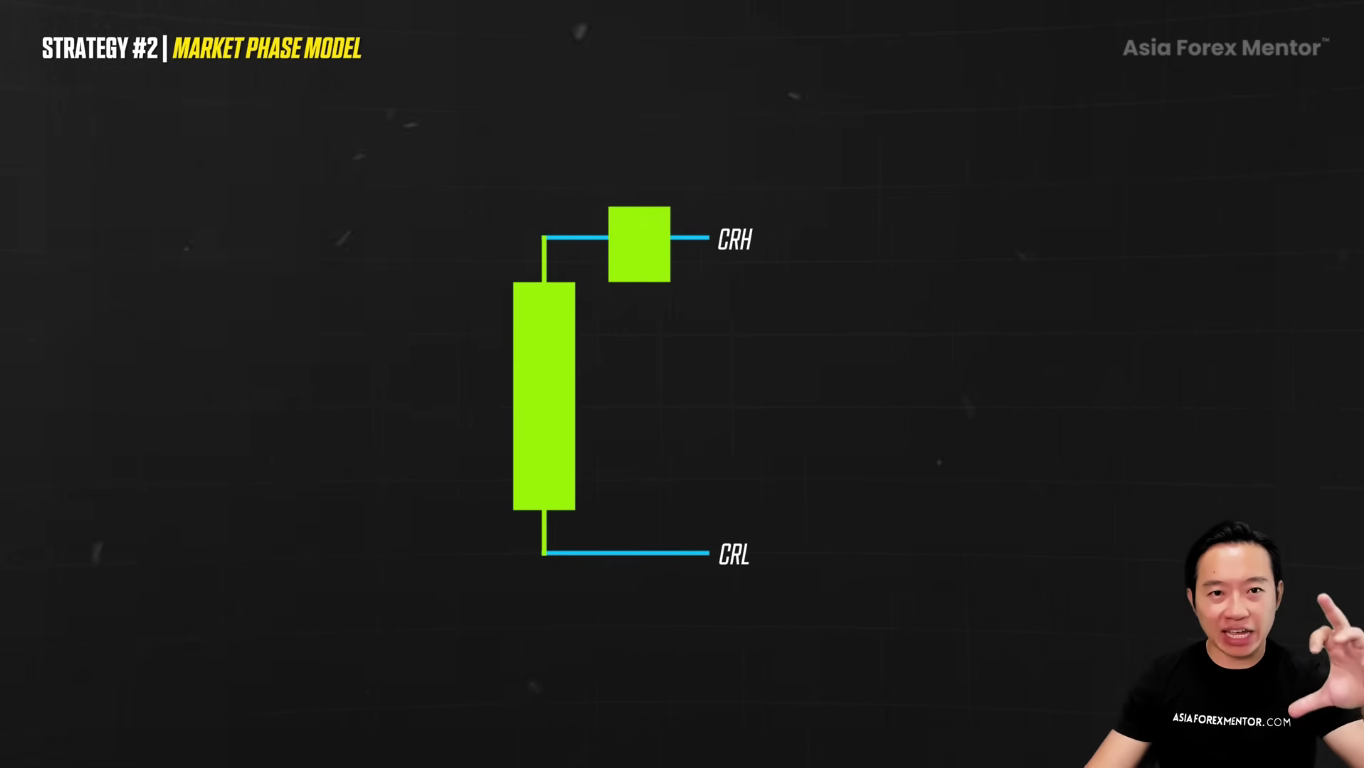
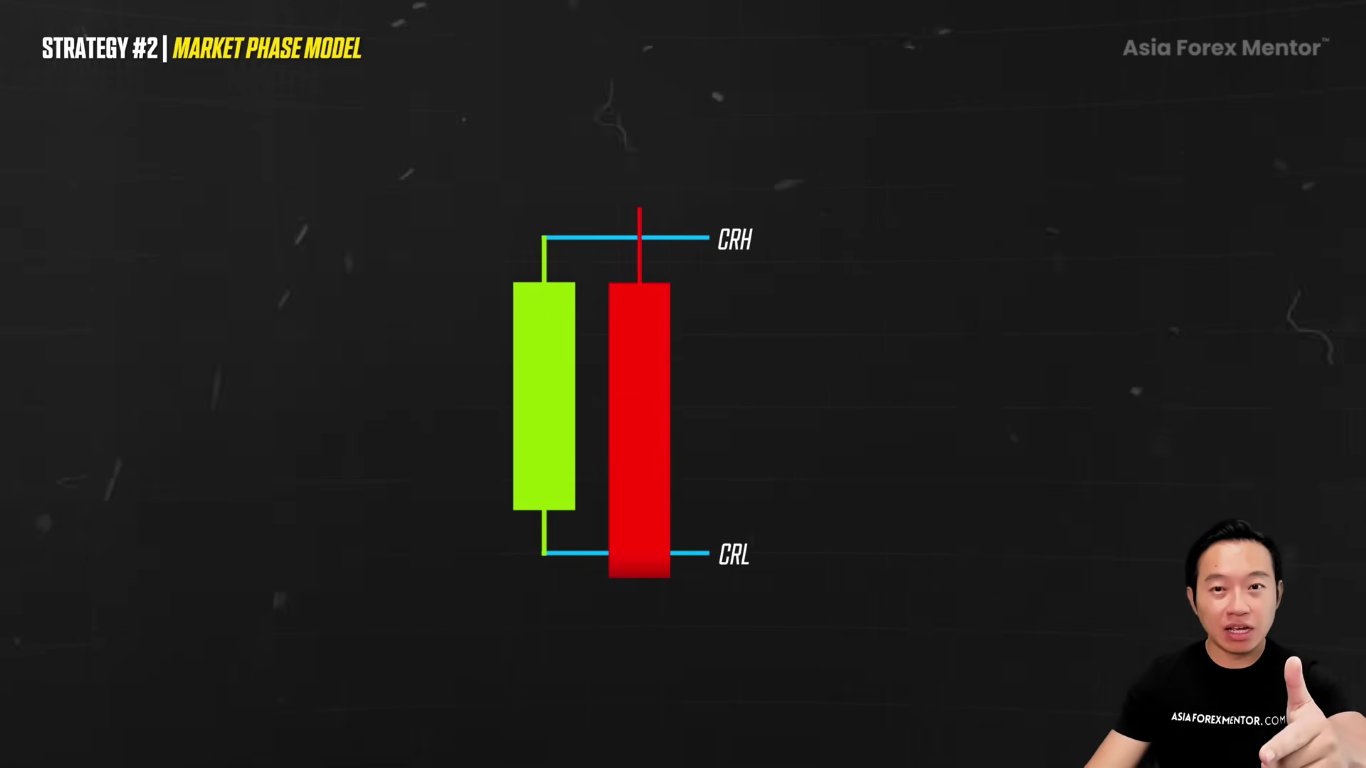
The first candle is simple. The first candle defines the range. That's it. The high becomes the candle range high,
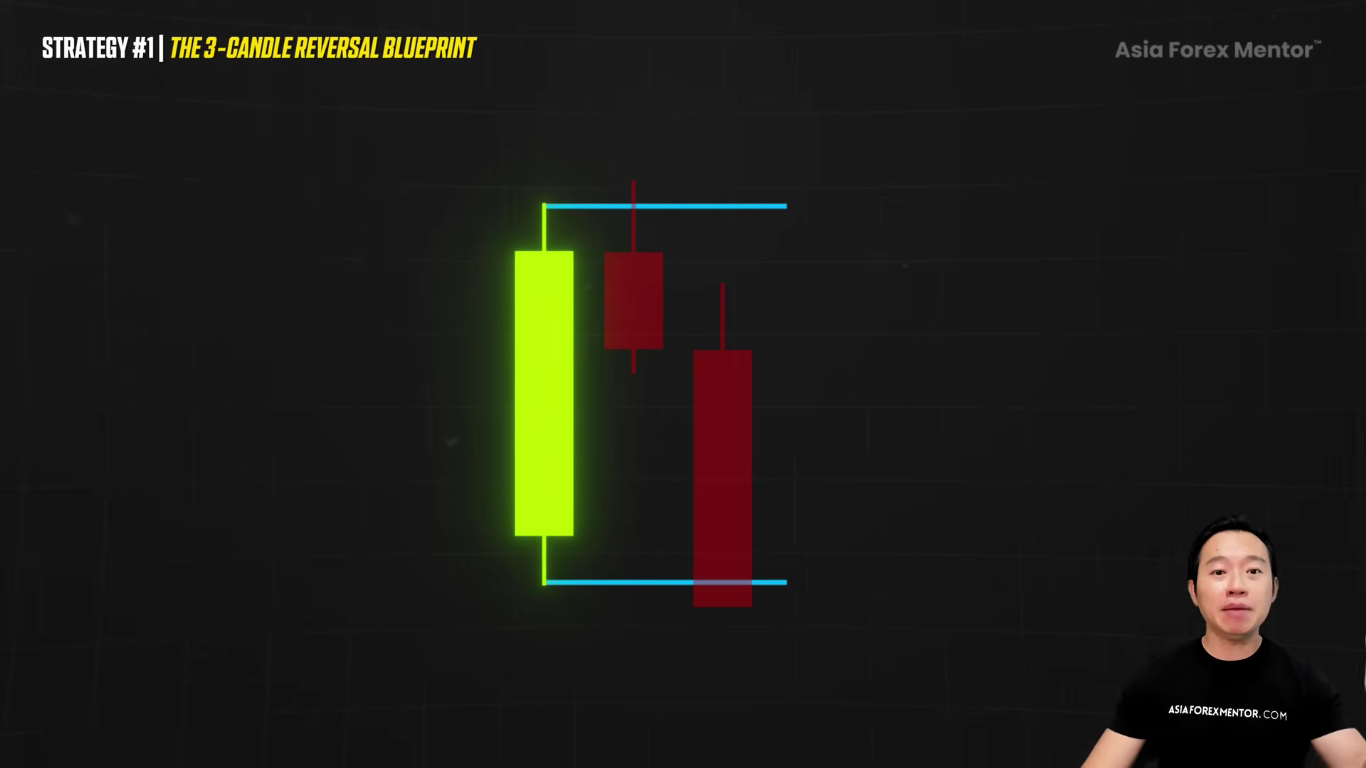
and the low is the candle range low. These wicks are not decorations on the chart. They are liquidity. They are targets,
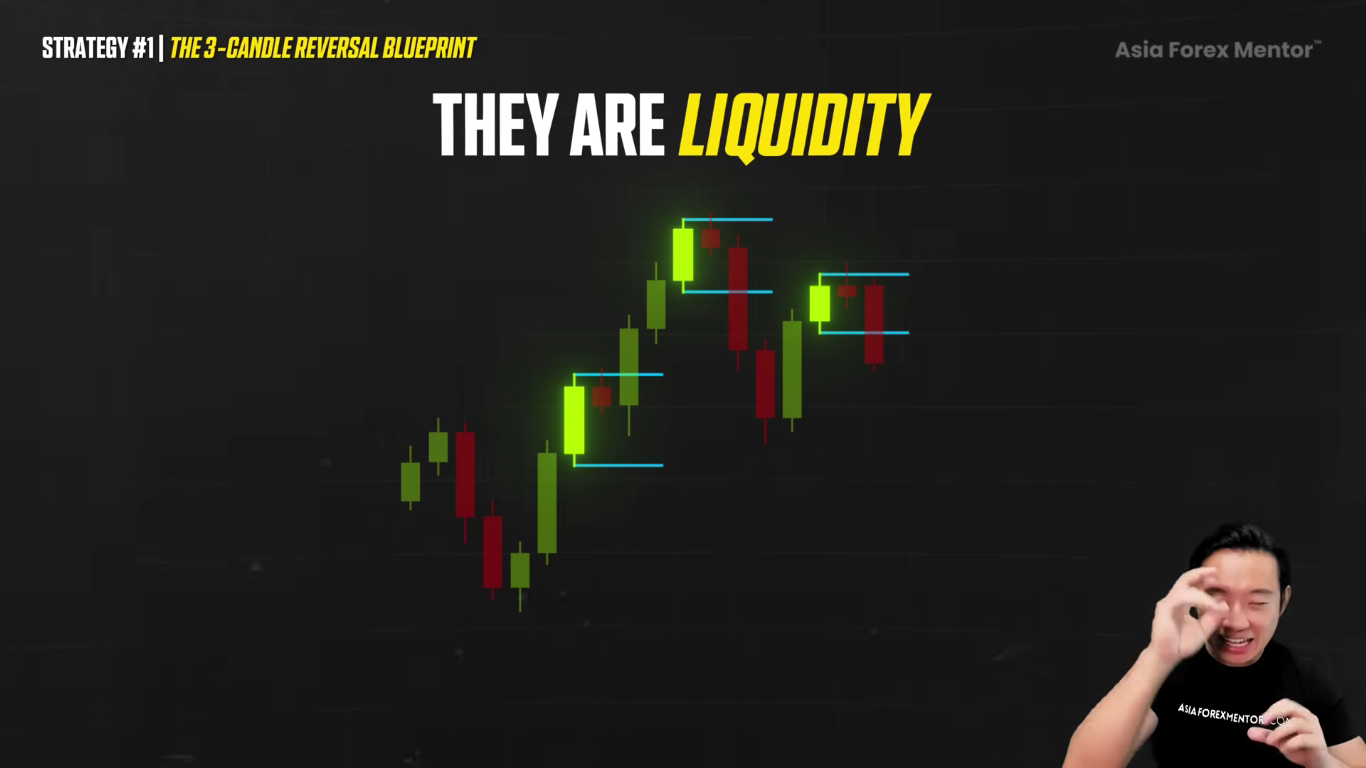
and almost every candle on the chart will attack either the previous high or the previous low. Candle one is a common candle. It's not for entry.
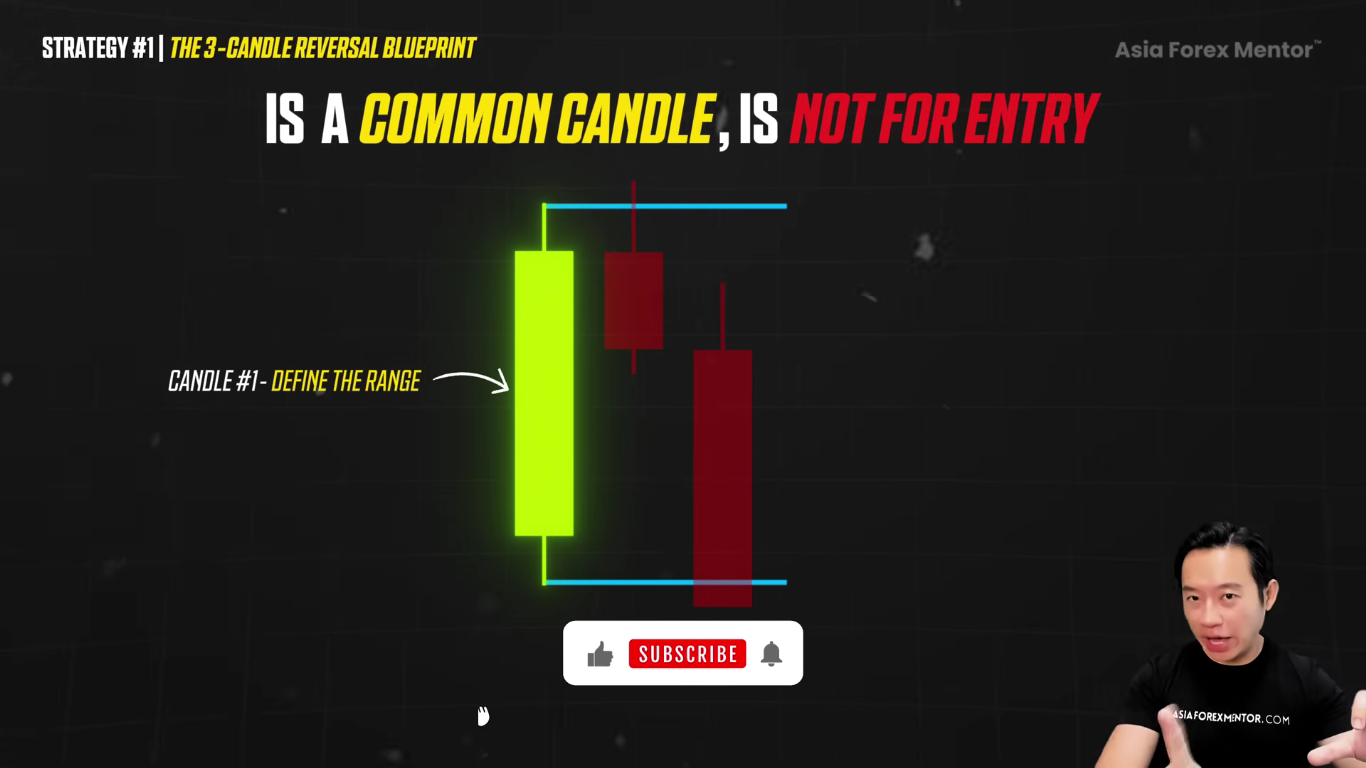
It is for you to define the battlefield. Inside that one candle is where you're going to have all the information that you need: the open, the close, the highest traded price, the lowest traded price.
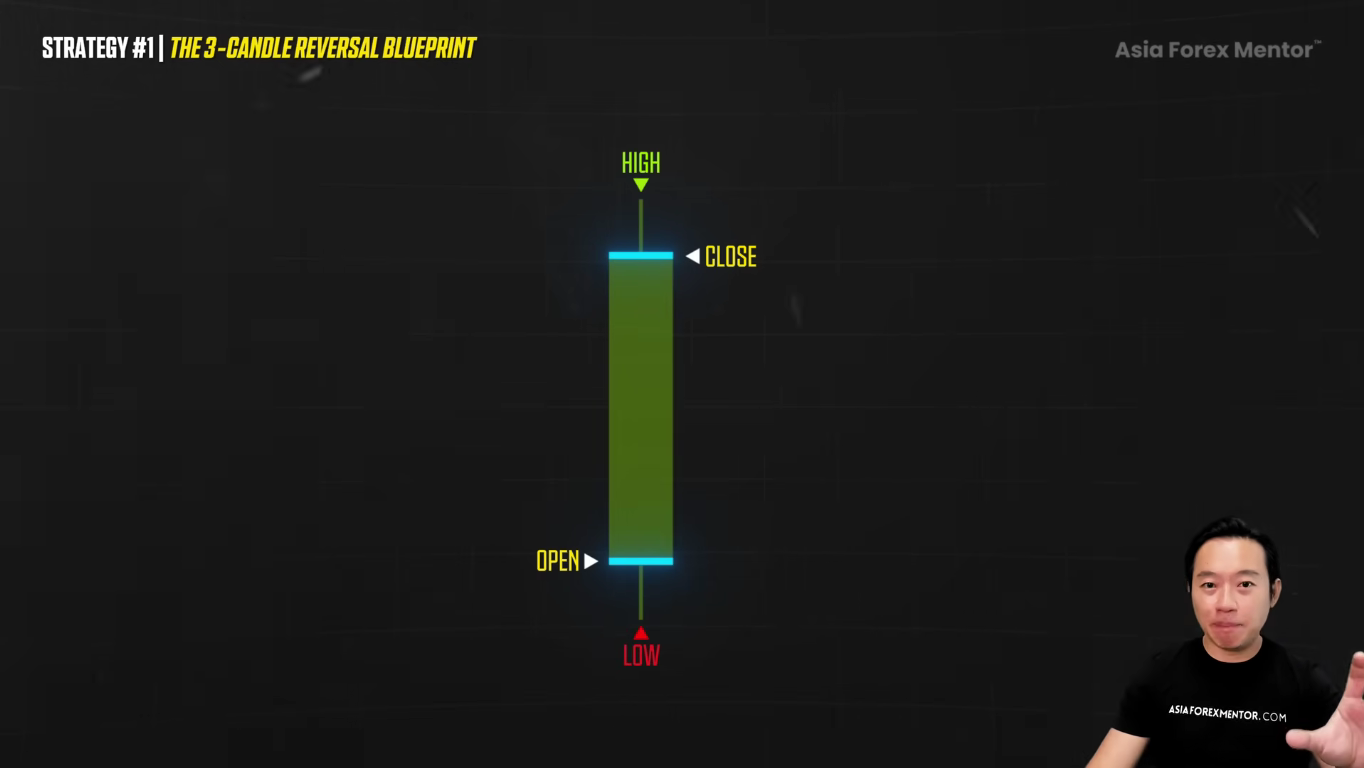
And the belief here is both wicks act as isolated, separate liquidity pools. So the market is constantly deciding: do I want to buy above the high, or do I want to sell below the low? And that's why any candle on any timeframe can technically be used. What matters is that we clearly mark the range and prepare for what comes next.
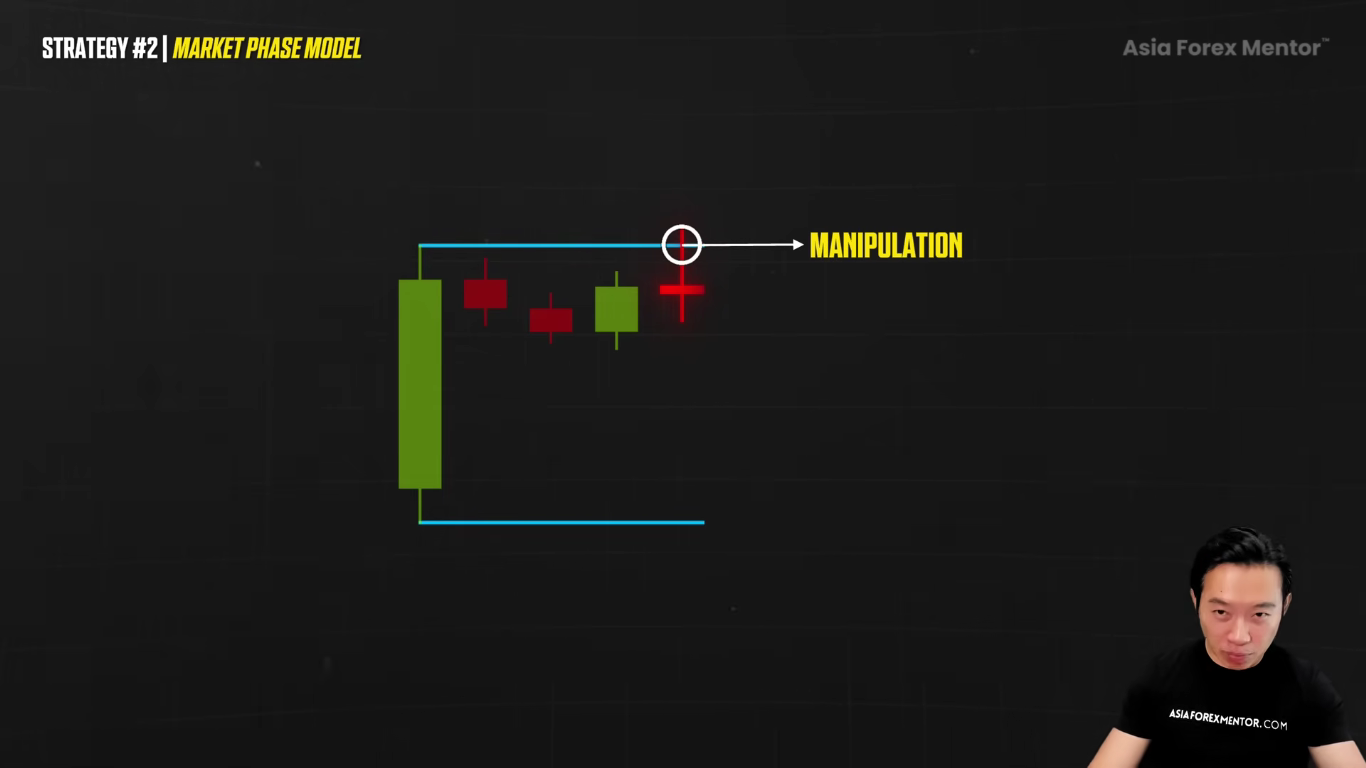
Candle two. This is the most important piece of the puzzle. This is where the manipulation shows up.
If price pushes above the candle range high but fails to close above it, this is not strength in the market. This is a liquidity sweep.
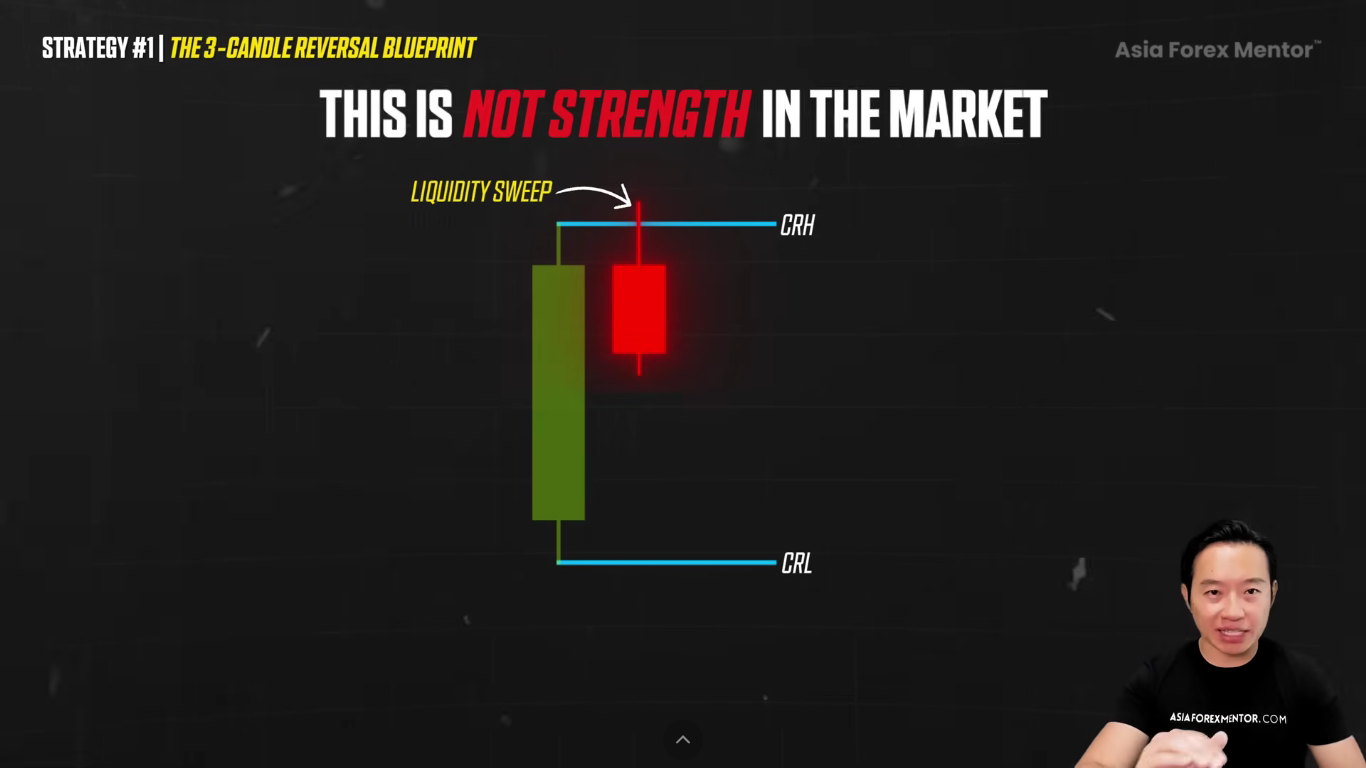
It means the market grabbed all those buy stops and then it rejected higher prices. When rejection happens, there's a high probability that the next target becomes the candle range low.
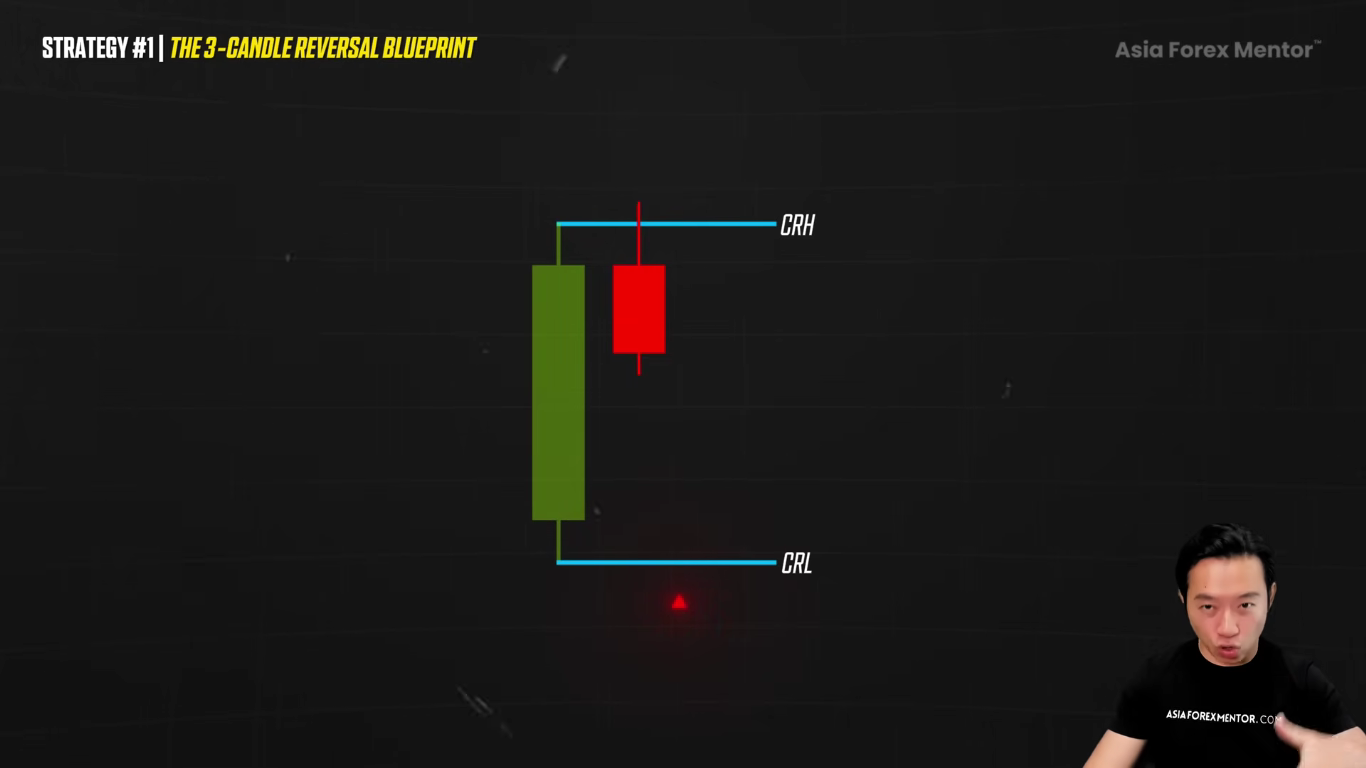
Here's the thing. If the second candle closes strongly above the range itself, the whole setup is now invalid. There's no guessing anymore. There's no forcing the trade. The close that goes back inside the range is the confirmation that the sweep is a manipulation, not a continuation upwards. If the second candle meets the requirements, that's where we can look for a setup in the third candle that allows us to enter a short position,
with the goal of reaching the low of the candle range itself.
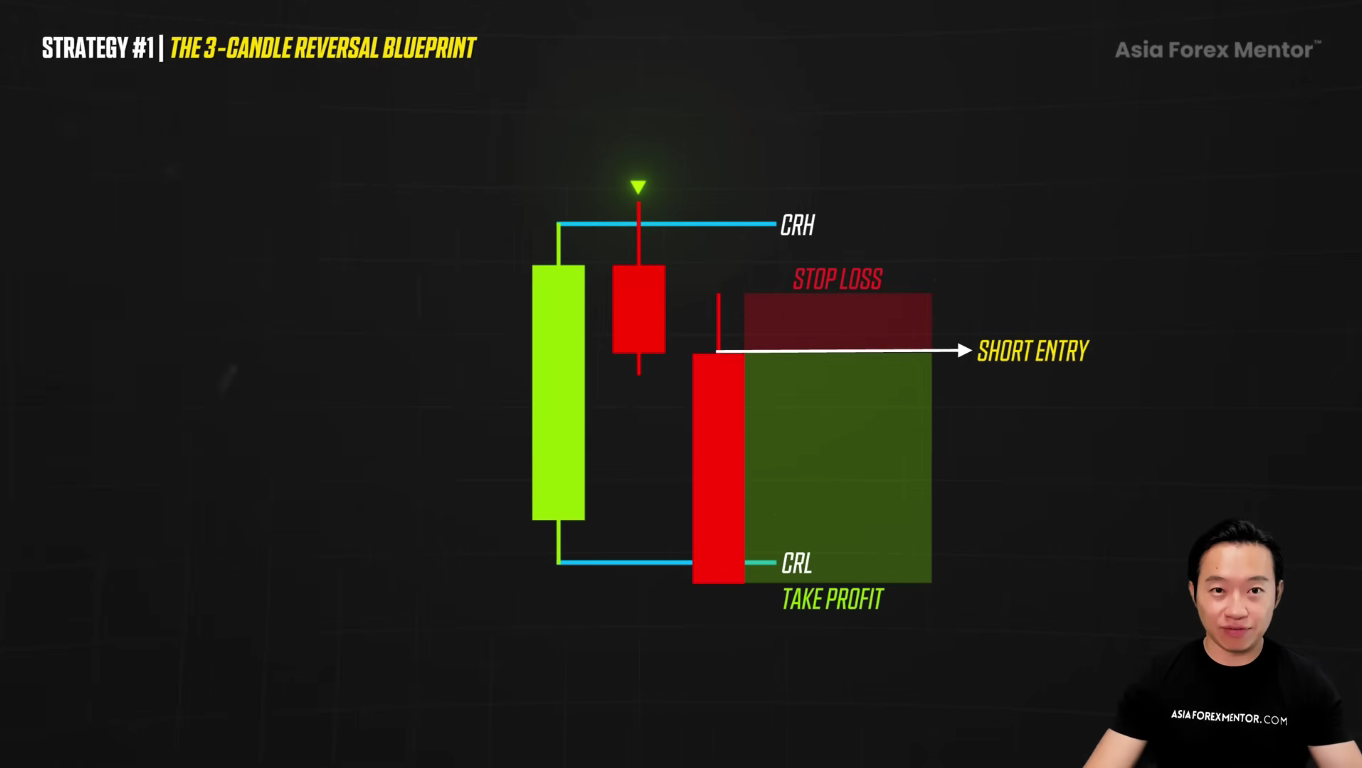
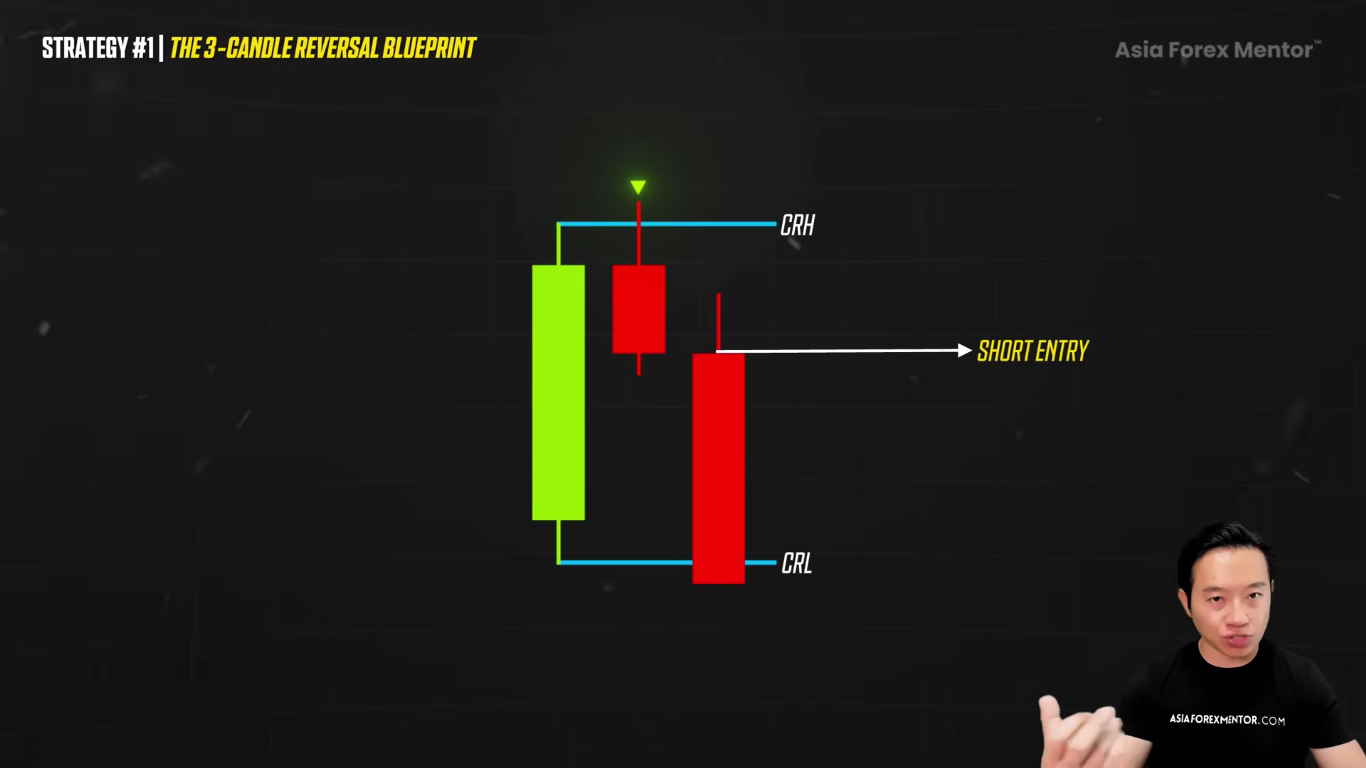
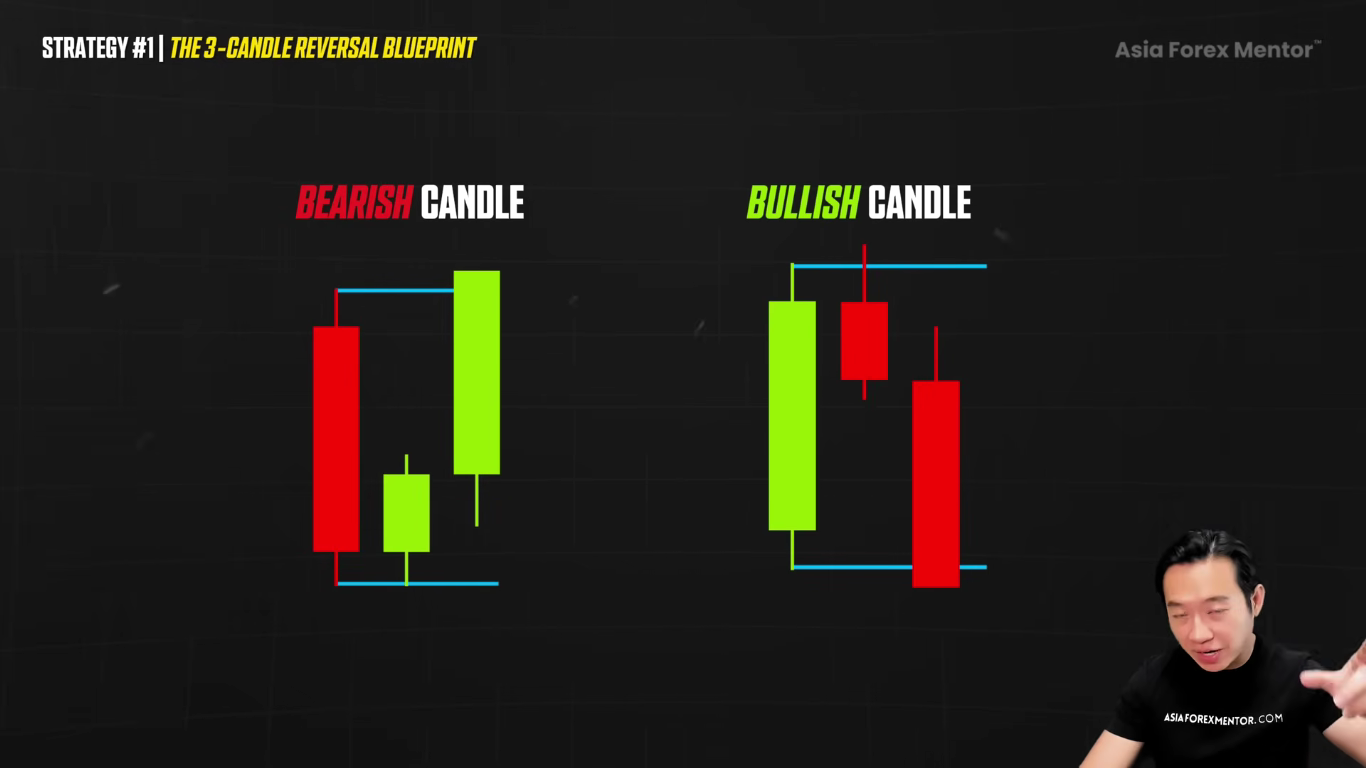
Here comes candle three. This is where we execute, and this works both ways. If the first candle is bearish, we flip the logic the other way.
Now we want to see price sweep below the candle range low and close back inside. Then we look for a bullish change of character and a bullish fair value gap for us to enter long. Same structure, same rules, just mirroring.
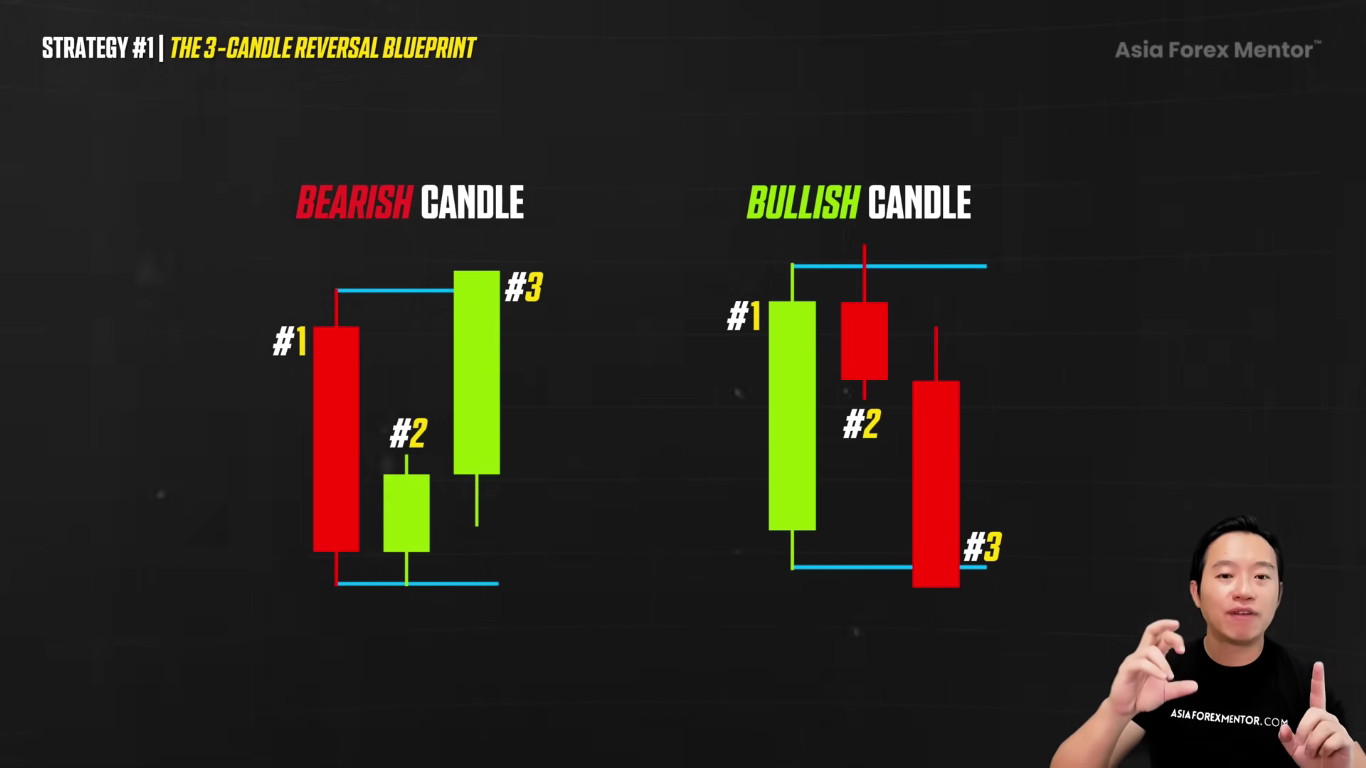
Now that you understand this: candle one defines the range, candle two performs the sweep and proves the manipulation, and candle three gives us the entry after the momentum shift. This is the raw engine of the CRT.
If you think it's just a three-candle pattern, here's where we go deeper into the structure. If you are counting candles instead of reading the phases, you are already the exit liquidity. We're going to move beyond patterns and step into the actual structure itself.
Strategy 2 The Market Phase Model
Here's the shift that upgrades everything you already know. CRT is not a three-candle pattern. The three-candle version is the easiest way to see it. But the market doesn't really care about your candle count. What matters is the story that the market is telling you. And the story is AMD: accumulation, manipulation, and distribution. So if that structure is not there, the CRT setup that you see is just a random sweep in the market. So we don't have to count the candles anymore we're going to start reading the phases, because phases are what repeats itself.
Think of the AMD like a trap being built, then sprung, then exploited. Accumulation is when price stays tight and doesn't move much. It feels boring and it looks harmless.
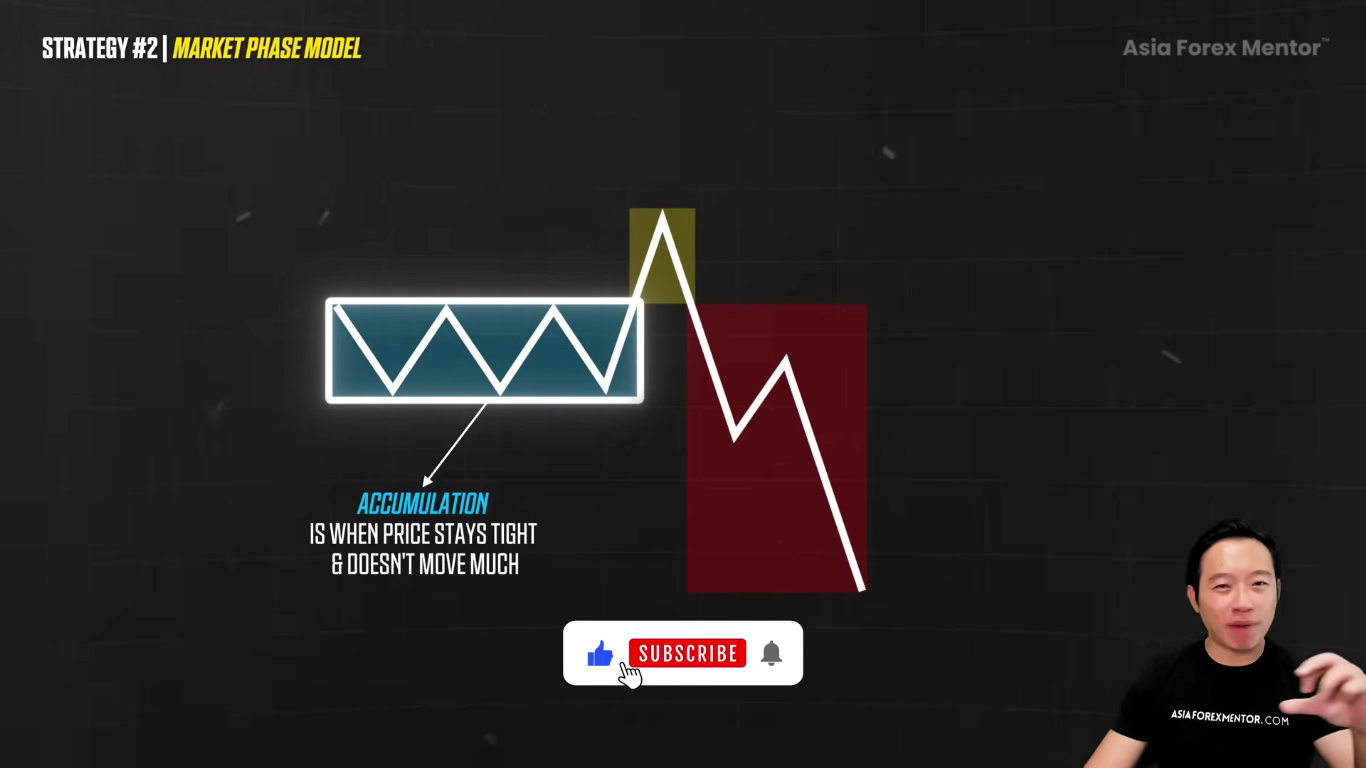
But this is important, because of the liquidity it builds there.
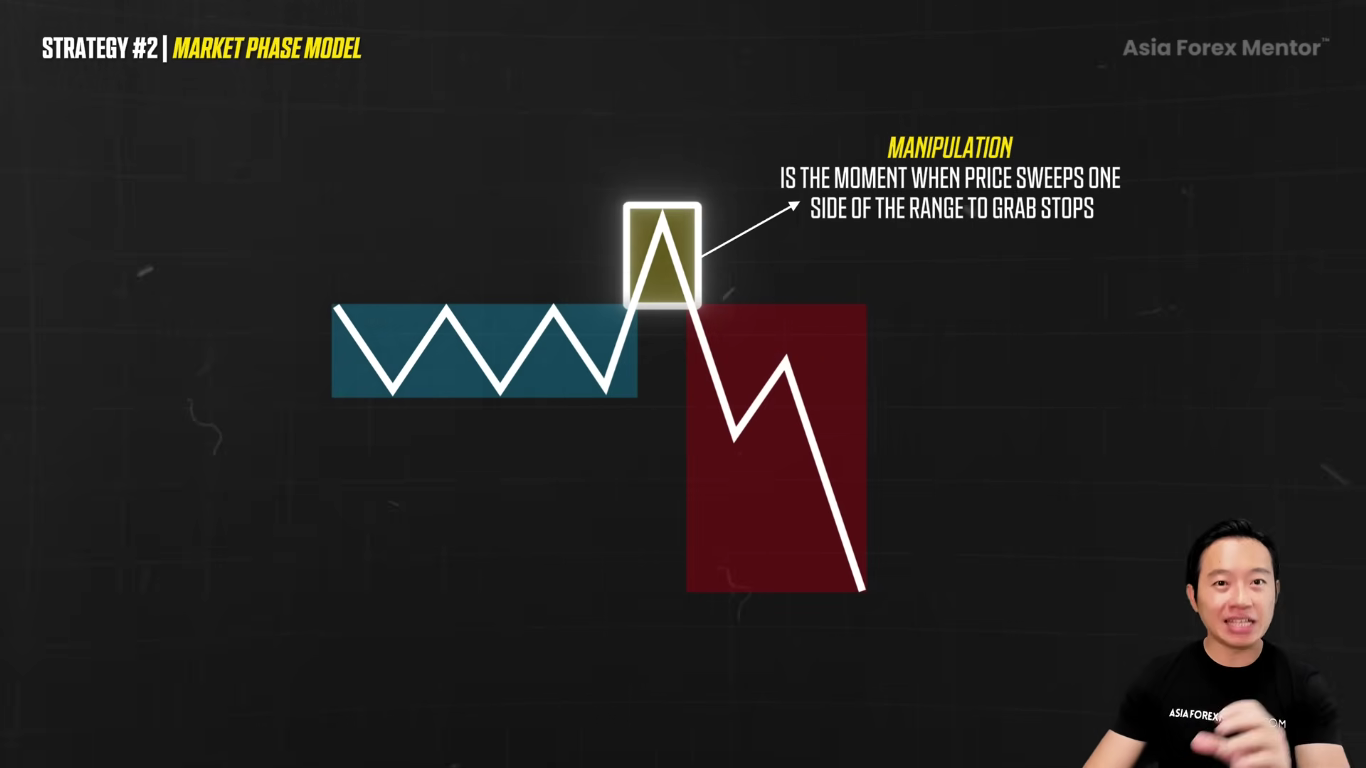
Manipulation is the moment when price sweeps one side of the range to grab all the stops over there.
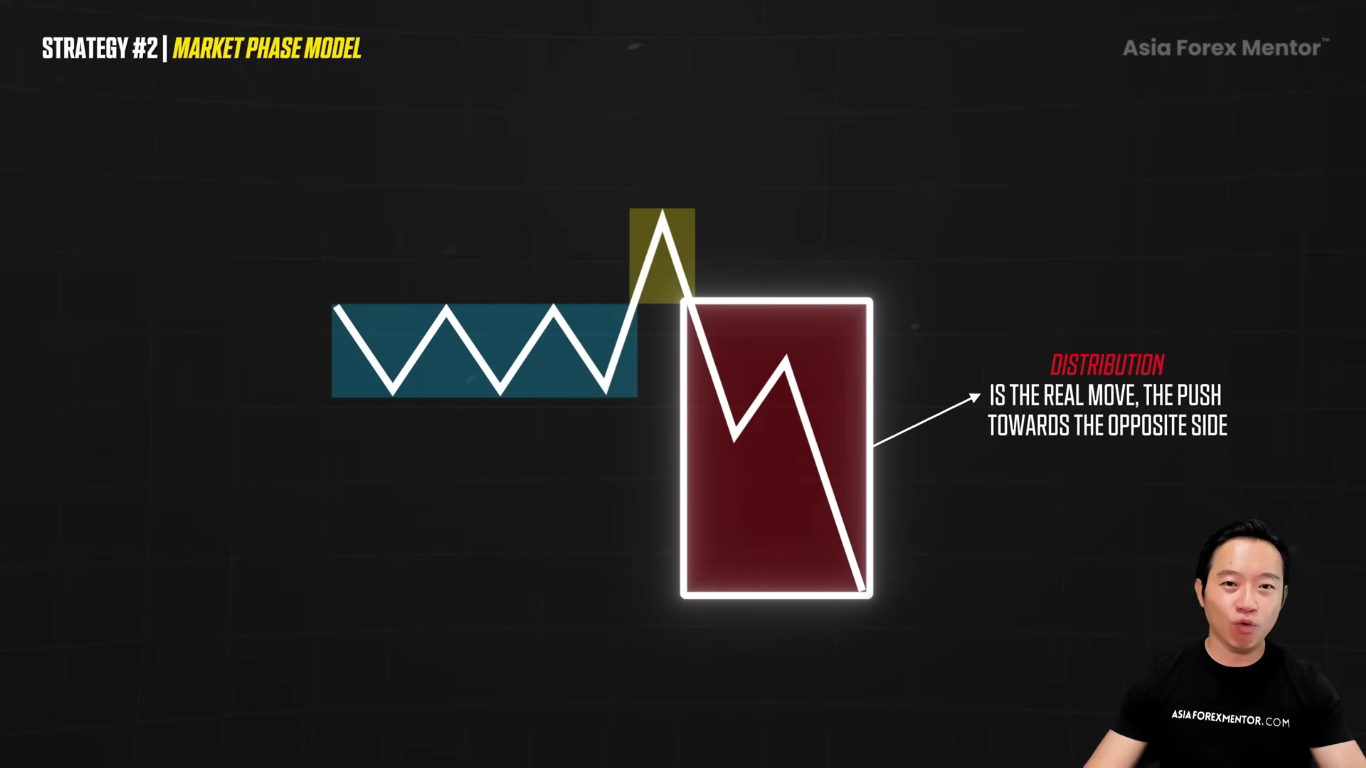
And then the distribution is the real move itself the push towards the opposite side, where the market finally runs into the next pool of liquidity. The entry belongs in the distribution itself, but only after the accumulation and the manipulation are already confirmed.
When you are looking at a CRT range, you might see candle number one, and then we define the high and we define the low. And then you see a few candles that just sit down there.
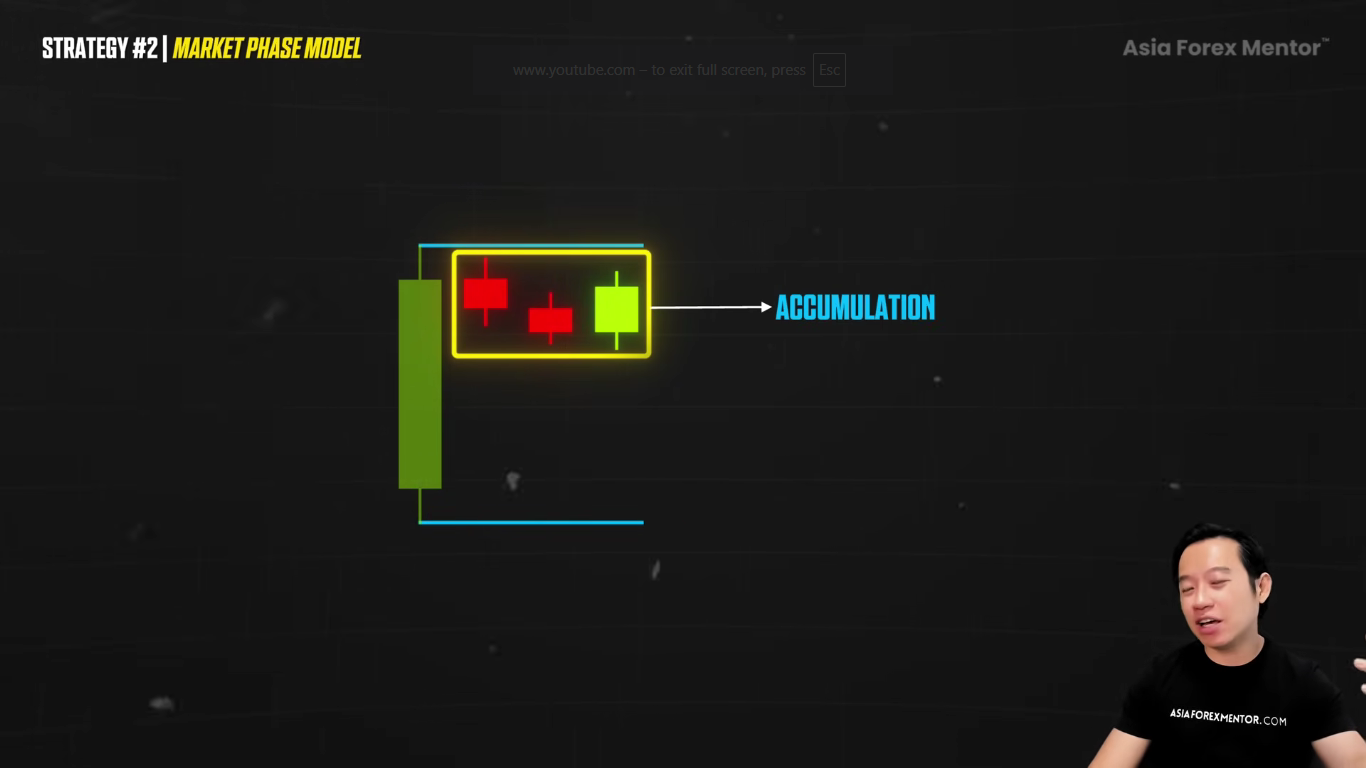
This itself is accumulation. If you see one candle spike through that range high but close back inside, that is the manipulation phase.
And the close back inside is still the rule, because without that close, it's not a sweep it's a break. After the sweep, when price starts pushing down in a clean bearish candle,
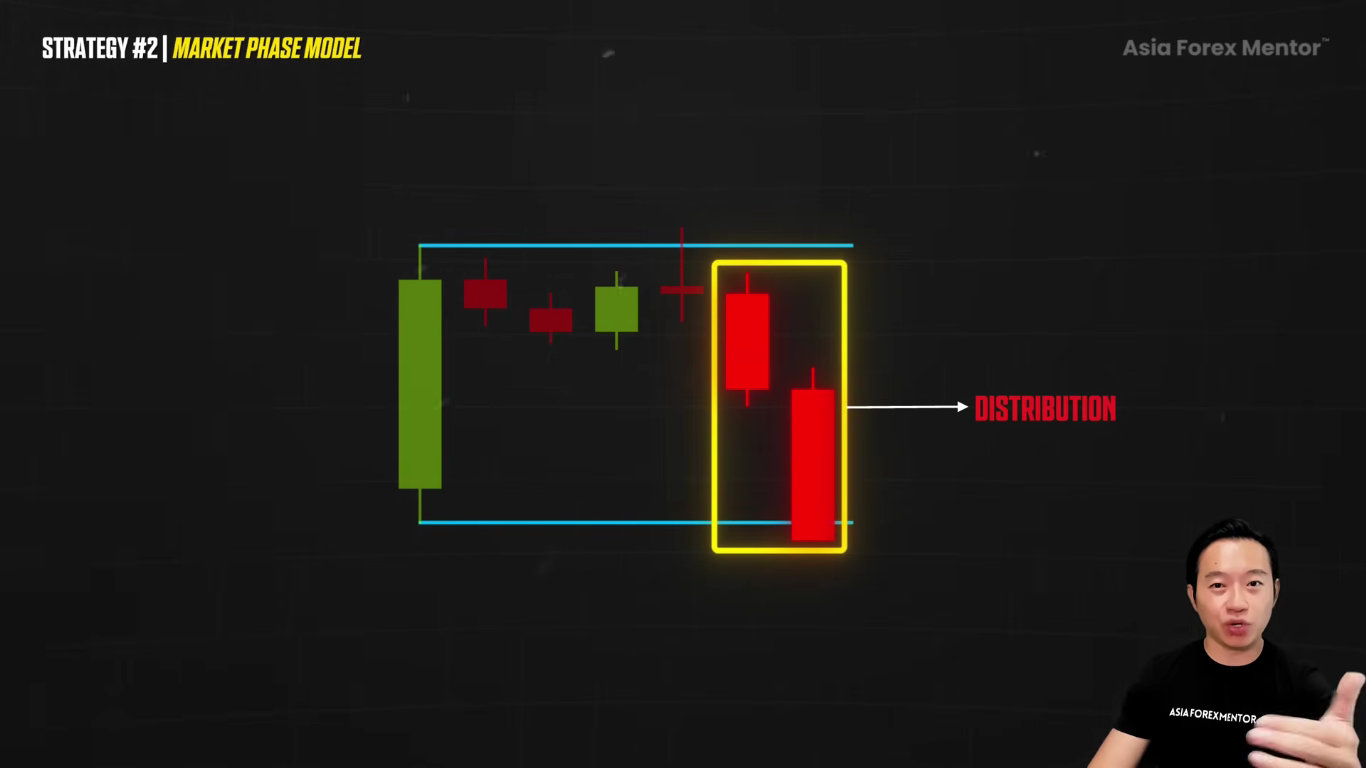
it moves towards the candle range low. This is the distribution. This is the phase where the market shows its real hand.
Here's the clean confirmation: inside the sweep, after the manipulation, look for a change of character that proves the momentum has actually flipped. So if price sweeps the liquidity above and then breaks the structure the other way, that is not just a wick.
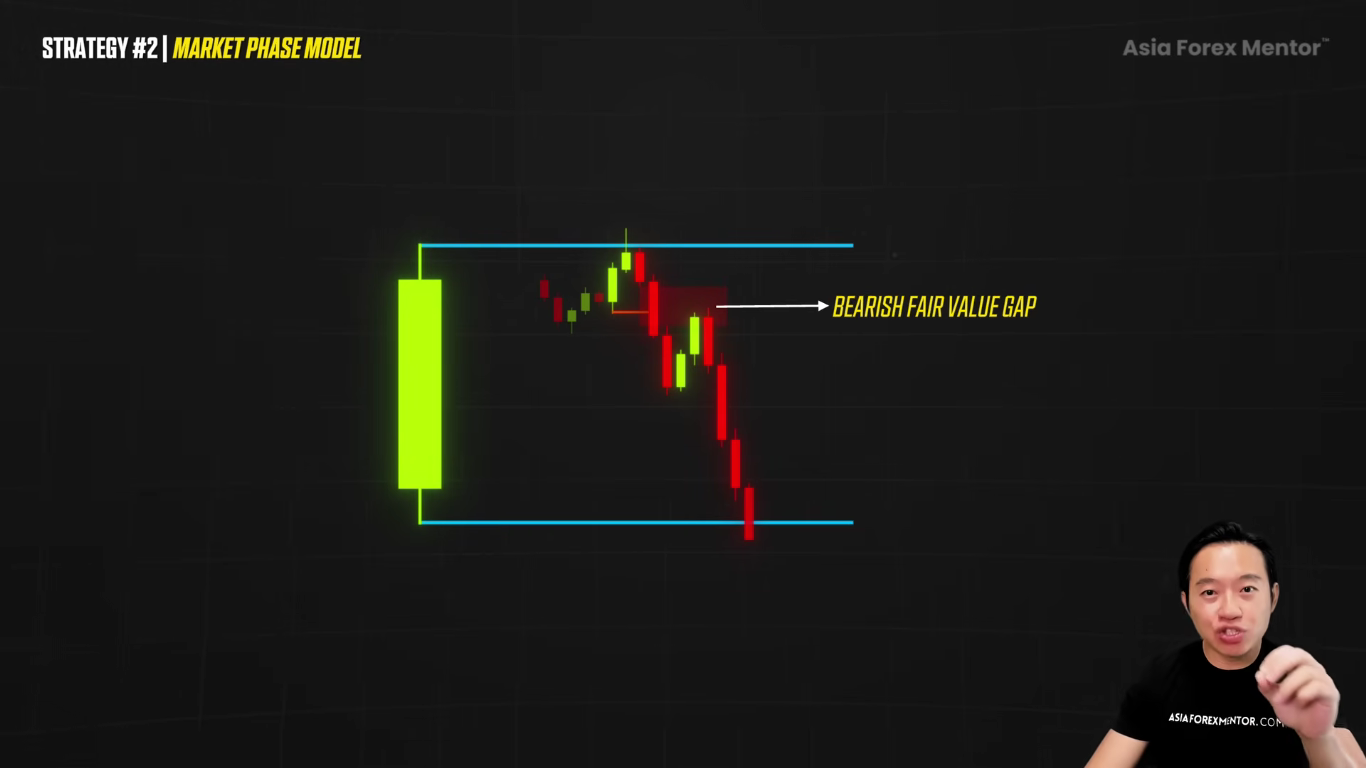
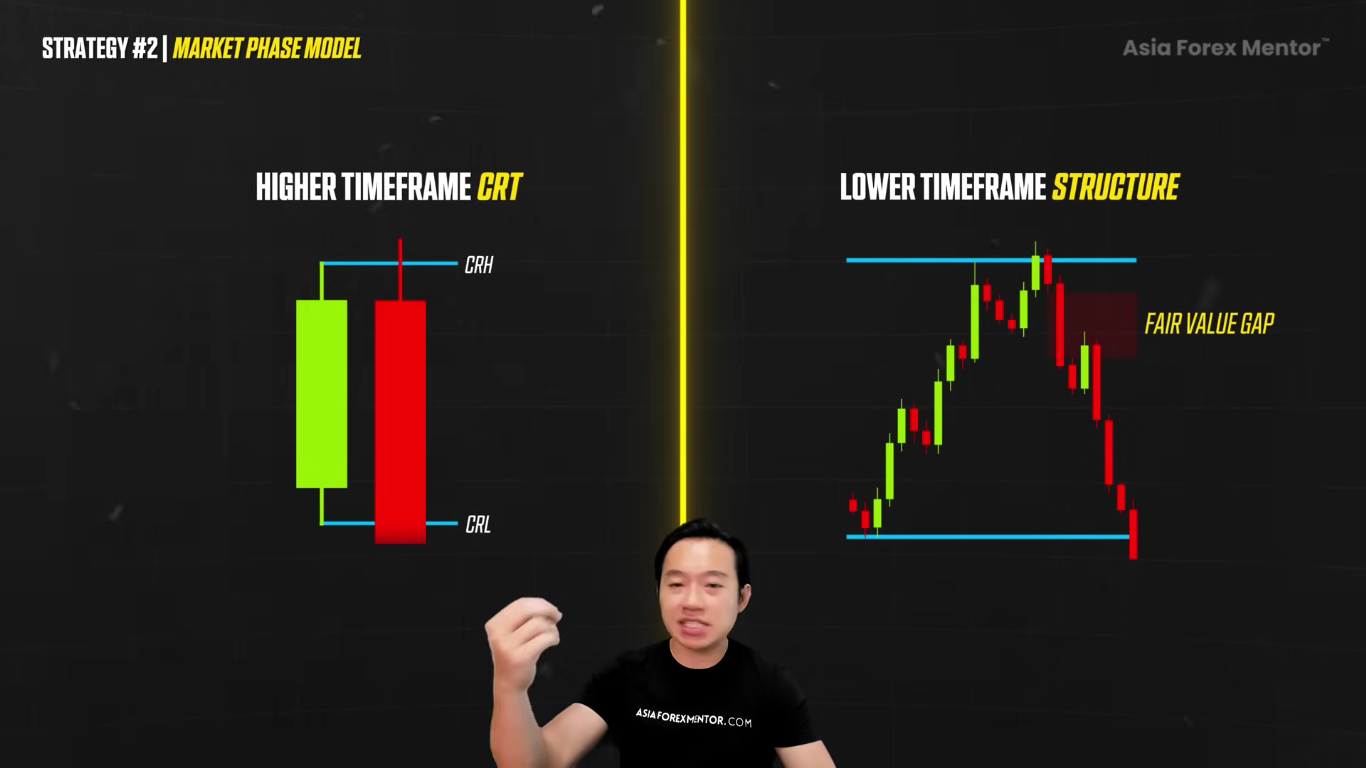
This is intent. And if a bearish fair value gap forms during that leg, this gives us a logical entry zone inside the distribution. The CRT becomes structured now.
Once the AMD engine is clear, the next step is knowing where to look inside the chart, so that we can actually trade with precision. We need to talk about the mistake first the one that wipes out most CRT traders.
They spot a clean candle range high and low, they see a sweep, and they immediately jump in on the sweep. It feels logical, but it's dangerous,
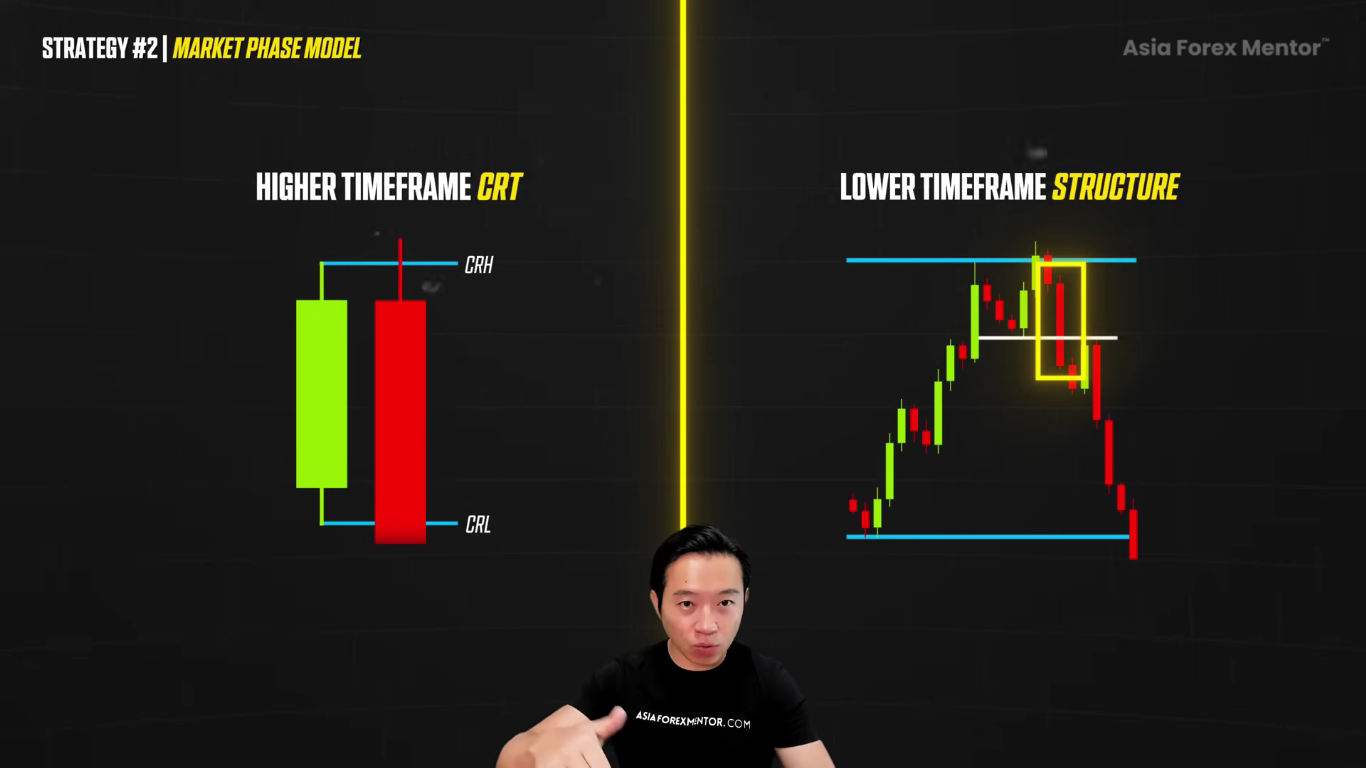
because the higher timeframe is only showing you the shell of the move itself. It shows where the candle opened, where the candle closed on the higher timeframe, and it shows the wick but it does not show you the story inside that wick.
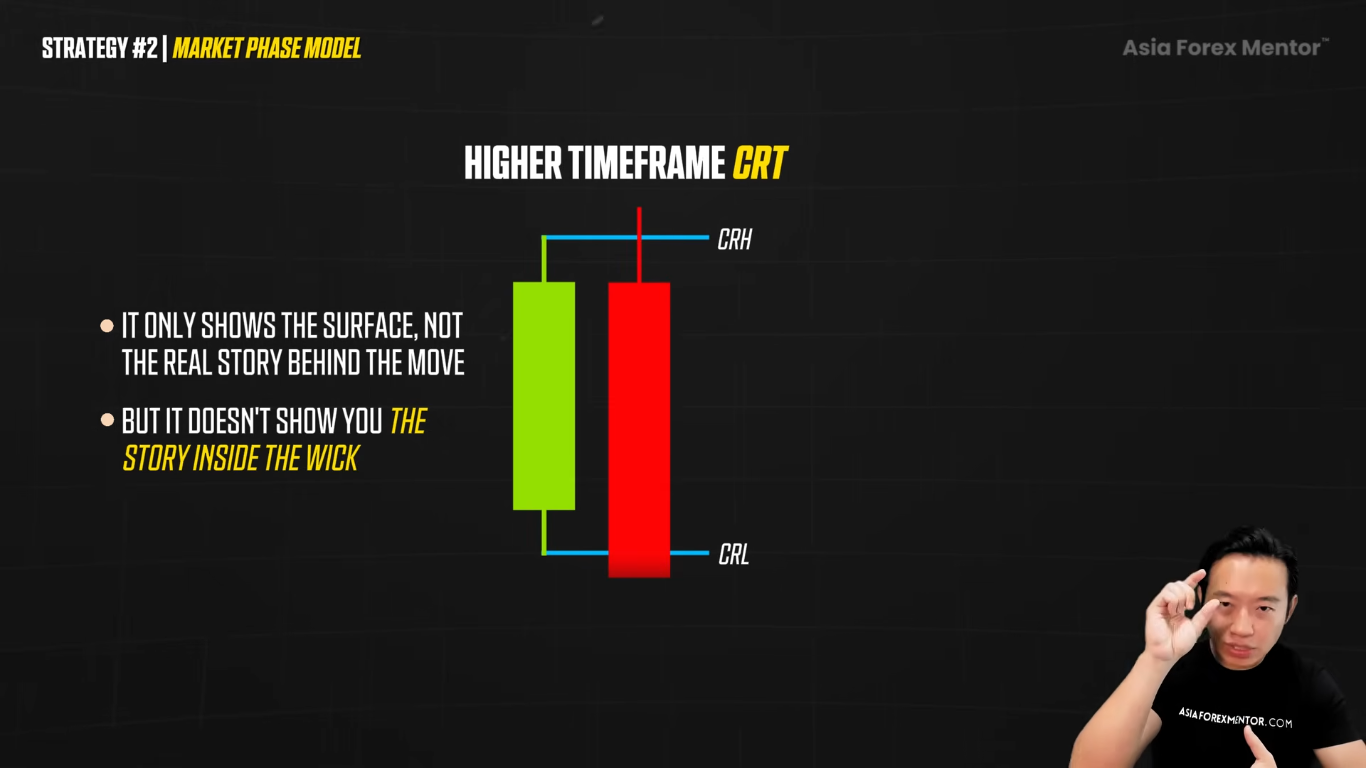
The CRT is all about the story.
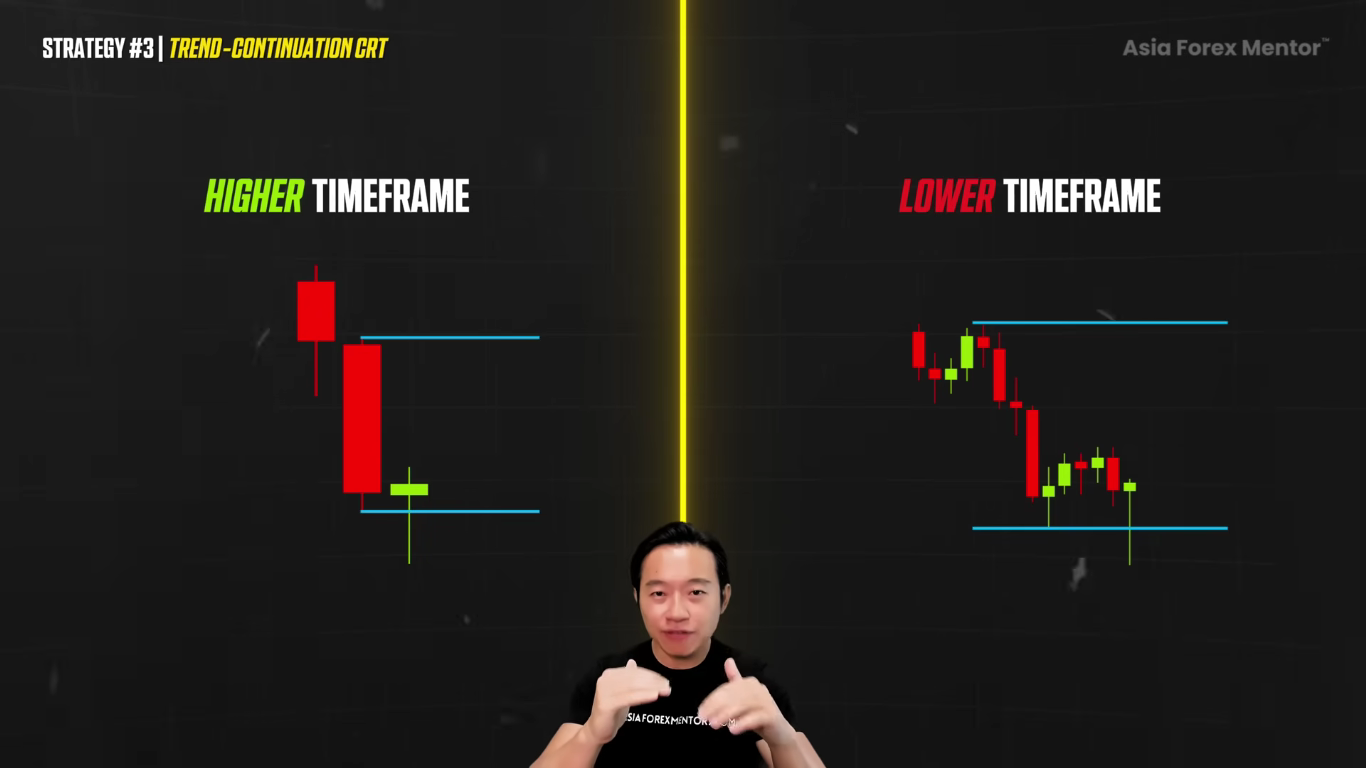
But on the higher timeframe, we still don't have the one thing we need before we risk money: proper market structure confirmation. We cannot see the change of character clearly. We cannot see where the fair value gap is being formed. We cannot see how the push and pull actually happen. Which is why we need to drop down the timeframe.
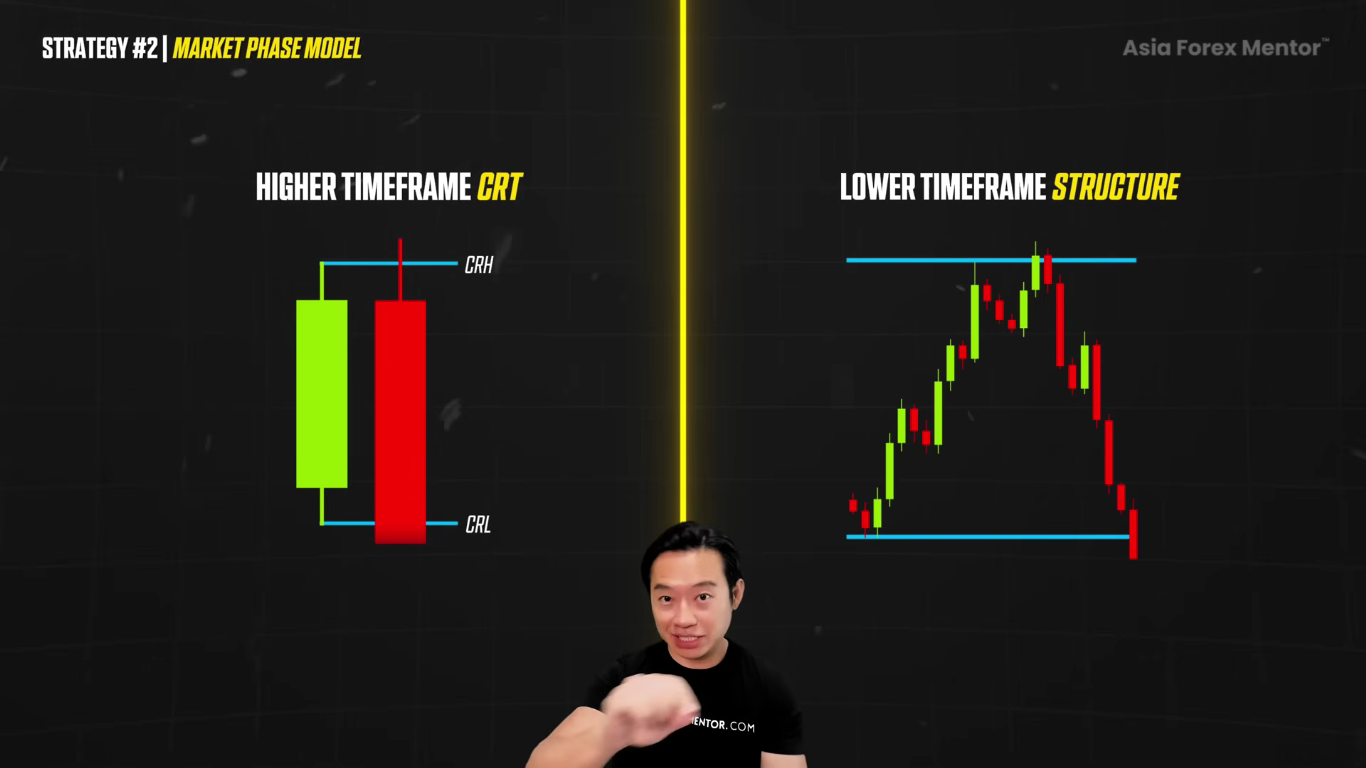
This is where we do timeframe alignment and how the smart money concepts are traded with precision. The higher timeframe gives us the idea. The lower timeframe gives us the evidence.
In the lower timeframe, we break down the move and we ask ourselves: did we actually get the AMD the accumulation, the manipulation, and then the distribution? Did we actually see the sweep grab the liquidity and then fail?
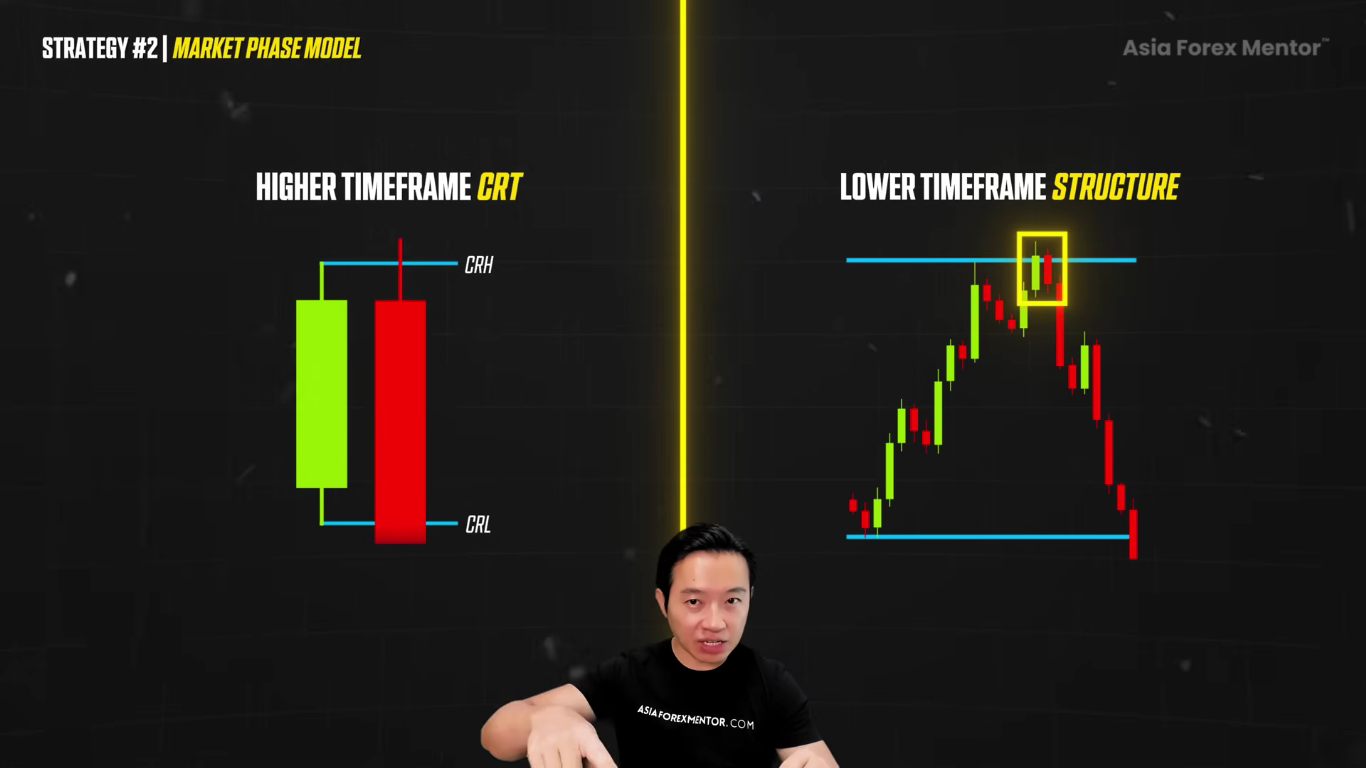
Did the structure break the other way to confirm the reversal back downwards?
Did price leave behind a fair value gap that gives us a clean entry, instead of us chasing a breakout that is late in the game?
And the pairing matters, because we need enough detail without turning the chart into a lot of noise.
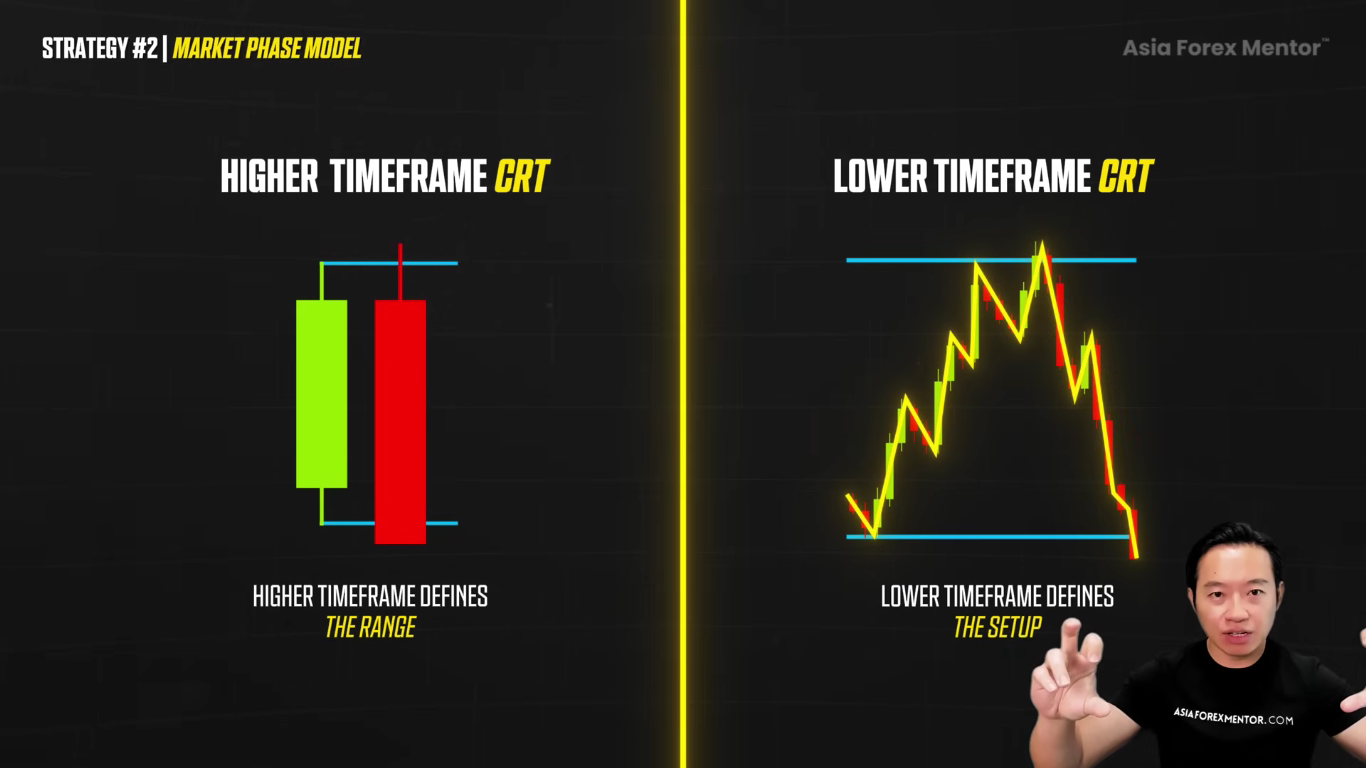
If you are analyzing the monthly candle, you drop to the daily to read the structure inside. If you're analyzing the four-hour candle, you drop to the 15-minute to find the entry logic. The goal is always the same: the higher timeframe defines the range,
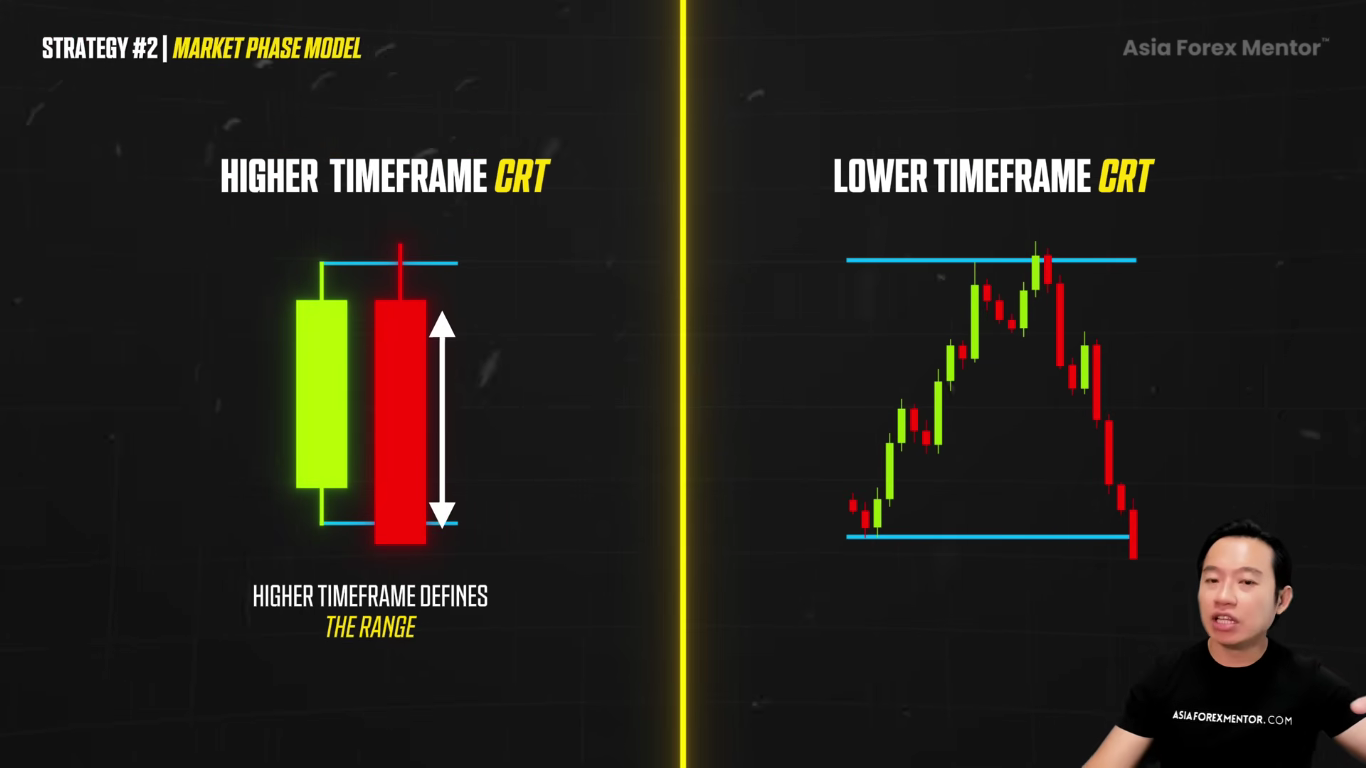
the lower timeframe defines the setup itself. Once this becomes a habit, CRT is no longer a guessing game. It becomes a process.
From here, we're going to level up even more by taking entries only when the risk-to-reward ratio is naturally in our favor.
If you are using the CRT only for reversals, you are leaving real money on the table itself. This is how you trade the CRT with the market with the trend, not against it like what I told you earlier.
Strategy 3 Trend Continuation CRT
So the question: can CRT be used in a way that follows the market direction, instead of fighting against the trend? Yes. And this is where CRT starts to feel less like a pattern and more like a professional model.
The first filter is simple. Only trade the CRT when the market is trending up or down. When there's no trend, you don't trade this methodology.
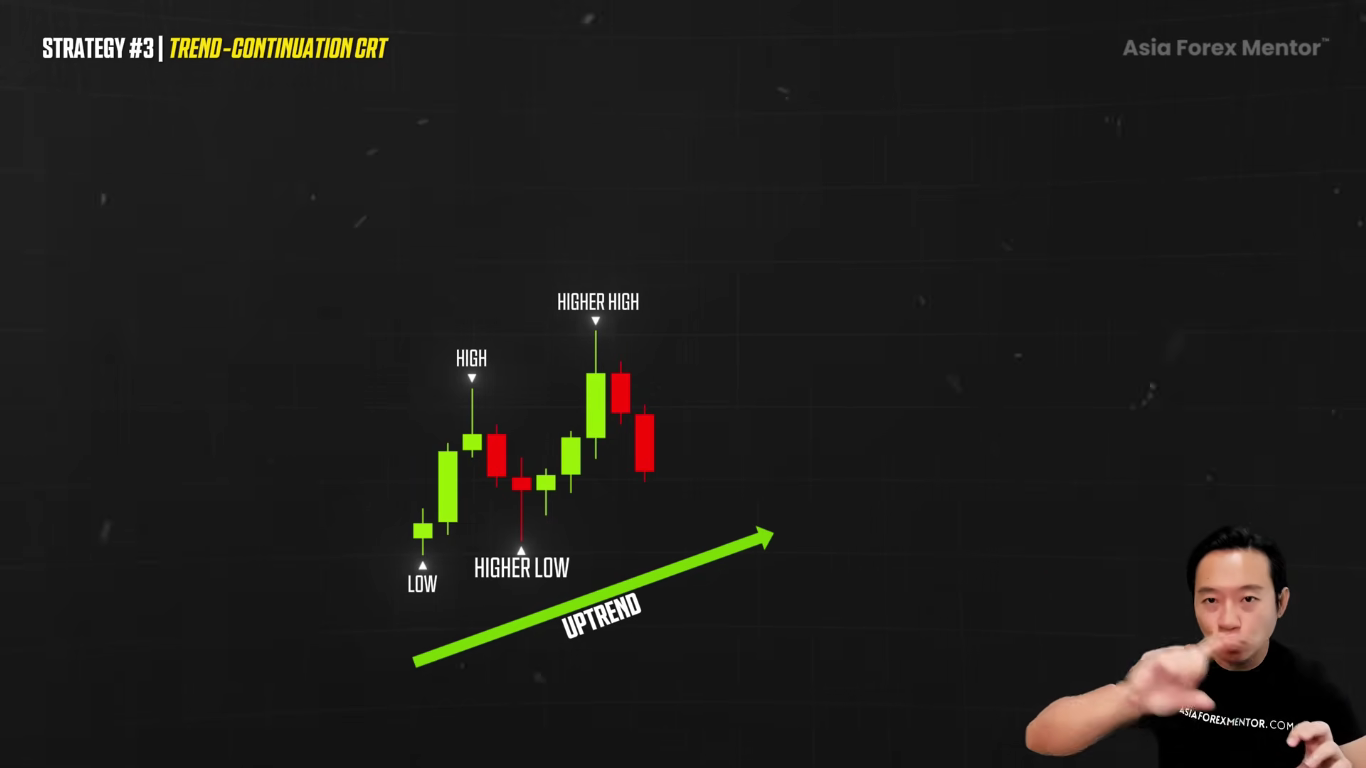
Once the trend is clear, we stop hunting for reversals. We start hunting for entries during a correction itself. A correction gives us two things: better prices, and a safer stop loss.
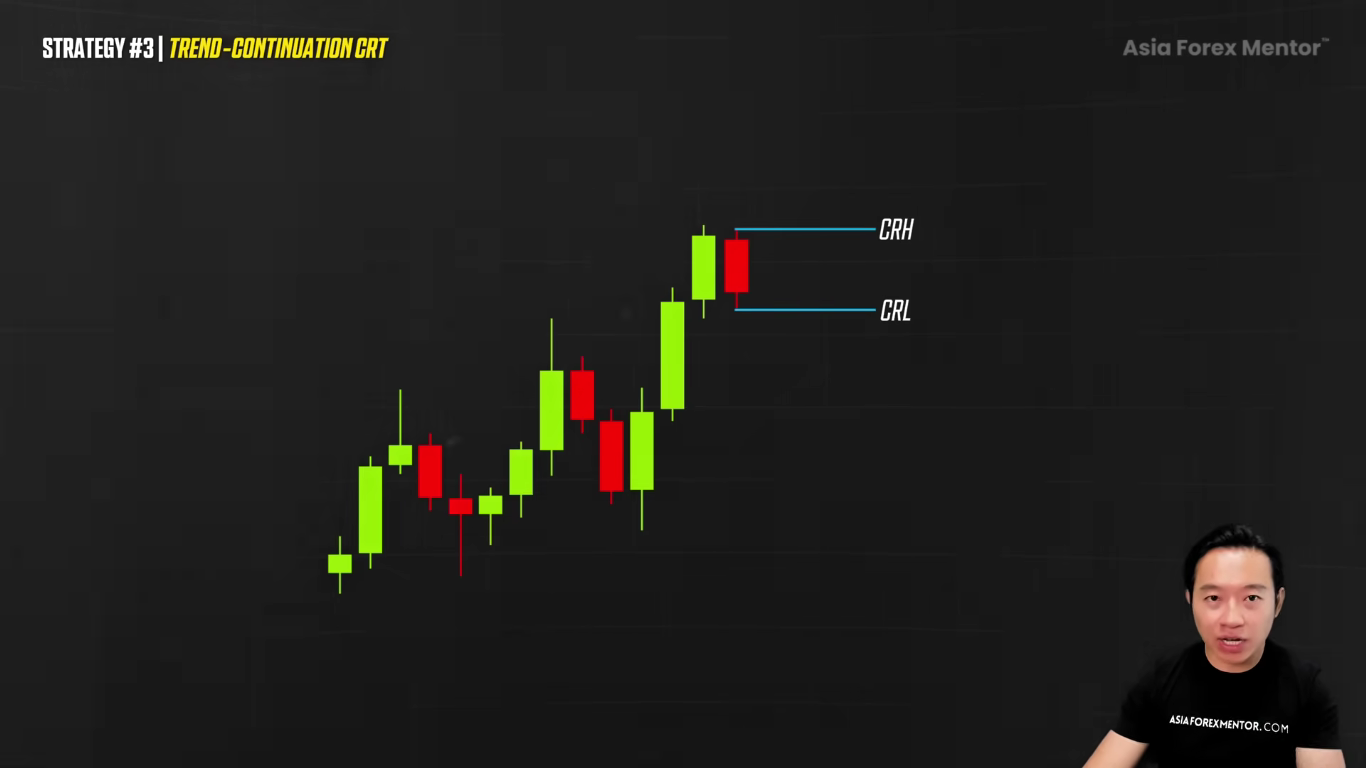
Imagine price makes an impulsive move up. Instead of buying at the top, we wait for price to pull back inside the impulse range itself. During the pullback, we apply the CRT but only on the pullback candles. In an uptrend, this means we are only looking for bearish candles.
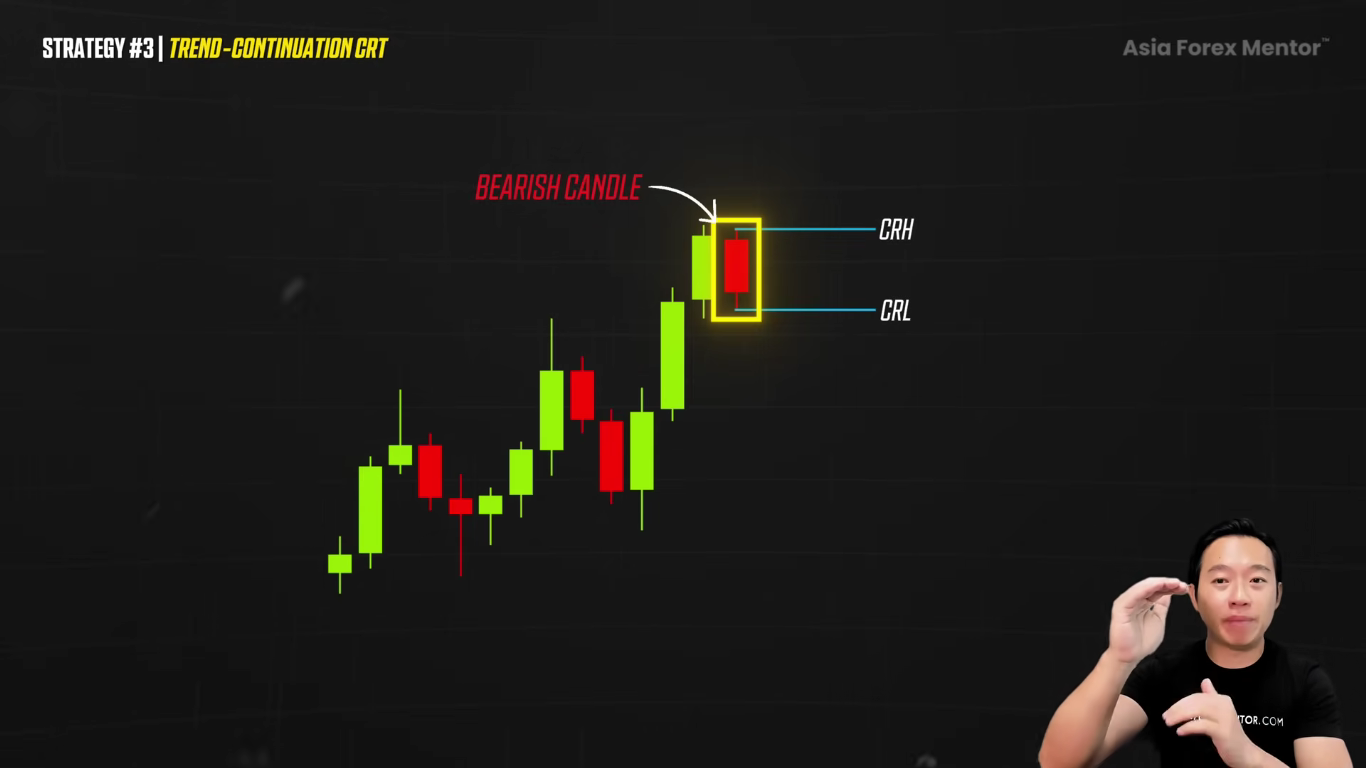
So we mark the high and the low of a bearish candle, and then we watch the next candle's behavior. The setup doesn't work if the next candle breaks below and closes under the range. Then we do nothing. We repeat the process on the next bearish candle again. We're going to keep doing it until we see the candle that matters: price goes below the low of the pullback candle, but it closes back inside the range.
This is the CRT signal. And here's the thing it is now aligned with the trend, instead of a reversal.
We've got the range candle, we've now got a sweep candle.
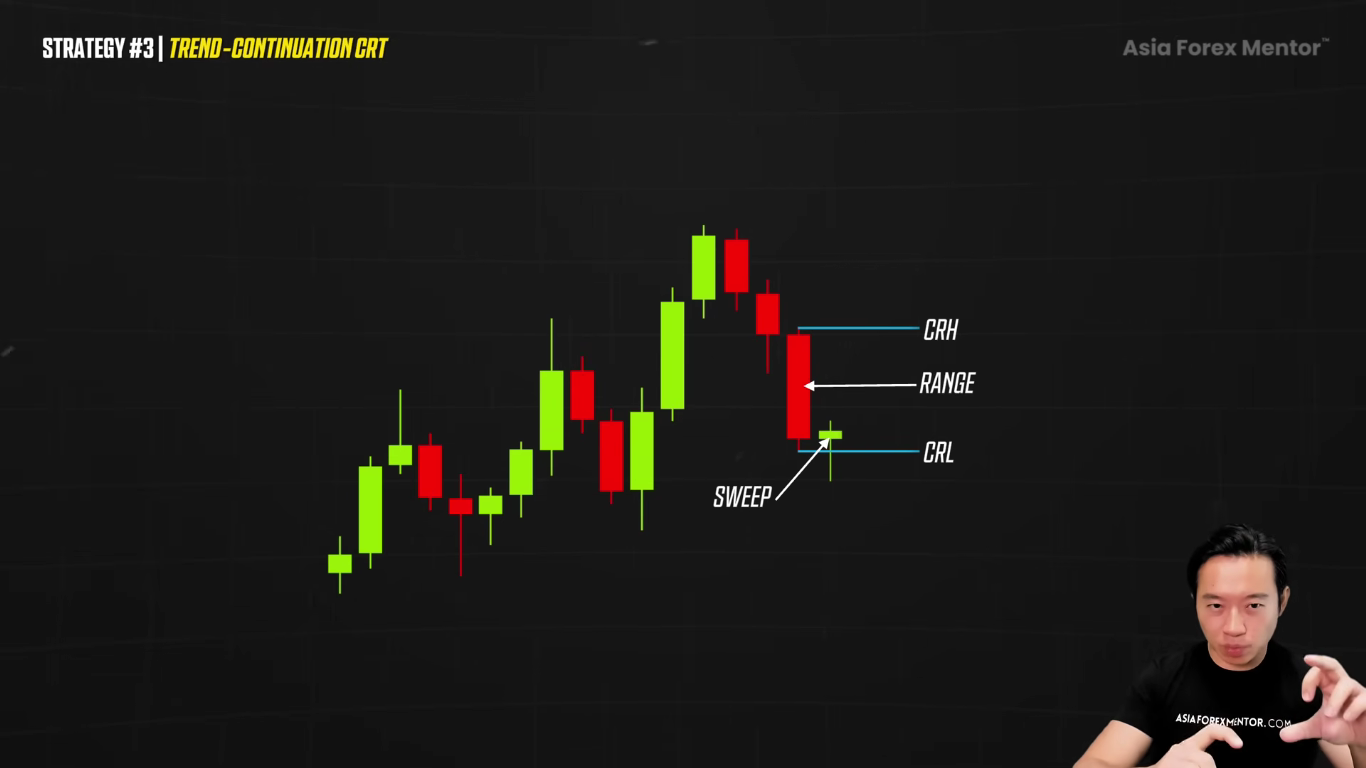
The only question now is the entry. The simple approach is buying right after the sweep candle closes.
That works. But like I said, we can do better. Because better entries give us better trades, we drop down to the lower timeframe to refine our execution.
Let's say the setup is on the one hour, for example you can drop to the 15-minute or the five-minute chart,
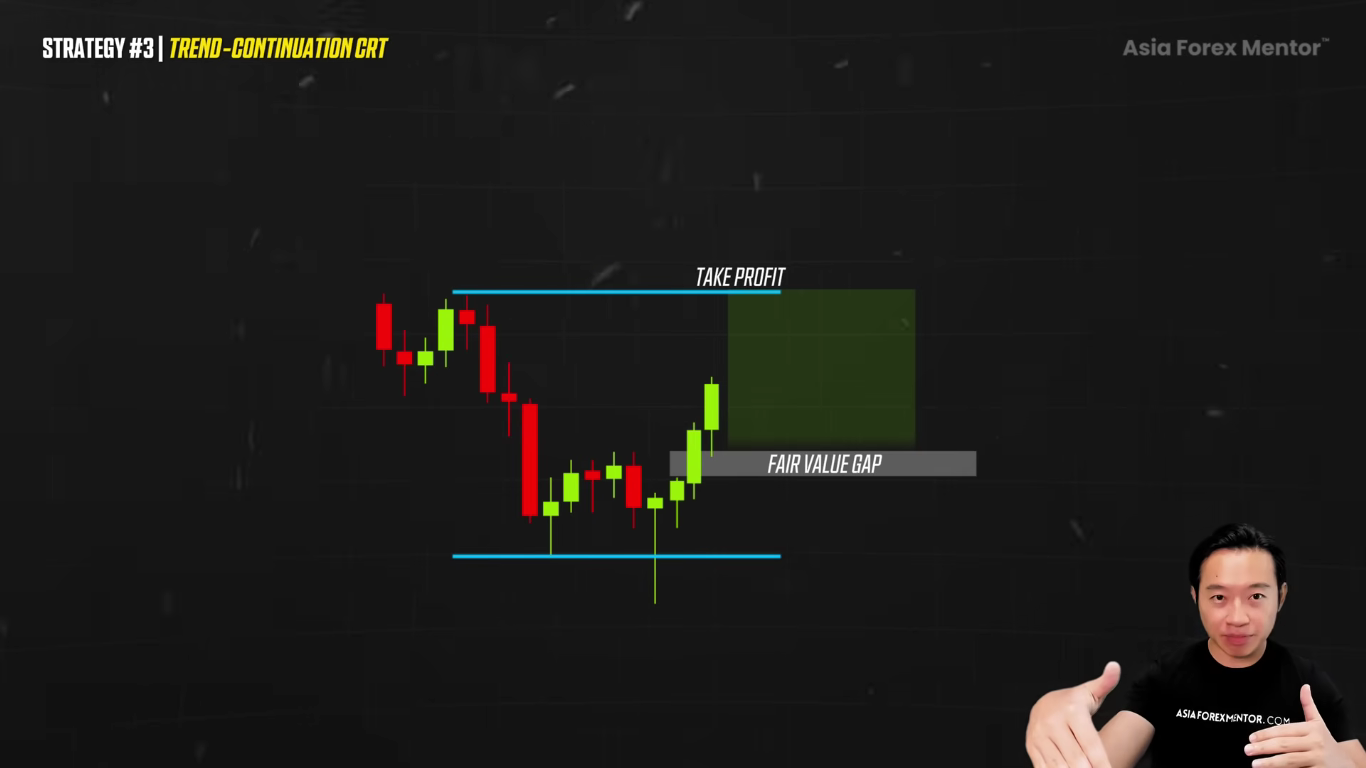
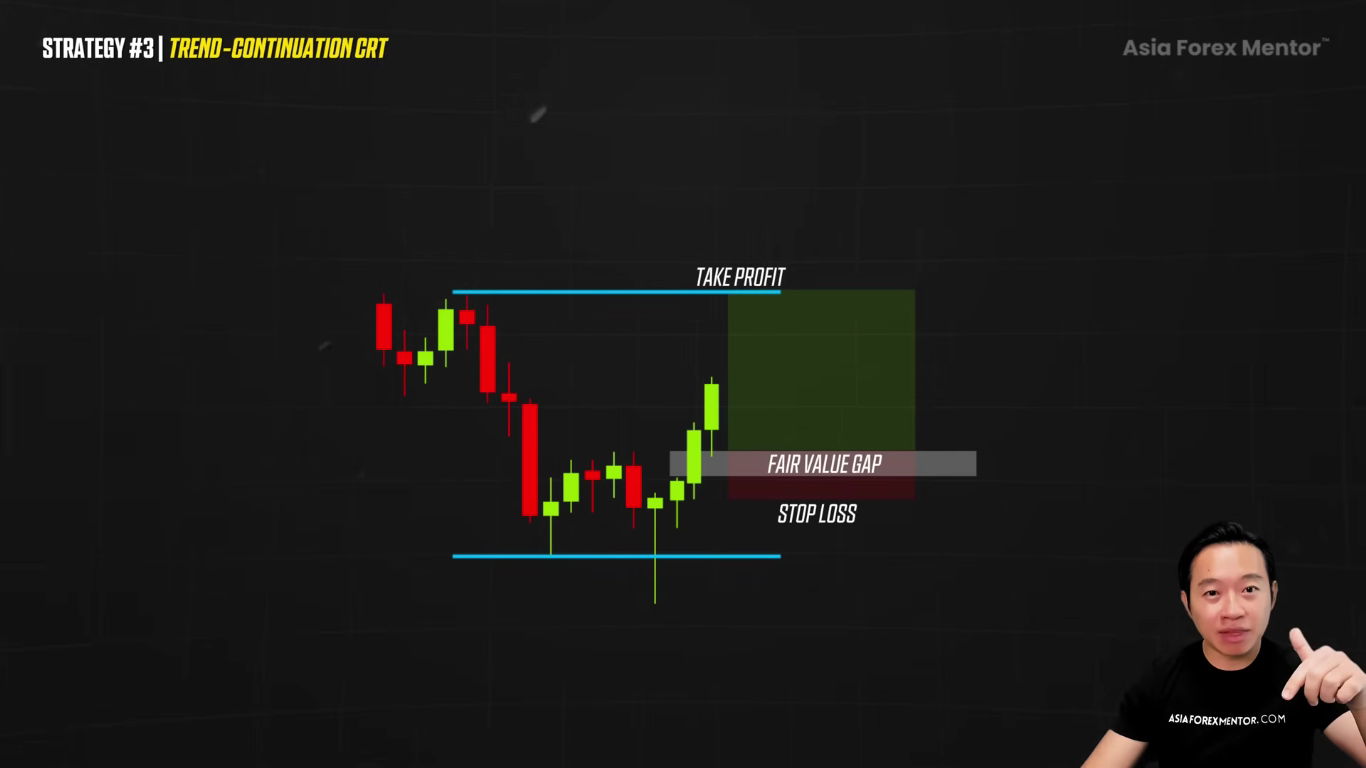
and we want to read the structure inside the sweep. What you are looking for is a fair value gap that is forming after the sweep.
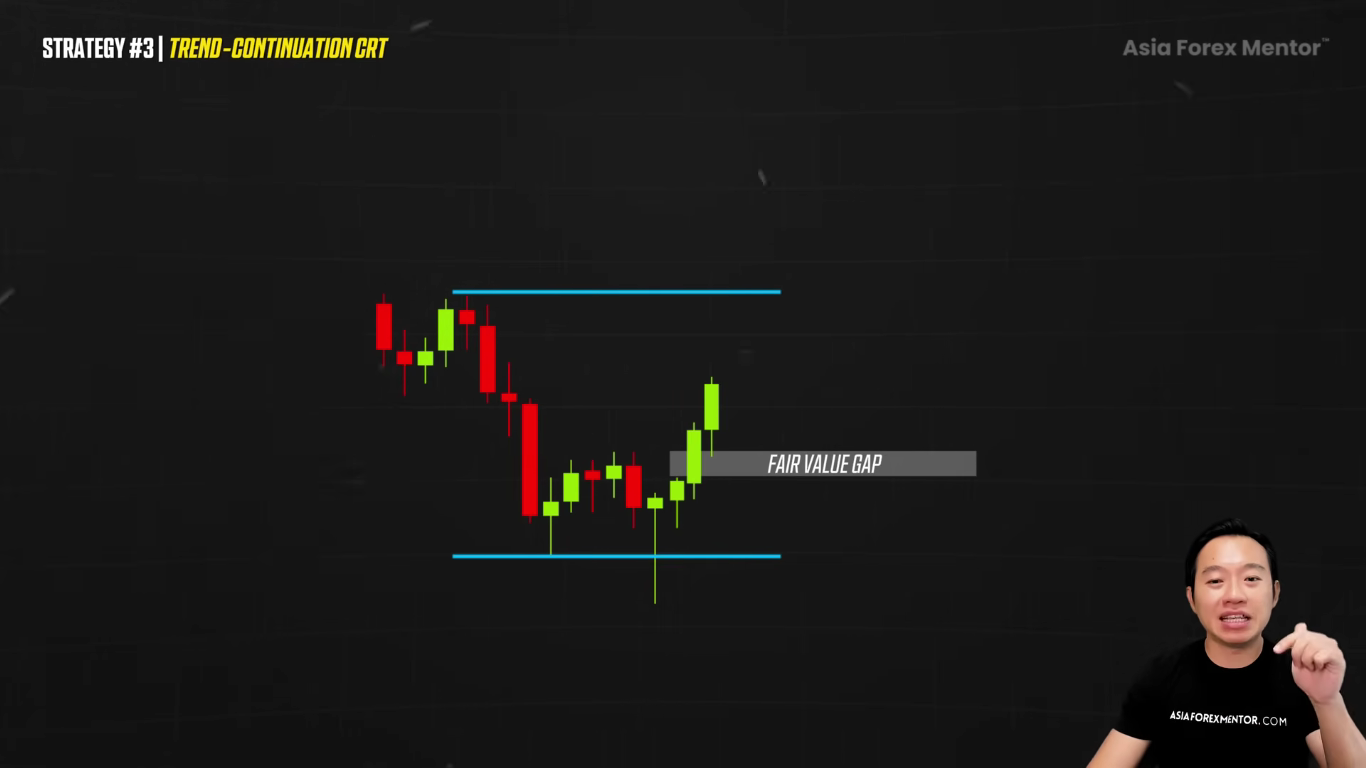
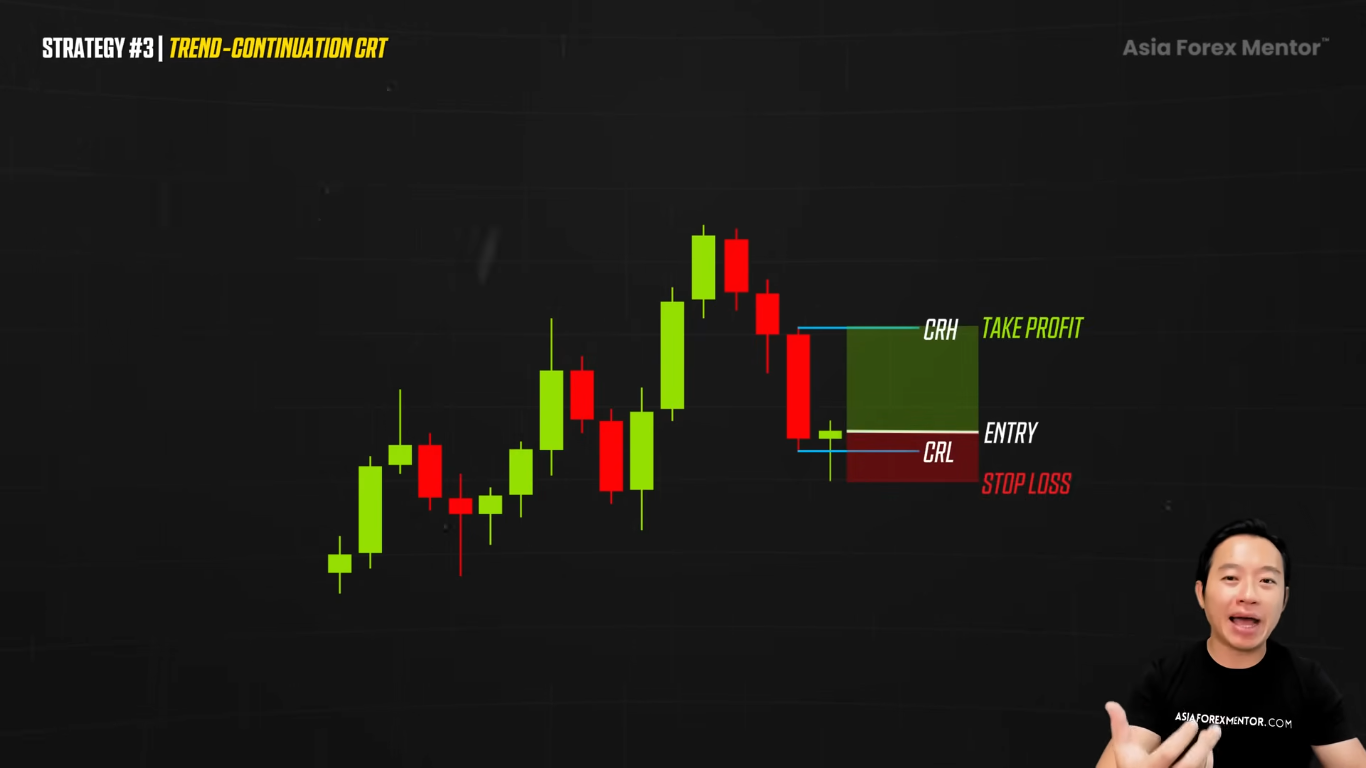
That gap becomes the entry zone itself. We place a buy order at the fair value gap.
Our stop loss, we place below the fair value gap. Then if price comes back to that gap and keeps pushing lower, the sweep failed the idea is wrong.
This keeps the trade clean. It's straightforward.
Now for our target, this is where we can do multiple things. There are a few ways to play it.
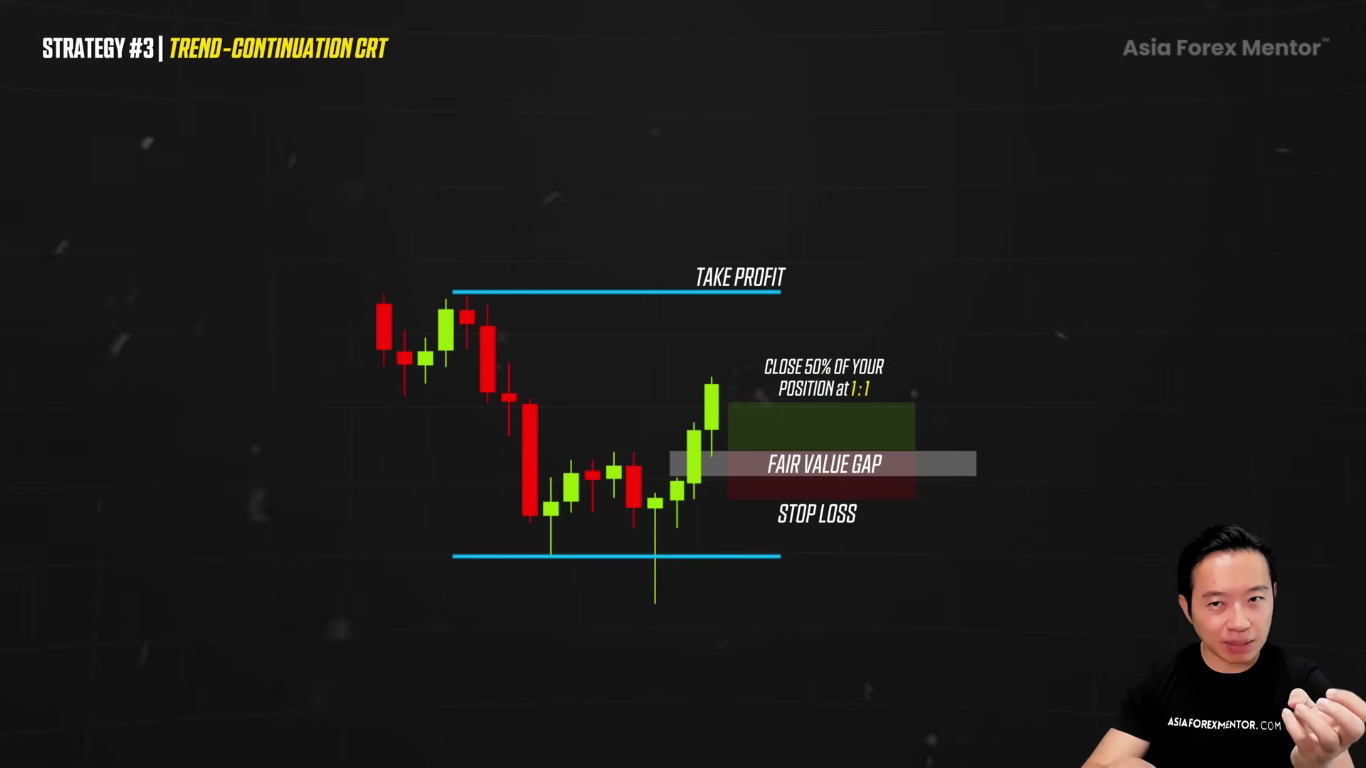
For example, you can simply place your take profit at the higher timeframe take profit level the range of the higher timeframe. Then you've got yourself an insane risk-to-reward.
Here's what you can also do. You can take partial profit when price reaches a risk-to-reward ratio of, let's say, one to one. Secure something first, and then the rest of the position becomes a runner.
So this is trend continuation. Our job is not to predict where the top is. Our job is to stay in the move as long as the market keeps paying us.
Putting CRT Together
The CRT, the candle range theory, is not just about three candles. First, we talked about the one candle that defines the range. The next one performs the sweep. The third one gives us the entry. This is the raw reversal engine.
Then we went deeper. We uncovered the real driver behind it: the AMD. The accumulation builds the liquidity. The manipulation grabs it. And then the distribution delivers the move itself. Once we see these phases, we stop counting the candles. We start reading the structure.
Then we refine the execution with timeframe alignment, where we drop down to a lower timeframe. This gives us the confirmation and the precision. We added the fair value gap and the change of character. And then we talked about strategy number three: we don't just trade reversals we can trade aligned with the trend with CRT too. We wait for the correction, we apply the CRT during the pullbacks, and then we enter through the fair value gap.
This is where we can now use this methodology to trade both directions: trend continuation and trend reversal. So CRT becomes a system itself.
What To Do Next
I want to give you something that's going to change the way you trade forever.
I've put together a free training that walks you through the exact three-step system that I use to find high-probability trades, with sniper-level entries, real risk control, and zero guesswork.
This is the same system that I use myself, and the same one that has helped thousands of traders go from frustration to consistent wins. And I'm giving it to you for free. There's no fluff, no filler, just pure strategy. If you've ever wanted to trade with clarity and real conviction, this is the place to start.
👉 FREE 3-Step Training: https://bit.ly/Free-3-StepTraining
Frequently Asked Questions
What is CRT (candle range theory) in trading?
CRT, candle range theory, is the idea that every candle holds its own range from its high to its low. The high becomes one liquidity level and the low becomes another. Price constantly reacts to these two points, and when the market attacks one side and fails to continue, it often shifts towards the opposite end of the range.
What are the three candles in a CRT setup?
Candle one defines the range, its high is the candle range high and its low is the candle range low. Candle two performs the sweep and proves the manipulation, pushing past one side but closing back inside the range. Candle three gives the entry after the momentum shifts, with the goal of reaching the opposite end of the range.
What is the AMD in CRT trading?
AMD stands for accumulation, manipulation, and distribution. Accumulation is when price stays tight and builds liquidity. Manipulation is the sweep that grabs the stops on one side. Distribution is the real move towards the opposite pool of liquidity. Once you read these phases, you stop counting candles and start reading structure.
Can CRT be used for trend continuation, not just reversals?
Yes. You only trade it when the market is trending, then you wait for a correction and apply the CRT on the pullback candles. When a pullback candle sweeps its low and closes back inside the range, that's the signal, now aligned with the trend instead of fighting it. You refine the entry on a lower timeframe using a fair value gap.
What timeframes work best for CRT?
The higher timeframe defines the range and gives you the idea; the lower timeframe gives you the evidence and the entry. The pairing matters: if you're analyzing the monthly, drop to the daily; if you're analyzing the four-hour, drop to the 15-minute to find the entry logic.