
USD/JPY Price Forecast: Fluctuates Around 151.00, Tests Key Technical Levels
The USD/JPY pair continues to trade in a narrow range around 151.00, with investors watching for any potential breakout as it tests crucial technical resistance levels. Recent market activity has seen fluctuations in the pair, but it remains largely stable, indicating the struggle between bullish and bearish forces in the short term. Amid broader concerns […]
How To Use The ADX Indicator
Forex traders live by the mantra the trend is your ally. The concept is simple, if the course of a trend is powerful then investors can reduce the risk and improve the potential for higher earnings. But how can they predict the direction a trend is taking? Especially in today’s dynamic world where a political […]
The Expansion of Decentralized Finance (DeFi)

In the rapidly evolving world of finance, a groundbreaking trend is taking center stage: Decentralized Finance (DeFi). This revolutionary concept is reshaping our understanding of financial transactions, moving away from traditional centralized financial institutions. DeFi stands as a beacon of innovation, leveraging the power of blockchain technology to democratize finance, making it more accessible and transparent. The allure of DeFi […]
What Are Security Token Offerings?

In the ever-evolving landscape of financial markets, Security Token Offerings (STOs) have emerged as a revolutionary method of fundraising. Distinct from Initial Coin Offerings (ICOs), STOs provide a regulated and secure avenue for raising funds. They bridge the gap between traditional securities and digital assets, offering a plethora of investment opportunities for both retail investors and seasoned financiers. Understanding Security Tokens A security token offering is a digital representation of real-world assets such as stocks, […]
How to Trade the Bullish Stalled Candlestick Pattern
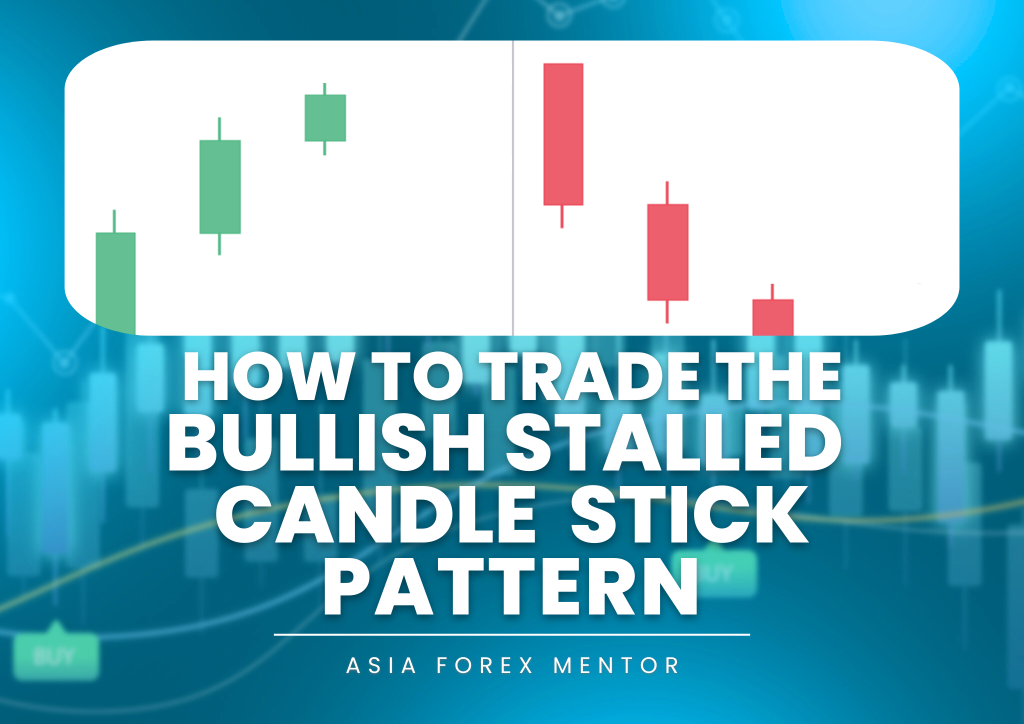
The bullish stalled candlestick pattern is a technical analysis tool that can provide valuable insights for traders, especially when navigating volatile markets. Recognizing and effectively trading this pattern can help identify potential bullish reversals and optimize trading strategies. This candlestick pattern, known for its distinctive formation of three successive candles, signals a potential shift in […]
Fibonacci Circle What It Is and How It Works in Trading
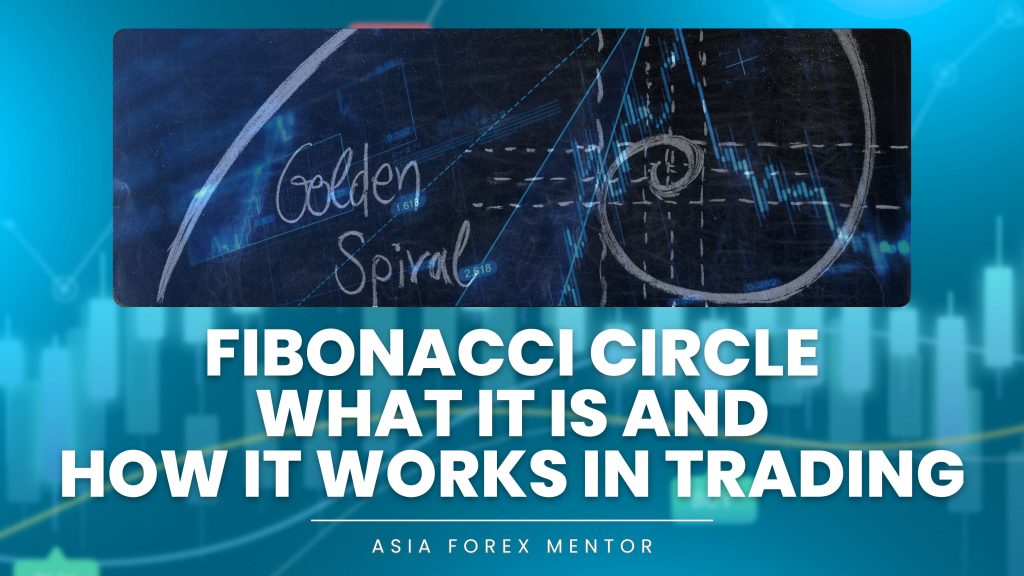
Have you ever wondered how the Fibonacci Circle helps explain why prices stop or reverse at certain points on a chart? It’s built on the Fibonacci sequence and golden ratio , guiding traders through market dynamics and future price movements. Each circle is drawn between two extreme points along a trend line, marking potential support […]
How To Use Dow Theory
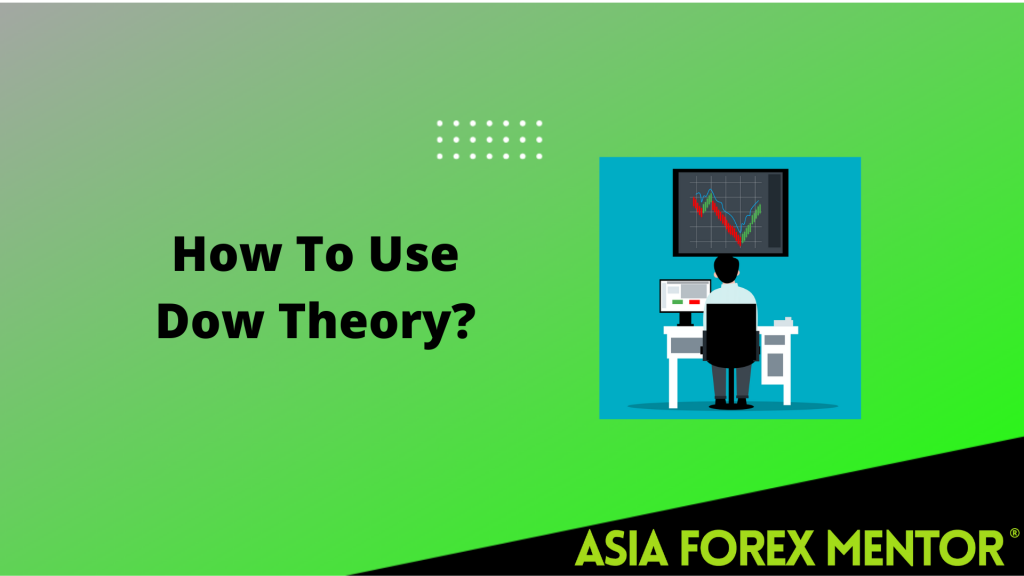
Technical analysis is the cornerstone of trading strategies used by day traders. Dow Theory has been in use for decades and is one of the oldest concepts. The theory was created by Charles Dow for the Wall Street Journal . He was convinced that the stock market is a dependable indicator of economic circumstances. Using […]
How to Transfer Stocks from Robinhood
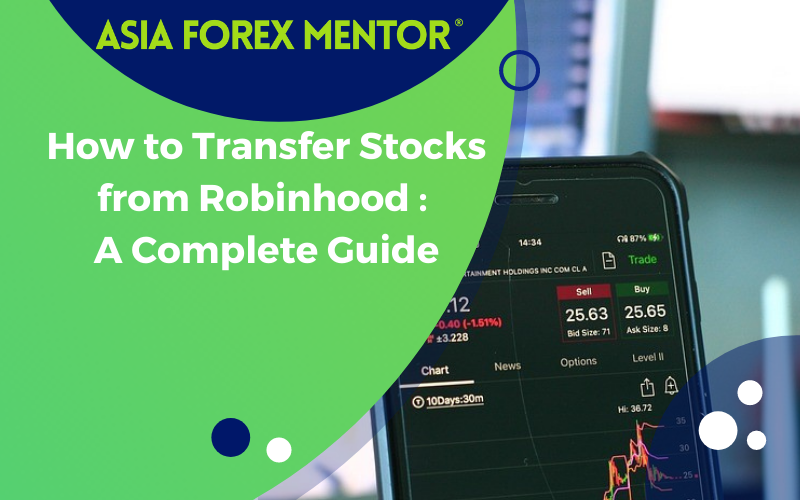
How to Transfer Stocks from Robinhood So, you want to transfer stocks to another brokerage platform. Perhaps you got into the swing of things and want to try out a new trading strategy. However, your broker does not provide such a feature. Perhaps you realize that you can get a better deal with another broker […]
Discover What an ECN Forex Broker Is
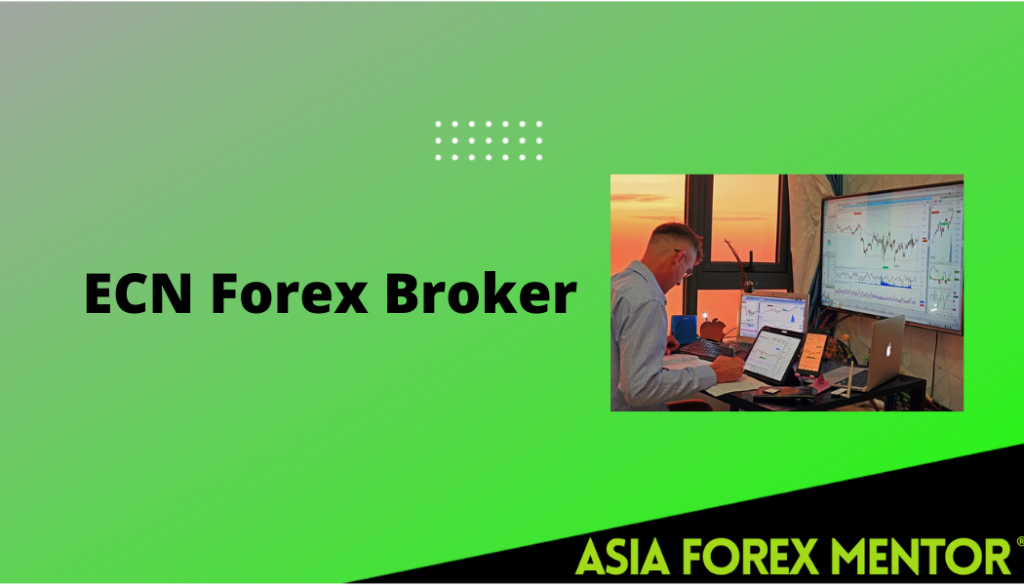
Forex trading has grown a lot, especially in the last decade or so. Traditionally forex trading (foreign exchange) was reserved for central banks, large hedge funds, and a few wealthy investors. Today anyone can take part in the buying and selling of foreign currencies. This has been made possible by forex brokers. Initially, it was […]
Stop Market Orders: What Are They & How Do You Properly Use Them?
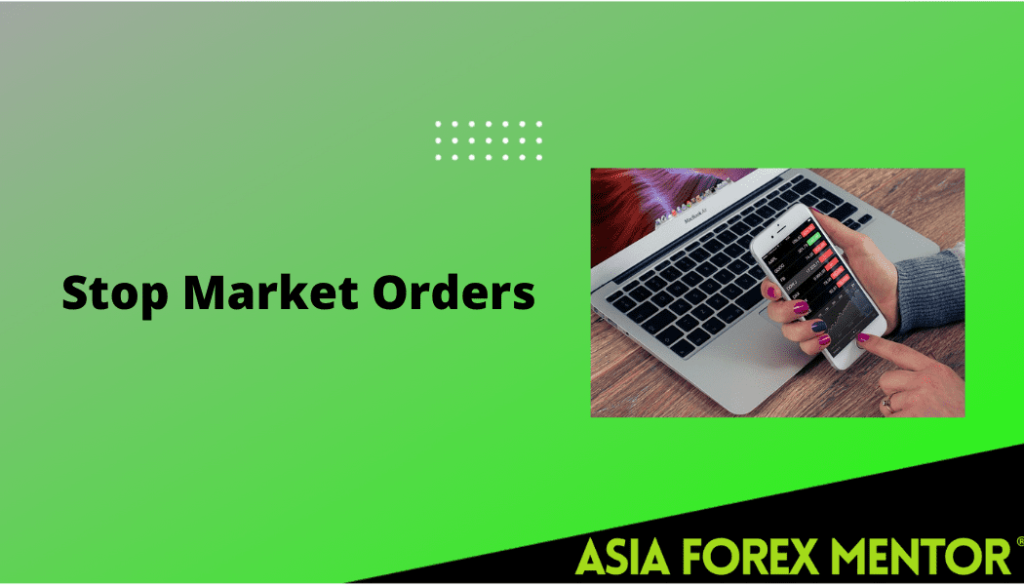
When Trading stock on a brokerage account, there exists a wide array of stock order types you can use. Some of these order types get executed by the broker immediately, while others only get executed at a certain level (be it a specific time or market price level.) It’s therefore highly essential that every trader […]
How to Use Leading and Lagging Indicators for Success
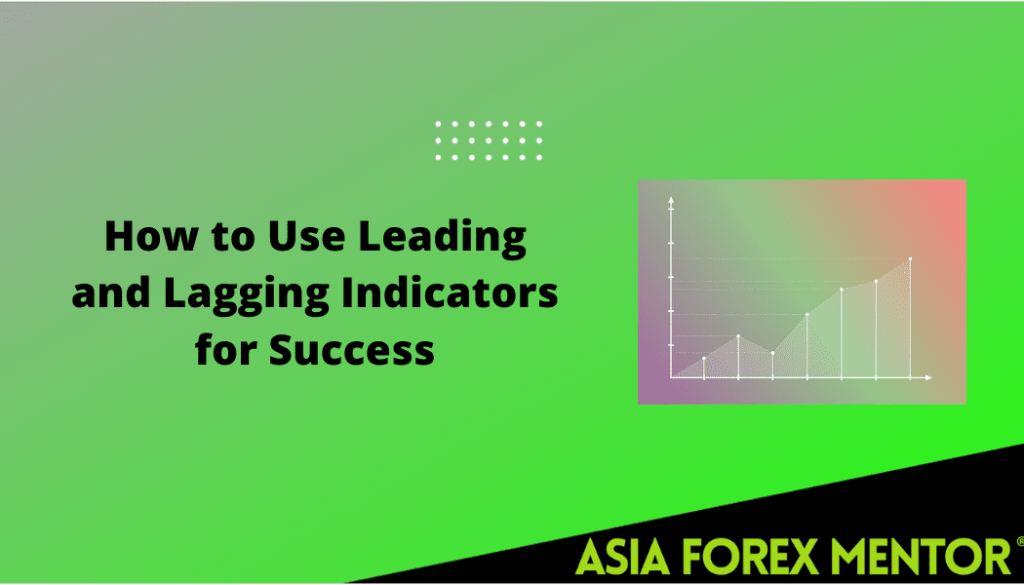
Organizations measure their performance levels with key performance indicators (KPIs). These are metrics, which show if the objectives are being met, and indicate options to improve performance. At the same time offering insight into aspects such as product quality, predictability, return on investment, and many more. The importance of KPIs is in their ability to […]
Psychology of Market Cycles
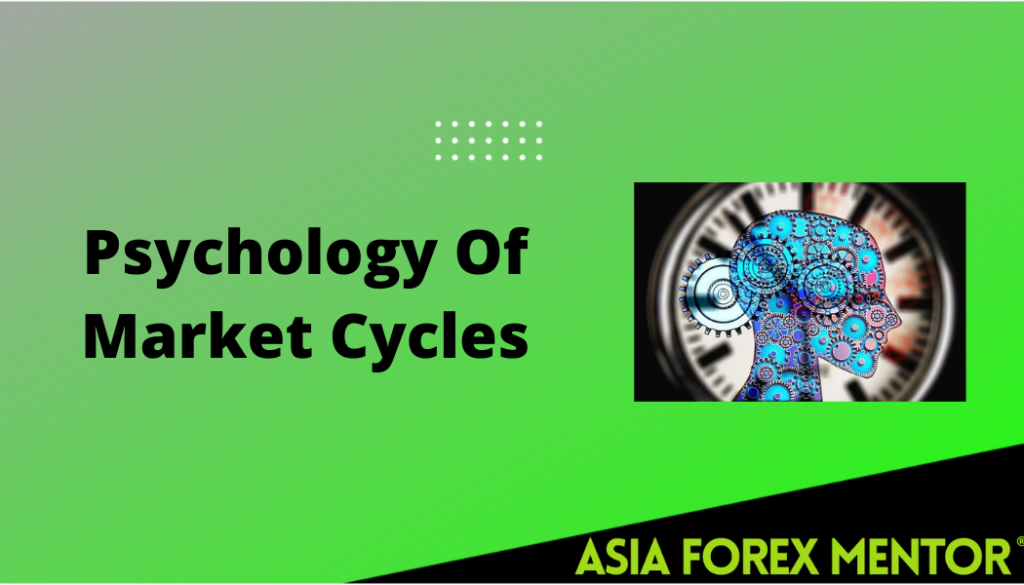
Financial markets are influenced by various reasons. Research has shown that however volatile these markets are, there is some sort of pattern. These patterns are somewhat influenced by the emotions of various stakeholders in financial markets. If you invest in the stock market, forex market or any other financial market, you need to understand what […]
Different types of cup and handle and what they mean
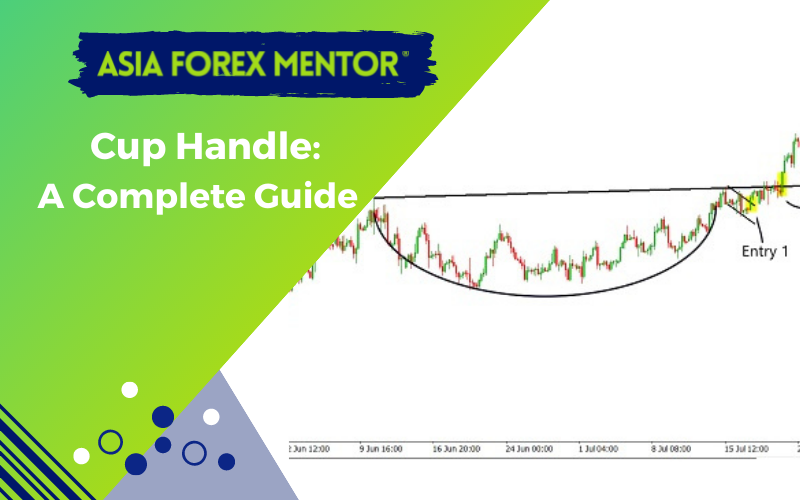
Introduction to Cup handle A cup and handle price pattern on a security’s price chart is a technical indicator that resembles a cup with a handle, where the cup is in the shape of a “u” and the handle has a slight downward drift. The cup and handle is considered a bullish signal, with the […]
How To Profit From Inflation? – Tips You Should Know
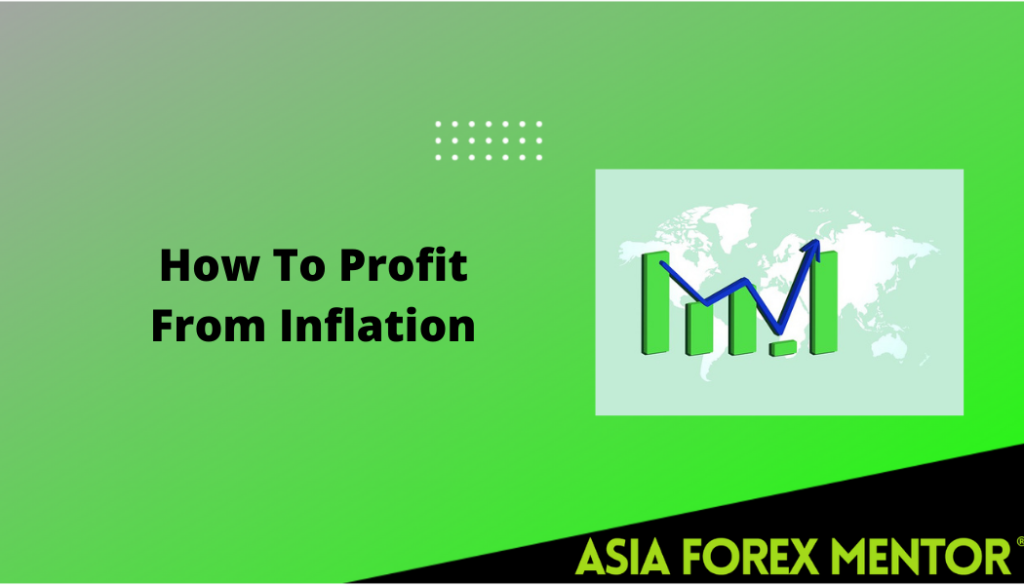
Contents Defining Inflation Basics of Inflation and Consumer Price Index Causes of Inflation Investing for Inflation – Pros and Cons Investing During Inflationary Periods – Pros and Cons Rising Prices or Rising Costs Effect of Inflation on Asset Values How to Profit from Inflation? Final Verdict FAQs Defining Inflation The high rate of increase in […]
What Is The Hull Moving Average?
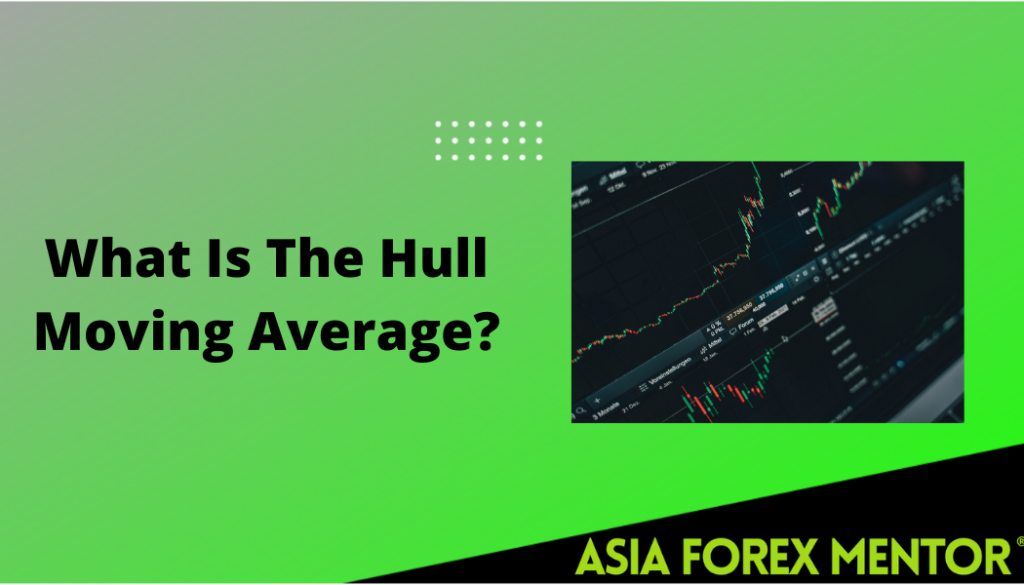
Contents What is the Hull Moving Average? Solves the Lag Problem Similar to Other Moving Averages Calculation of the Hull Moving Averages Weighted Moving Averages Settings for Hull Moving Average Indicator HMA and Simple Moving Average HMA in Trend Following Combining Hull and MA to Identify Crossovers Pros and Cons of the Indicator Conclusion FAQs […]
Best Technical Indicators for Day Trading
Best Technical Indicators for Day Trading Understanding the best technical indicators for day trading is useful for those interested in share trading, forex trading, and commodities trading. This is thanks to the special nature of day trading. Here, traders seek to buy and sell stock in one day and profit using the volatile stock indices. […]
Best Technical Indicators for Day Trading
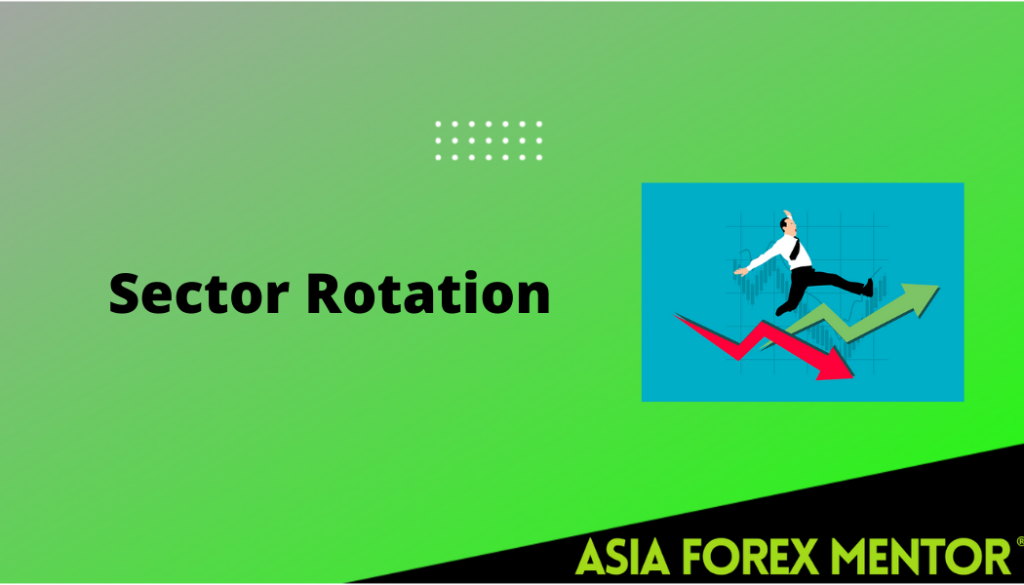
Contents What is Sector Rotation? How Does Sector Rotation Work? Economic Cycle that Triggers Sector Rotation Recession A Sector Rotation Strategy How Can Investors Take Advantage of Sector Rotations in the Stock Market? Importance of Sector Rotation Strategies Conclusion FAQs What is Sector Rotation? Sector Rotation is when investors move some capital from their stock […]
Forex Tutor – Everything you Need to Know

Everything You Need to Know About a Forex Tutor If you have been in the Forex game for a while, you will know that the whole process is much more complex than you think. Plus, maybe the free online resources you have been reading could not help you much either. What then? You will need […]
How Harmonic Pattern Helps You Maintain A Higher Winning Rate in Forex and Crypto Trading World

Harmonic patterns are technical analysis formations that can assist traders in analyzing price activity and forecast where prices may go. A trader can forecast where and how much the cost of an item will move by analyzing harmonic waves in price charts. Like all other pattern types, Harmonics are most effective when traded after they […]
What are Peaks and Throughs

Stagnating flat lines are not something synonymous with the stock market, prices fluctuate on the vertical axis, and trades rely on the Peaks and Troughs patterns that get created by the price action that is common for every security. Prices tend to move upwards and downwards, and the zigzag pattern is frequently used to describe […]

