
How to Read Crypto Charts
There is a growing interest in cryptocurrency. Perhaps you heard about it on Facebook or a trading forum. Most of what you hear is probably true. It is a new technological frontier and it is also notorious for having wild price swings. But this volatility makes trading cryptocurrency a viable option. As governments across the globe are creating the legal framework to facilitate cryptocurrency, many traders feel safe to dip their toes into the market. But for novice traders, it can get a bit tricky. Here, we will discuss one of the fundamentals: How to read crypto charts.
Content
- How to Read Crypto Charts for Beginners
- How to Read Crypto Candlestick Charts
- Using Tools on Cryptocurrency Technical Analysis Charts
- How to Read Crypto Charts – Patterns Recognition
- How to Read Crypto Candlestick Charts
How to Read Crypto Charts for Beginners
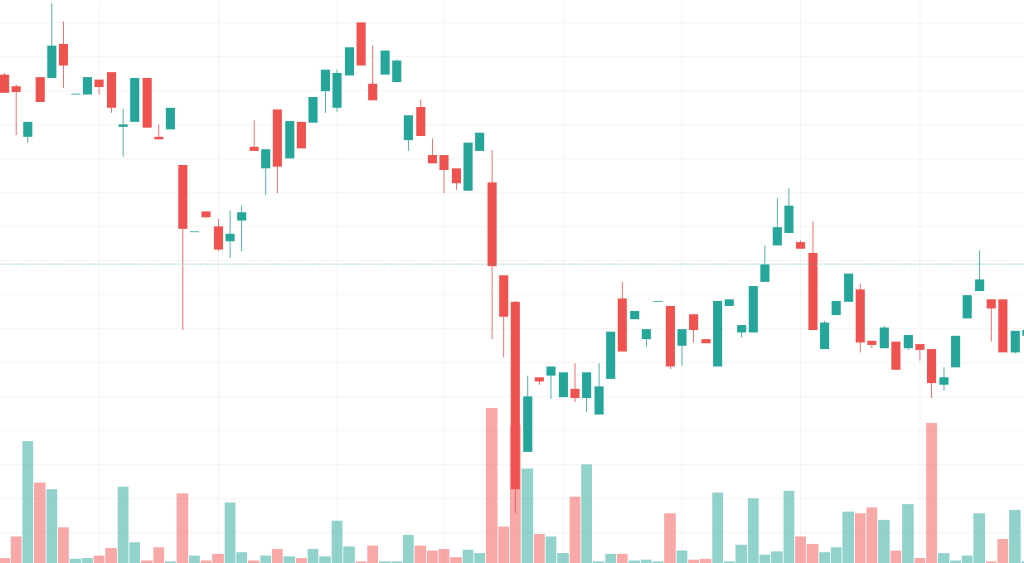
Cryptocurrency charts tell us about the current costs, trade volumes, and the general force of the market. A crypto trader uses this information to help them decide whether to buy or sell. All platforms follow the same process on how to read crypto charts – Binance, Coinbase, etc. Their charts share many features. There are some that beginners need to know to get started trading.
Also read: How to use binance
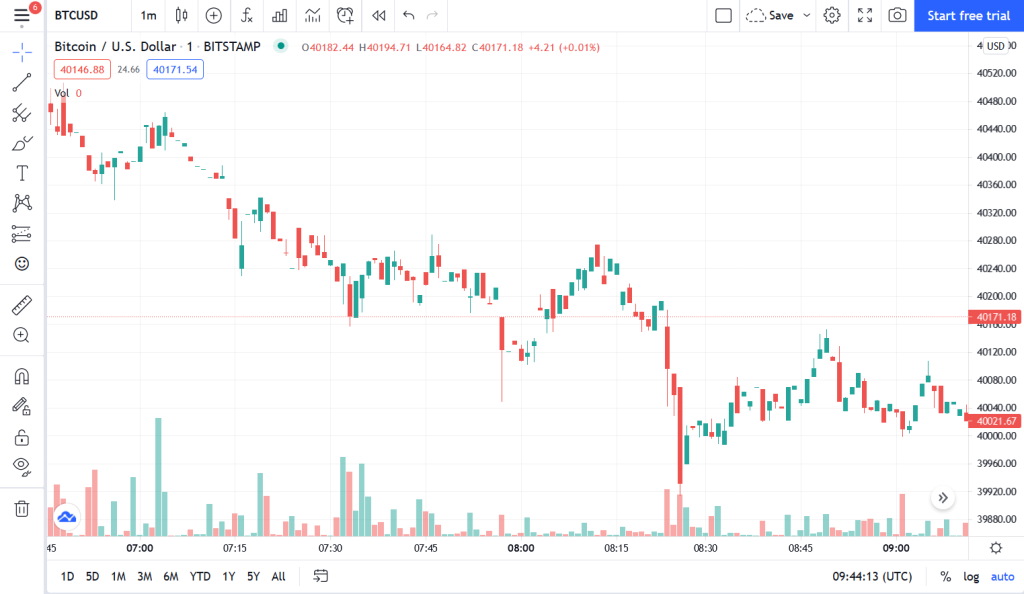
Time Frame
![]()
Time frame essentially narrows down your focus into a specific time period. This is a handy feature as it allows traders to monitor the market from various points of view. Think of it as a microscope. You can focus on the minute price movement in the 15-minute chart or take a step back and view the price movements in the last 24 hours.
Different time frame requires a different trading style. There are two distinct groups of traders: intra-day and long-term.
Intra-day traders, as the name suggests, limit their trading timeframe to 24 hours. They close their positions at the end of the day. These traders make a profit from the volatility during the day, and so they want to monitor every little price movement. For this reason, their preferred time frame would be 15-minute, hourly, 4-hour, or daily (24-hour).
Long-term traders, on the other hand, look at a larger time frame. That means anywhere from hourly to weekly charts. While intra-day traders profit off the market’s volatility, long-term traders rely on the overall trend to make money.
Also read: Is cryptocurrency a good investment
Market Cap
The market cap is the total value of all cryptocurrency of one kind that is currently in circulation. The formula is:
Market Cap = Total Coins in Circulation x Price of each coin
The market cap gives you a good idea of the coin’s stability. This piece of information can tell you whether you want to trade that coin or not. However, if you are new to the game, you can never go wrong with trading the top 10 cryptocurrencies such as Bitcoin and Ethereum.
How to Read Crypto Candlestick Charts
You most likely see this everywhere. Every trader loves this chart because it shows the price points where prices open and close. A candlestick represents a time frame, which could be seconds to a month depending on what time frame you operate on. This gives you an idea of where the market is headed among other things. When people how to read crypto charts, Reddit users usually assume you mean candlestick charts. There are a couple of things to look out for.
Time Selection
Different strategies call for a different timeframe. The charts give you a lot of flexibility, so pick one that suits your trading style. You can change the time periods based on your needs.
Volume
Volume represents how many cryptocurrencies are flowing at that moment, be it buy or sell. When scouting out a market in which to trade crypto, you want to see high volume. That means, you can buy or sell coins quickly. Plus, if there is a spike in trading volumes at the highs or lows of a trend, it could mean an imminent trend reversal as well.
Candles
The bars that travel horizontally along the chart are candlesticks. There are two variants: bullish or bearish. A bullish candle is green where the opening price is at the bottom and the closing price is at the top. A bearish candle is red, which price opens at the top and closes at the bottom.
Support and Resistance Levels
The charts do not show this, but traders prefer to eyeball it as it is easy to identify these levels.
The support level is an area below the lowest candle, which indicates that the price would never go beyond this point. The reason is that traders see that the price is sufficiently low enough, therefore increasing the buying pressure. So, they buy the dip and drive the price back up. By then, some traders would sell and profit from there.
The resistance level is a price ceiling. Prices never go any higher than this because there is an increase in selling pressure at that point. Traders feel like their coins would not go any higher than this price point, so they sell them, therefore driving the price down.
Support and resistance levels are not permanent. When a breakout occurs, usually after a period of a sideways movement, the price would either go above or below the support and resistance levels. This also results in an explosive price movement where a lot of money is gained or lost. After this breakout, a new support and resistance level would be created.
Normally, the old resistance level would become the new support level, and the old support level becomes the new resistance level after an uptrend or a downtrend, respectively. When the price peaks or dips close to either level, this is a “test”. The more the level is tested, the weaker it becomes. With the combination of indicators, traders can spot the trend early and prepare for a breakout.
Also read: How to day trade crypto
Using Tools on Cryptocurrency Technical Analysis Charts
For a novice trader, the charts look complex. But this is a pretty barebone chart. If you want to make the most out of your trades, you want to use other tools. They can tell you about an imminent trend before it happens, allowing you ample time to capitalize on the price movement.
Traders usually use at least two tools to cross-check one another. Plus, having different tools active at once can give you more information about the market, which allows you to make better trades. Tools are super helpful for beginners and veteran traders alike.
TradingView
It is free and has loads of indicators to choose from. Many traders swear by this technical analysis tool to enhance their trading game. Setting it up is a breeze and it monitors all markets, be it cryptocurrency, forex, stock, etc. But if you dislike it for some reason, it is not the be-all-end-all tool since there are plenty of others to choose from.
Fear and Greed Index
This indicator uses a variety of data to draw a graph for you. The graph ranges from 0 to 100, ranging from fear to greed respectively. If the reading is below 20, there is an extreme fear in the market. What this tells you is that the crypto price is low and there could be an imminent uptrend, or a bullish reversal. On the other hand, if the reading goes above 80, there is extreme greed and a potential for a downtrend, or a bearish reversal.
As you can tell, this indicator attempts to produce an estimation of the overall sentiment in the market. Market sentiment can drive a trade either way, so when the chart shows a noticeable spike, traders have to prepare for a trend reversal.
How to Read Crypto Charts – Patterns Recognition
Other than indicators, traders also learn to spot certain candlestick patterns. That, coupled with indicators, can provide a pretty accurate estimation of the market’s movement in the near future. This gives traders the confidence to set up their trades to make the most out of the price movements.
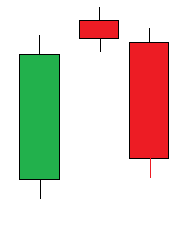 For instance, we have the evening star candlestick pattern. It may appear at the peak of an uptrend with the first large bullish candle (green). This is the result of buying pressure to continue the uptrend. This candle is followed by a small bullish candle (red), which tells us that the uptrend is about to run out of steam. At this point, the trend is slowing down and the market is in a precarious position. The third candle in this pattern is a large bearish candle, which shows a real sign of selling pressure. Subsequent candles would show that the market is going on a downtrend.
How to Read Crypto Candlestick Charts
As you can see, the crypto market is quite complex. Learning how to read crypto charts on Robinhood or any other platform is not easy. Traders cannot get far without the aid of indicators and patterns. Unfortunately, learning all of these things take time and even then, success is not guaranteed. The market is pretty ruthless, and a bad trade can see you losing a lot of money.
Luckily, you do not have to download a “How to read crypto charts” PDF book. Many traders enroll in trading courses to improve their skillset. AsiaForexMentor has just the program you need. With our One Core program, we will equip you with the knowledge and skill necessary to trade in virtually any market with a chart. Our ROI-based trading system helps you identify high-probability trading opportunities such as how to read crypto charts to help you make smart and effective trades.


