Stochastic Indicator
Stochastic is one of the most popular momentum oscillator tools in a forex trader’s toolbox. It is similar to another momentum oscillator indicator, the RSI indicator, but has a unique approach to measure momentum that allows us to gain some useful insights. Here, we will talk about the basics of the stochastic indicator and how you can turn a profit from it.
Stochastic Indicator – Quick Setup Tutorial
Contents
- Stochastic Meaning
- Stochastic Indicator Definition
- Stochastic Indicator vs RSI
- Stochastic Oscillator Forex
- Stochastic Indicator Settings
- Stochastic Oscillator Strategy
- Stochastic Oscillator Pros and cons
- Stochastic Oscillator Analysis
- Conclusion
- Infographic
Stochastic Meaning
The stochastic oscillator helps identify overbought and oversold conditions and the momentum behind the price changes. Since the stochastic oscillator relies on the market’s price history, the signal tends to vary around the mean price level. The formula for the stochastic oscillator is:
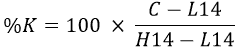
Where:
– %K is the current value of the stochastic indicator
– C is the latest closing price
– H14 is the highest price traded in the last 14 sessions
– L14 is the lowest price traded in the last 14 sessions
Traders sometimes call %K the slow stochastic indicator. %D, which is the moving average of %K in the last three trading periods, is called the fast stochastic indicator.
Stochastic Indicator Definition
The creator of the stochastic oscillator provided a beautifully simplified explanation of what the stochastic oscillator is. It measures the momentum of price, so think of it like a rocket going up. It cannot just turn and fall down in an instant. It slows down first, then dips its nose before the dive. What do we learn from this? Momentum change comes first before the change in direction, and that rule also applies in forex.
Stochastic Indicator VS RSI
Both, the stochastic oscillator and RSI indicators, are momentum oscillators, meaning that they are both used to predict market trends. However, how they go about achieving that is the main reason why they are so different. Although the RSI indicator is more widely used among analysts and traders alike, both are excellent indicators.
RSI Simplified
RSI was developed by J. Welles Wilder Jr. It compares recent gains to recent losses in a market. The RSI indicator measures overbought and oversold conditions by looking at the velocity of the price movements. The RSI forex indicator is displayed as a line with a value from 0 to 100, with 50 being the midline point. If the RSI indicator crosses over 70, that indicates an overbought condition. If the number dips below 30, it is an oversold condition. The RSI indicator can also be used to identify the support and resistance zones, to identify potential trend reversal points, or to verify the signals coming from other indicators such as Bollinger bands forex or trendline trading.
Further read: RSI Forex Indicator
Stochastic Oscillator Simplified
The stochastic oscillator was developed by George land. It works on the assumption that the closing prices should close in the same direction as the trend. Similar to the RSI indicator, the stochastic oscillator displays a value from 0 to 100. If the lines peak above 80, that indicates an overbought condition. If they drop below 20, that is an oversold condition.
Unlike the RSI indicator, the stochastic oscillator displays two lines. One that reflects the true value of the oscillator for the session and the other being an average value of the last three days. For instance, a market with a bearish trend with prices dipping for newer lows and the stochastic oscillator displaying higher lows suggests that the trend is about to lose its momentum and a trend reversal is near. For the RSI indicator, such a divergence also suggests the same thing.
RSI or Stochastic Oscillator
So, which one is better? That depends on the market. The RSI indicator performs better in a turbulent and volatile market with lots of ups and downs in consistent ranges. On the other hand, the stochastic oscillator does well in a market with a sideways trend.
Stochastic Oscillator Forex
The stochastic oscillator is an indicator among a plethora of others in the forex platform to help traders identify the momentum of the price change and identify potential trend reversals. The momentum is calculated by comparing the closing price to the trading range over a certain period of time.
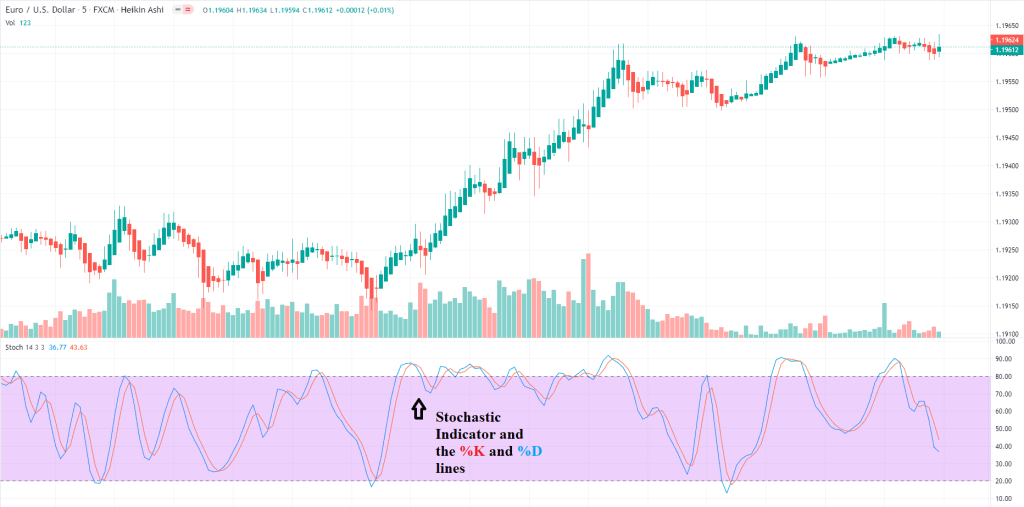
The stochastic oscillator draws two lines: %K and %D. The %D is simply a reflection of the 3-day simple moving average of %K. There is not much going on until the two lines intersect, which indicates that a pullback or a shift in trend may be imminent.
For example, suppose that you are looking at the chart displaying GBPUSD with a bullish trend with the stochastic oscillator indicator. Then, you notice the indicator displaying a downward cross through the signal line. That means, the latest closing price is closer to the lowest low of over the look-back period than it has been in the last three sessions. That means that the trend may start to lose steam allowing a pull back or reversal to take place even though it is strong in the bullish momentum.
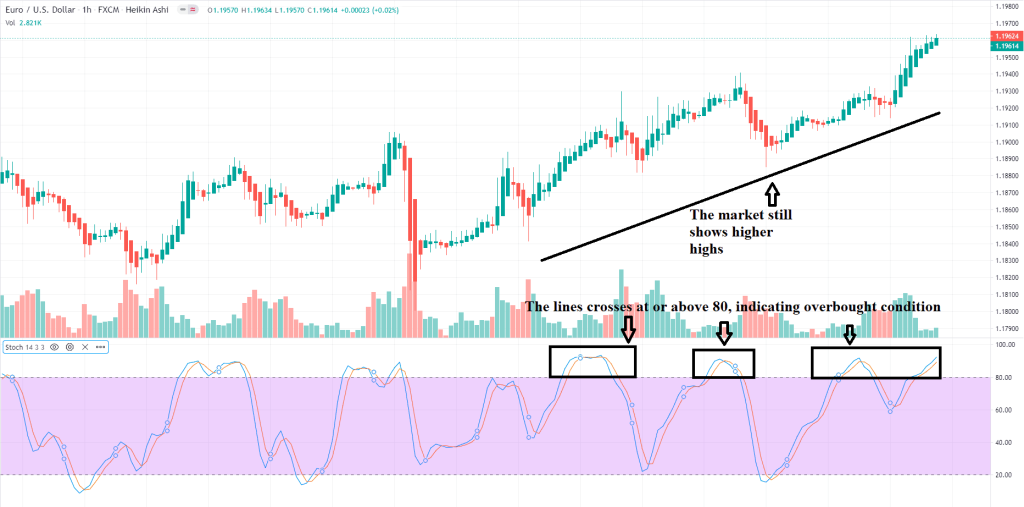
Similar to other momentum oscillators such as the Relative Strength Index indicator, the stochastic oscillator can also be used to determine overbought or oversold conditions. It has a range from 0 to 100, with the value over 80 indicating overbought conditions and 20 indicating oversold conditions. The 80-100 and the 0-20 zone indicates how strongly the price action is in momentum. If the lines intersect at above 80 or below 20, it is a strong signal of an imminent trend reversal or a pullback as compared to the crossover if it occurs between 20 to 80.
One strategy for using the stochastic oscillator is to look for a currency pair with a pronounced and lengthy bullish trend. Ideally for a reversal, you want to see a currency pair that has been in the overbought territory for a while with their prices peaking at a previous resistance zone. Then, look for the waning volume since that serves as another indication of the bullish trend losing steam. When the stochastic oscillator crosses the signal line, the price will soon follow. Although the signals are already clear, it is best to wait for the price action trading bar to dip first before making the move since momentum oscillators tend to spit fake information now and again.
Stochastic Indicator Settings
You can tinker with various parameters in the stochastic indicator settings, such as the period for both %K and %D. However, the strategies and techniques we will discuss below make use of the default values, which are 14, 3, 3 (K, D, and Smooth, respectively). There are some forex trading strategies out there that make use of unique %K and %D values, so it is up to you whether you want to experiment.
Stochastic Oscillator Strategy
There are two deadly mistakes a trader can make when using the stochastic oscillator that can conclude his career. Avoid these mistakes, and you will see yourself making hundreds or even thousands of dollars in profit soon enough.
Oversold/ Overbought might not always mean a reversal
The stochastic oscillator measures the momentum behind price changes. When the indicator reads above 80 (overbought), it indicates strong bullish momentum. What would be your first instinct? If you go short because the stochastic indicator says there is an overbought condition, you are in for a painful surprise. Going in blind like this is a huge mistake since the market can continue to be overbought or oversold for a long time. Likewise, the opposite is to be hold true.
Stochastic oscillator divergence
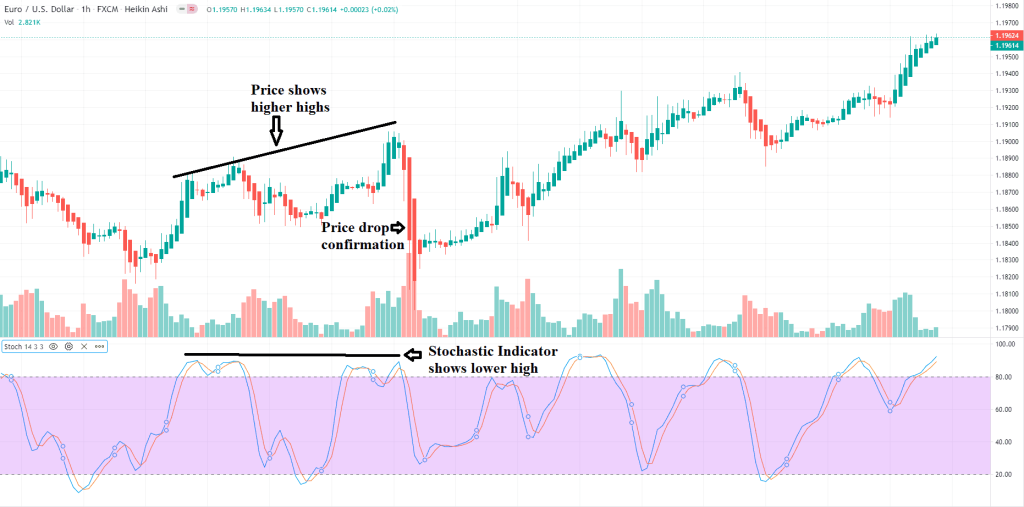
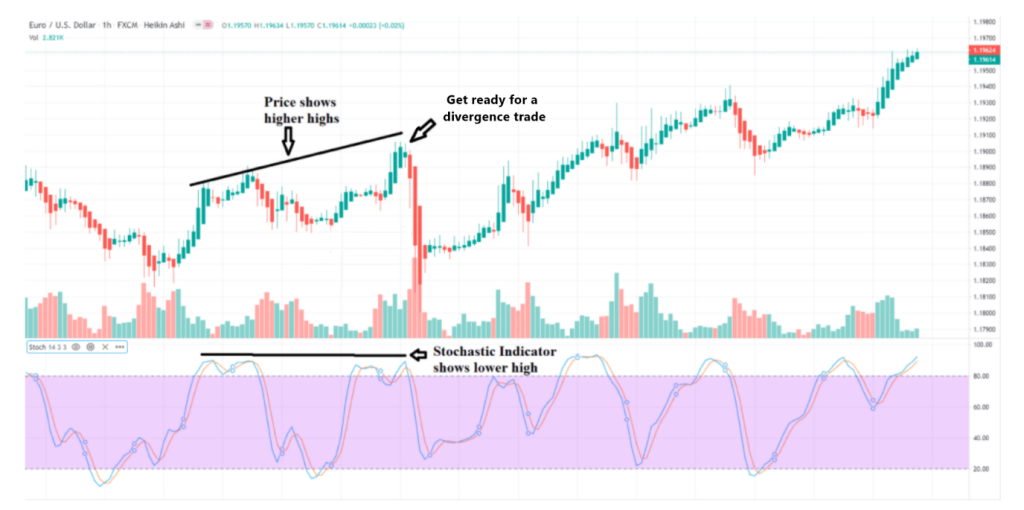 As mentioned before, a divergence occurs when the price keeps peaking and producing higher highs but the indicators show lower highs. That means there is a difference, a divergence, between the prices and the stochastic indicator.
This tells us that, according to trading courses or textbooks, a trend reversal is imminent. But putting your capital behind that assumption is a huge mistake. This is why you need to wait for a convincing signal in the prices first before making a move. For instance, if the trend reversal results in an upward trend, make sure that the prices actually follow an upward trend before you commit. Patience is key.
Using Stochastic Indicator to Set Up High Probability Trades
Keeping the idea of trading with the trend in mind, another good practice is to see yourself in the bigger picture before making the move. If you want higher probability trades, you want to make sure that you are going with the flow of a higher timeframe trend. The stochastic indicator can help you in this regard.
For instance, suppose you are in the 1-hour period and you want to go long. Before you commit, check with the daily timeframe to see where you are. If the daily timeframe shows a downtrend and the stochastic indicator shows an overbought condition, the trend will continue to go down. Going long, in this case, would be a bad idea.
But what if the daily timeframe shows a downtrend but the stochastic indicator shows an oversold condition? You go short. Your entry might be a bearish breakdown from the support level in the 1-hour timeframe.
Using Stochastic Indicator to Time Entries
Entry points can be subjective for chart or candlestick patterns. However, the stochastic indicator makes it clear for you. You either go in or stay out. If timing is a problem for you, this entry technique should work for you.
If you like to go long, do so when the stochastic indicator line goes over 20. If you like to go short, do that when the line dips below 80. But how do these two values help you determine such entry points? Again, the stochastic indicator measures momentum. If the value is higher than 20, a bullish momentum is coming and vice versa.
Stochastic Oscillator Pros and cons
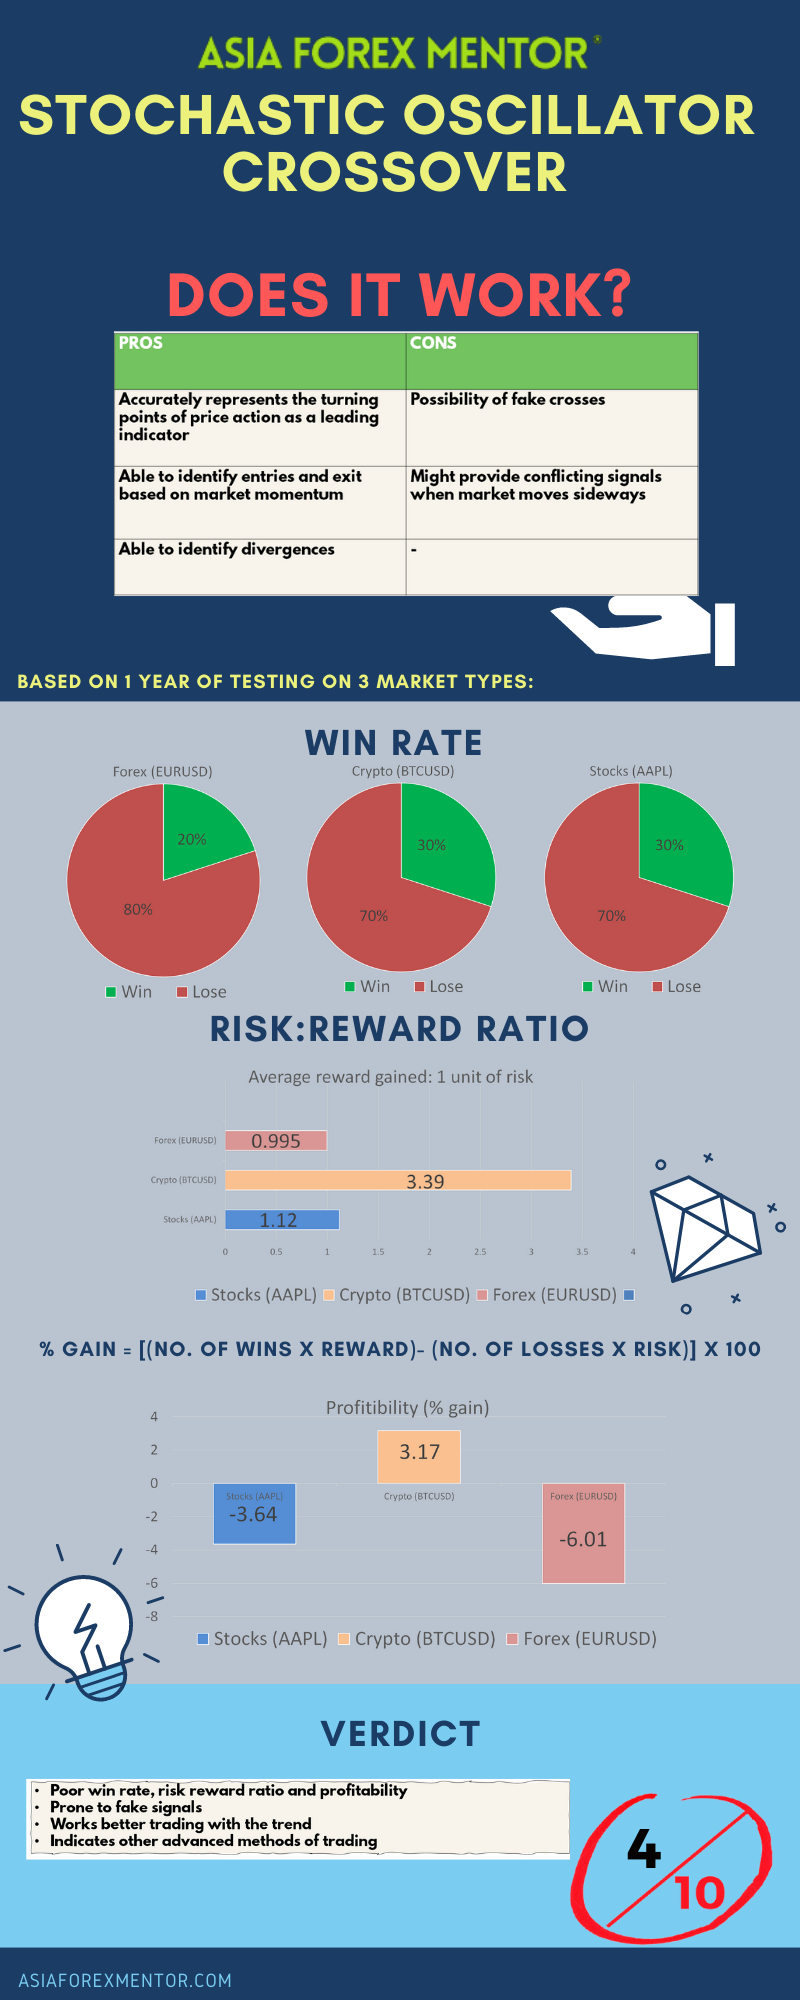
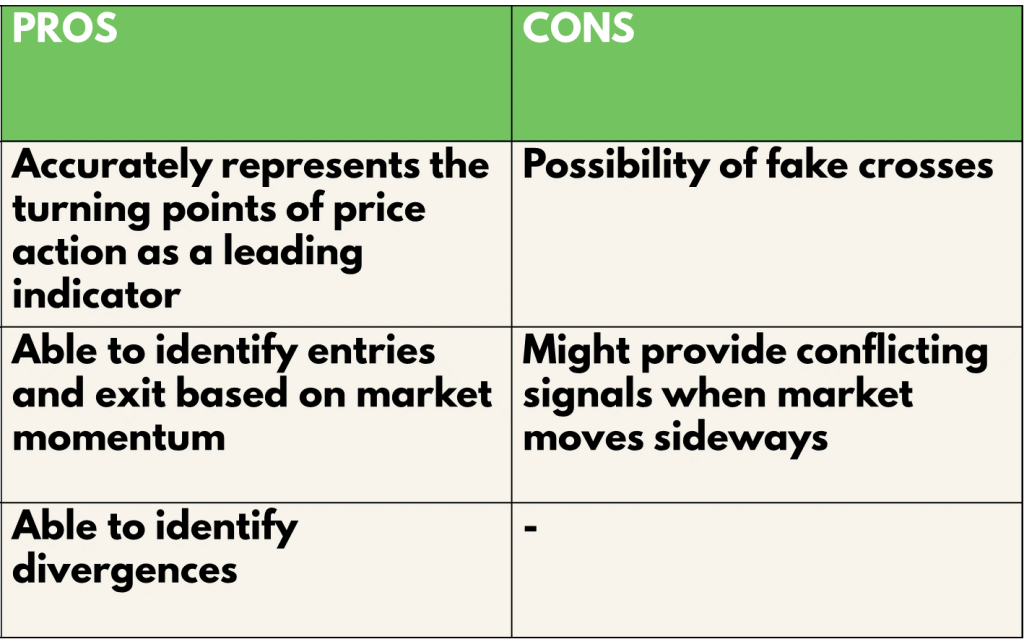
The pros of using the stochastic oscillator is that with the settings of (14,3,3), the stochastic oscillator will be tuned into a leading indicator that is rather accurate in detecting turning points in price action as it reflects the price closely. This helps to give you a better idea of the market situation and will allow you to time better in an entry or exit. Also, the stochastic oscillator is based of on momentum, giving you insights from different angles during your trade planning. This is one of the key factors when coupled with a volume indicator, to tell if the market is pulling back or even reversing. To top that off, the stochastic oscillator is also able to point out areas of divergence which gives an oversight of the market. This is crucial as a disparity in moment and price will usually lead to higher probability trades once pointed out. However, by the stochastic oscillator is prone to fake crosses which may cloud your vision in your trade planning. This is especially so when the market is consolidating sideways. It may require some experience and market sentiment to filter out the false information as well. Prior to that, there will be fake signals.
Stochastic Oscillator Analysis
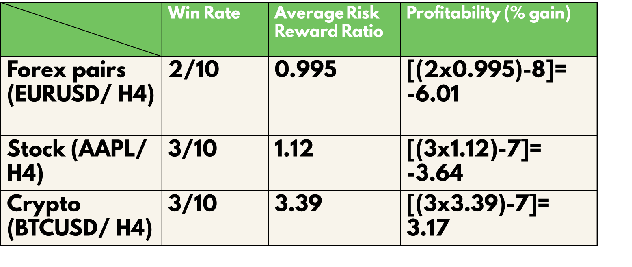
To find out the profitability of the Stochastic Oscillator strategy, we decided to do a back test based on the past 10 trades from 5 Apr. 21 on the H4 timeframe. The rules for entry will be the same as what was mentioned above. We will be back testing this throughout 3 types of trading vehicles, namely, EURUSD for forex, AAPL for stocks and BTCUSD for cryptocurrency. For simplicity, we will assume that all trades taken have a risk of 1% of the account.
Definitions: Avg Risk reward ratio= ( Total risk reward ratio of winning trades/ total no. of wins) Profitability (% gain)= (no. of wins* reward)- (no of losses* 1) [ Risk is 1%]
An example of the application of the strategy is as shown
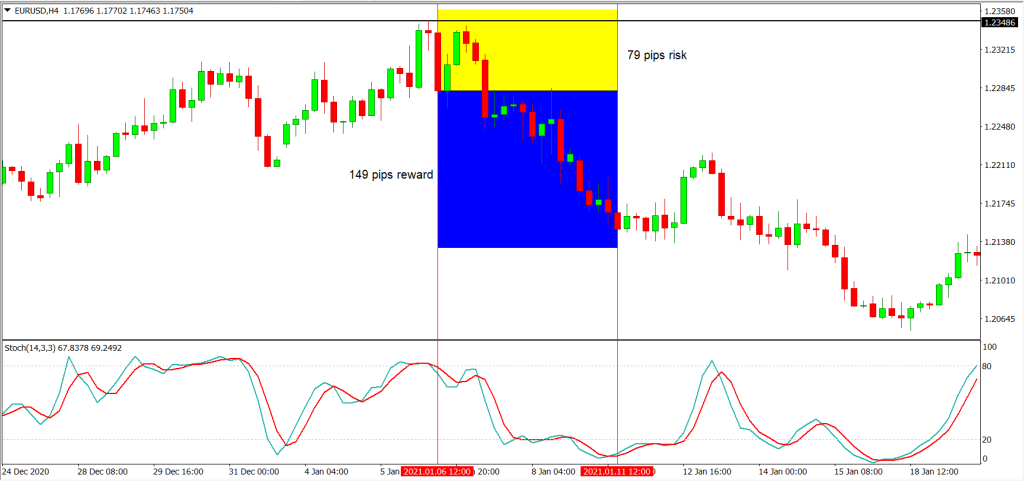
For the Backtest results, the blue zone as reward and the yellow zone as the risk taken.
As shown in our backtest, the win rate of this strategy for EURUSD (Forex) is 20%, AAPL (Stocks) is 30% and BTC (Crypto) is 30%
The average risk reward ratio of this strategy for EURUSD (Forex) is 0.995, AAPL (Stocks) is 1.12 and BTC (Crypto) is 3.39.
The profitability of this strategy for EURUSD (Forex) is -6.04, AAPL (Stocks) is -3.64 and BTC (Crypto) is 3.17.
Conclusion
Overall, the stochastic oscillator alone gives poor win rates, Risk reward ratios and profitability. This may be due to the fake crosses when market is in a consolidation or when trading against the trend. While trading with the trend, during retracements, the strategy is seen to work better reaping bigger wins. However, this indicator also allows you to spot and trade divergences widening the field of vision when planning your trades, at the same time allowing to see the market in a different light. and even identify potential pullbacks and reversals. Hence, coupled with a volume indicator, this indicator will definitely value add to your set up.
Infographic