

Ask any seasoned trader, and they'll tell you that diamond patterns are not only tough to spot in any time frame, but they can also be challenging to trade effectively for many traders. Only a few forex traders worldwide can play with the chart pattern effectively. But why is that?
The main reason is that most of these traders who fail do not understand the concept behind the diamond chart pattern, be it a bullish diamond or bearish diamond formation.
Really, however, the trick here is that, like any other technical analysis pattern (including the head and shoulders pattern that the diamond pattern resembles), diamond patterns have their own rhythm. And once you've mastered recognizing it, trading them successfully won't be a hassle.
Now let's dive into this technical analysis phenomenon and the trading strategy you can employ and trade every time the pattern occurs.
Also Read: What Is The Diamond Top Pattern?
Contents
- What Is A Diamond Pattern?
- Is A Diamond Pattern Bearish or Bullish?
- What Types of Diamond Patterns Exist?
- How To Trade Diamond Chart Patterns
- Conclusion
What Is A Diamond Pattern?

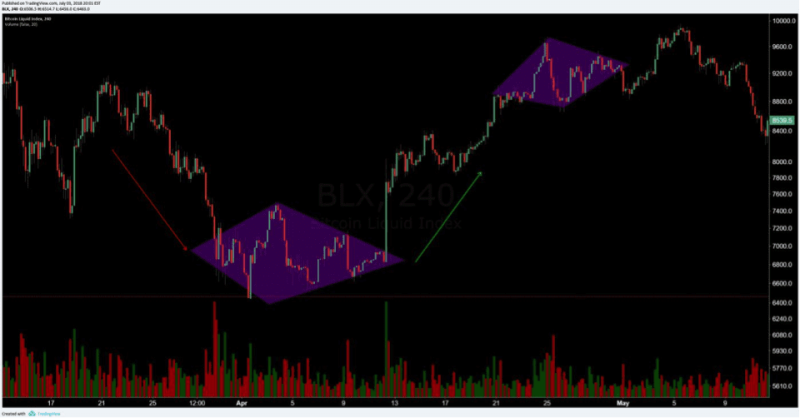
Also known as diamond reversal patterns, diamond patterns are relatively rare chart pattern formations that occur after strong trending price moves. A diamond pattern forming after a long bearish or bullish trend often indicates an imminent reversal of the price action momentum.
Traders recognize the diamond pattern by first identifying a head and shoulders pattern (a peak “the left shoulder,” then a trough, followed by an even higher peak, another tough, followed by a peak that's somewhere below the previous peak, which creates the right shoulder of the head and shoulders chart pattern.)
What's more? Since diamond patterns usually form overall descending or ascending channels, they also allow technical traders to identify support levels and resistance levels for the asset's price as it enters its momentary reversal.
Is A Diamond Pattern Bearish or Bullish?
The diamond pattern can be either a bearish or bullish diamond pattern, depending on the direction of the breakout point. as shown in the image above, if the price breaks through the upper trend lines, then the pattern is considered a bullish diamond pattern, which implies that an upward price action momentum is likely to follow.
That said, if the breakout point is on the two support lines, then the diamond pattern is confirmed as a bearish diamond formation, and you can expect the price to drop even lower.
What's more? You can find diamond pattern formations in both downtrends and uptrends, hence the existence of two types of diamond patterns, the diamond top formation, and the diamond bottom pattern.
What Types of Diamond Patterns Exist?
As with most patterns that can be both bullish and bearish, the diamond pattern also has two types – both requiring in-depth familiarization if you're going to trade this chart pattern successfully. The two types are the diamond bottom pattern and the diamond top pattern, which appear at the highest and lowest point in a trending market.
-
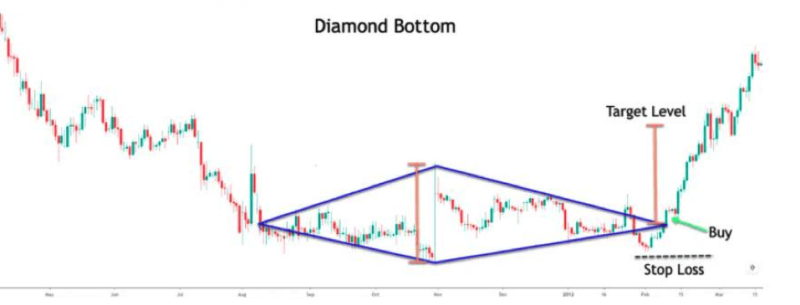
A Diamond Pattern Forming at the Bottom of a Trend
A diamond bottom pattern at the end of a downtrend happens as follows. For a certain period, bears dominate the market, provoking a steep downtrend. At some point, however, the price begins a flattening sideways movement, creating an expanding triangle. Volatility then shrinks, and a second, converging triangle forms on the price.
Here, both sellers and buyers meet in this middle point and create the trading range. As the bulls and bears further battle it out for market control, this forms symmetrical triangle patterns, which, when connected on both sides using trend lines (on both the highest and lowest points), result in the diamond bottom pattern.
Connect the minor lows and highs as well to visualize the formation better and get a better idea of the direction the market is headed. Also worth noting, the diamond bottom formation is often displaying potential opportunities with broad profit price targets if they occur after a sharp price decline, followed by the sideways formation before a breakout with high volume occurs.
Also, remember that the breakout can be either up or down, so you'll need to be careful when deciding on your sell or buy trade setups and stop loss levels.
-
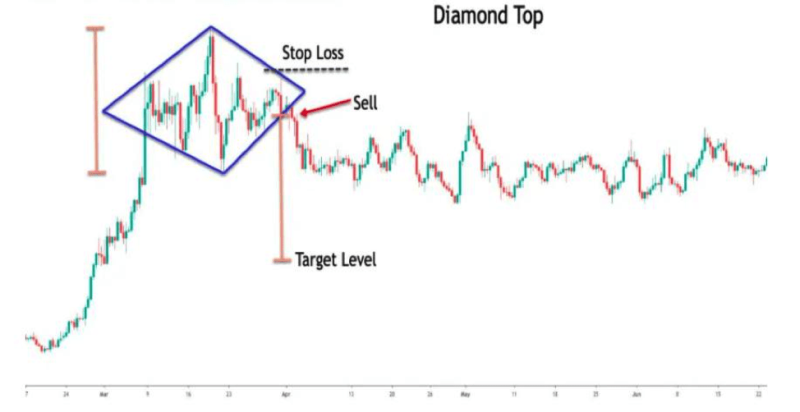
A Diamond Pattern Forming At the Top of a Trend
As we've seen with the diamond bottom formation, a similar situation may be witnessed at the highs of an uptrend, the only difference here being that market participants have swapped places. For a time in this diamond top pattern formation, the market is purely dominated by bulls, who push the price upward to higher highs.
After the price has hit a resistance level, it starts fading, and on the price chart, the gauge price action momentum decreases. This also shows a decrease in the price action's volatility in some sense since a huge portion of the market players, particularly the major ones, have closed out their positions and are waiting for fresh trading opportunities.
This is also when the price will form the first expanding triangle, which might be isosceles or of a slightly irregular shape. As the price begins to range and a pattern occurs, the second wave of players decides to partake in the scene in an effort to trade the ranging pattern to make money on the signals.
As these bulls and bears battle it out within this price range, they inevitably create a series of higher highs and lower lows, and then lower highs and higher lows on the price chart (as you'd usually see with head and shoulders formation patterns.)
After drawing trend lines connecting these swings' minor lows and minor highs, you get the diamond shape on the chart, explaining why it's also known as the diamond top pattern. This diamond top pattern will only be complete once the price breaks below one of the lower trend lines or a candle stick closes outside the diamond pattern.
How To Trade Diamond Chart Patterns
So you know a diamond chart pattern is coming. In fact, you've seen it repeatedly by this point, but you've never been able to execute it effectively. Now it's happening again, what do you do?
When looking to trade diamond chart patterns, there are several factors you'll need to consider, including the volatility level you witness within the diamond shape, whether it's a bearish breakout or a bullish breakout, and the next key levels on the price chart.
First, identify whether the diamond pattern in front of you is a bullish or bearish diamond pattern. Once you do, follow the steps below to trade the chart pattern successfully.
Also Read: How Harmonic Pattern Helps You Maintain A Higher Winning Rate in Forex and Crypto Trading World
-
Placing Short Trades When Trading Diamond Patterns
For the diamond pattern to complete within the four trendlines, the price action has to touch at least two points on all the trend lines. If it doesn't, then it's not a valid diamond formation. And if the bearish diamond pattern meets this criterion, wait for the lower right support line breakout point to be broken before placing a sell order. Remember, the candle on the price charts that breaks this line must also close under it.
Once every criterion is met, open short trades with your preferred volume and place the stop loss above the nearest swing high. Usually, this will be above the right resistance level, near where the price closed.
For profit targets, calculate the height of the diamond formation (vertical dimension) and use its 60 to 85 percent length as the profit target.
If you prefer opening more conservative trades to protect yourself from false signals, you have a second option when ‘bearish diamond pattern trading.' You may also wait until the trending price shows that it's broken past the lowest point of the bearish diamond formation.
You'll calculate your profit targets the same way (60 to 85 percent of the height of the diamond top formation.) Again, the stop loss goes above the nearest swing high within the diamond top pattern.
-
Placing Long Trades While Trading a Diamond Pattern
Immediately after the price breaks past the upper resistance level on the price chart, wait for the candlestick to close above the said line before placing long trades of your preferred volumes. Place the stop loss below the nearest swing low, typically found on the lower right area where the price touched one of the four trendlines that form the diamond chart pattern.
Regarding profit targets, the same rule that is applied while placing short trades applies here. Target 60-85 percent of the diamond formation.
If you're looking for a more conservative option to place long trades when diamond pattern trading, wait until the price action breaks past the high of the diamond formation high. While trading this breakout point, you can still place the stop loss below the nearest swing low within the diamond formation as you did in all other cases.
- Here is a rundown of things you'll need to consider when diamond trading to ensure profitable trading opportunities every time:
- Even if the trend is bearish, the breakout can be bullish (and vice versa)
- Do not place a trade until the price action shows you a definite break
- Proper risk management is essential. When setting your stop loss, you neither want to be too conservative nor do you want to be too open. gauge price action momentum and find the optimum zones to set price targets and your stop losses
- Top off your diamond pattern trading strategy with other confluences, like price oscillators, like the relative strength index
Conclusion
There you have it, our detailed guide to the diamond pattern. These patterns are among the most profitable to trade, thanks to their high returns and good reliability in detecting reversals. Additionally, both bearish and bullish diamond patterns are considered low-risk, thanks to their tight stop losses when compared to their broad profit targets.
All you'll need to do to trade it profitably is understand the pattern formation in detail and its variants.


