English
 简体中文
简体中文 繁體中文
繁體中文 日本語
日本語 한국어
한국어 Bahasa Melayu
 Bahasa Indonesia
 Filipino
 ไทย
ไทย Tiếng Việt
 हिन्दी
 العربية
 Italiano
 Português
 Русский
 Español
 Français
 Singapore
 Cambodia
 Myanmar
 Brunei
 Australia
  New Zealand
 Switzerland
 UAE
UAE United States
 Mexico
 Argentina
 South Africa
 IC Markets
 Pepperstone
 AvaTrade
 XM
XM Plus500
 RoboForex
 TMGM
TMGM Exness
 JustMarkets
 Orbex
Orbex Interactive Brokers
 Saxo
Saxo Tiger Brokers
 Binance
 Coinbase
 Gemini Exchange
 Kraken
 iFunds
 IC Funded
 The 5%ers
 TopStep
 IQ Option
 Pocket Option
 RaceOption
 IQCent
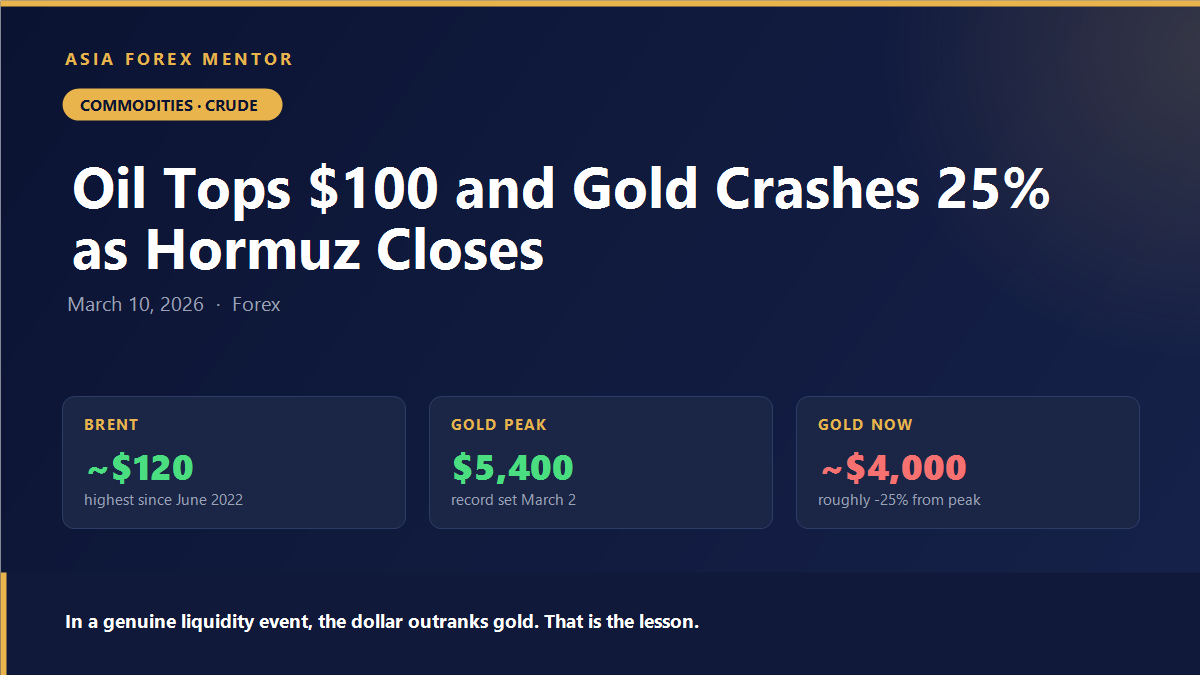
Oil has broken $100 a barrel for the first time since 2022, and gold has just handed traders one of the most expensive lessons in recent memory.
Crude surged past $100 on Monday 9 March, with Brent reaching roughly $120 a barrel — its highest level since June 2022 — as the Strait of Hormuz remained effectively closed and Iranian forces warned vessels against transiting the waterway.
Meanwhile gold, which spiked above $5,400 an ounce on 2 March at the peak of the panic, has since collapsed toward the $4,000 level — a drawdown of roughly 25% in a matter of days.
Both moves come from the same event. Understanding why they diverged so violently is the single most useful thing a trader can take from this week.
The Hormuz Premium Is Real
Roughly a fifth of global seaborne oil passes through the Strait of Hormuz. It is not a symbolic waterway; it is a physical bottleneck with no adequate alternative route for most Gulf production.
When shipping through a chokepoint of that size becomes unsafe, the market does not price a probability — it prices scarcity. That is why crude has moved in a straight line rather than in the choppy, headline-driven pattern typical of geopolitical risk. Tanker owners are refusing transits, insurers are repricing war risk cover, and cargoes that would normally be at sea are not moving.
The distinction matters for how you trade it. A risk premium deflates when tensions ease. A supply disruption only deflates when the supply actually returns.
Why Gold Crashed During a War
This is the part that has hurt people.
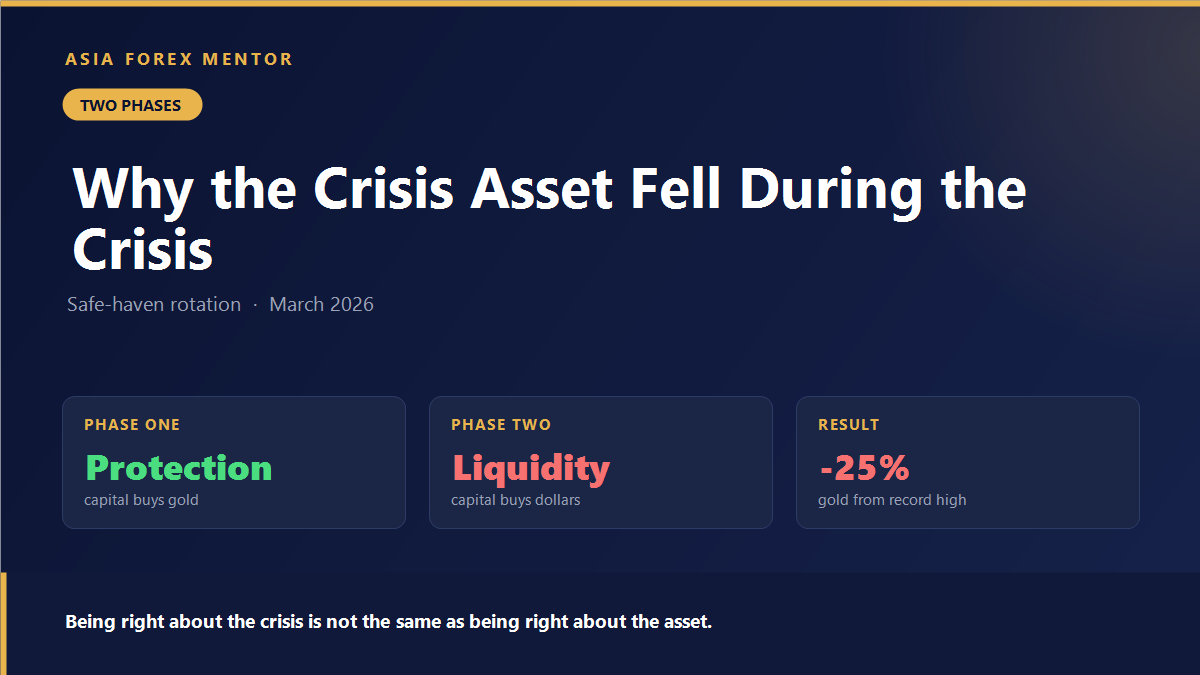
Gold is supposed to be the crisis asset. It performed exactly as advertised for about 48 hours, running above $5,400 as capital fled into hard assets. Then it fell roughly 25%.
The reason is that gold and the dollar are competing safe havens, and they win at different stages of a crisis.
In the first phase, investors buy protection against uncertainty — gold, and they buy it fast. In the second phase, the character of the demand changes. Institutions facing margin calls, redemptions and collateral requirements do not need protection; they need liquidity. And gold, for all its virtues, is not the most liquid asset on earth. The dollar is.
So the same crisis that sent gold to a record then forced holders to sell it — not because the crisis eased, but because they needed dollars. A rising dollar also mechanically pressures dollar-denominated gold, compounding the move.
Traders who bought the gold breakout on the theory that “war is bullish gold” were right about the thesis and wrong about the timing, which in a leveraged position is the same as being wrong.
The Inflation Consequence
Crude at $120 does not stay in the energy complex. It transmits into transport costs, petrochemicals, fertiliser, food, and eventually into headline inflation prints across every major economy.
That places central banks in an unenviable position. An energy shock is a supply-side event, and the orthodox response is to look through it rather than tighten into a slowdown. But looking through it only works if the disruption is short. With the Strait still contested and no diplomatic resolution in sight, “short” is doing a great deal of work in that sentence.
Rate expectations have already begun repricing away from the easing path markets assumed at the start of the year. For currency traders, that repricing is the trade — more so than the oil price itself.
What This Means Across Markets
Commodity currencies. Net energy exporters — the Canadian dollar and Norwegian krone among the majors — gain a terms-of-trade tailwind. Net importers face the opposite. The Japanese yen is particularly exposed: Japan imports almost all its oil and gas, so an oil shock is a direct hit to its trade balance and its currency.
The dollar. Currently benefiting from both the liquidity bid and the shift in rate expectations. Two independent tailwinds at once is unusual and worth respecting.
Equities. Higher input costs plus a higher discount rate. Both channels push the same way.
Practical Notes
Know which phase you are trading. Panic buying and liquidity selling look identical on a five-minute chart and mean opposite things. Volume and the dollar’s behaviour tell you which one you are in.
Commodity margin requirements change without warning. Exchanges raise margins during volatility spikes, and a position sized for the old requirement can be liquidated purely by the rule change. Check before you carry size.
Correlations you rely on can invert. “Gold rises in a crisis” is a reasonable long-run generalisation and a dangerous intraday rule. This week proved it.
Watch shipping data, not headlines. Transit counts through Hormuz and war-risk insurance premiums lead the oil price. By the time a headline reaches you, the move has usually happened.
For traders adding commodities to a currency-focused approach, our market analysis section covers the cross-asset relationships that drive these moves.
The Bottom Line
Crude at $120 is a supply disruption, not a sentiment trade, and it will not resolve until the Strait reopens. Gold’s 25% reversal from a record high is the more valuable lesson: in a genuine liquidity event, the dollar outranks everything, and being right about the crisis is not the same as being right about the asset.
Figures cited are as of 9 March 2026. Market data moves quickly; verify current levels before trading. This article is general information, not personal financial advice.