English
 简体中文
简体中文 繁體中文
繁體中文 日本語
日本語 한국어
한국어 Bahasa Melayu
 Bahasa Indonesia
 Filipino
 ไทย
ไทย Tiếng Việt
 हिन्दी
 العربية
 Italiano
 Português
 Русский
 Español
 Français
 Singapore
 Cambodia
 Myanmar
 Brunei
 Australia
  New Zealand
 Switzerland
 UAE
UAE United States
 Mexico
 Argentina
 South Africa
 IC Markets
 Pepperstone
 AvaTrade
 XM
XM Plus500
 RoboForex
 TMGM
TMGM Exness
 JustMarkets
 Orbex
Orbex Interactive Brokers
 Saxo
Saxo Tiger Brokers
 Binance
 Coinbase
 Gemini Exchange
 Kraken
 iFunds
 IC Funded
 The 5%ers
 TopStep
 IQ Option
 Pocket Option
 RaceOption
 IQCent
Wall Street has opened the week in full risk-off mode, and the trigger sits several thousand miles from any trading floor.
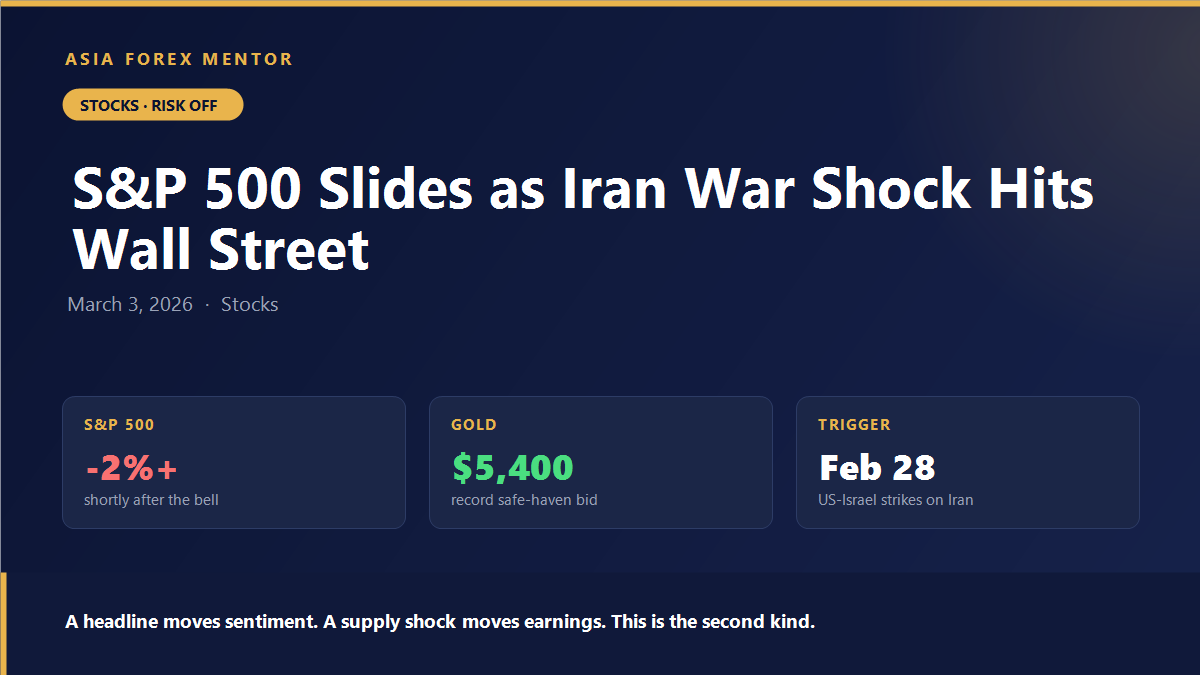
The S&P 500 opened sharply lower on Tuesday 3 March and slid more than 2% shortly after the bell, extending a brutal selloff that began late last week when the United States and Israel launched coordinated strikes against Iranian targets on 28 February. Iran’s supreme leader and several senior military commanders were killed in the strikes, and Iranian forces have retaliated against Israel and US bases across the Gulf.
Markets are not pricing a headline. They are pricing an open-ended conflict in the region that supplies a fifth of the world’s oil.
Why This Is Not a Normal Geopolitical Selloff
Equity markets usually absorb geopolitical shocks quickly. The historical pattern is well documented: an initial drop, a few sessions of elevated volatility, then a recovery as investors conclude the event has no lasting effect on corporate earnings.
That pattern holds when the conflict does not touch the inputs of the global economy. This one does. The strikes and the retaliation have put the Strait of Hormuz — the chokepoint through which a substantial share of seaborne crude and LNG passes — directly in play. Any sustained disruption there does not merely frighten investors; it raises the input cost of nearly every business on the index.
That is the difference between a headline and a shock. A headline moves sentiment. A shock moves earnings.
The Safe-Haven Trade Is Behaving Strangely
Gold surged above $5,400 an ounce on Monday 2 March as capital fled into hard assets, a record run driven by exactly the panic buying you would expect.
What followed is more instructive. Gold did not hold those levels. It has since given back a large portion of the move as investors rotated toward the one asset that outranks gold in a genuine liquidity scramble: the US dollar.
This is a recurring feature of crisis markets that catches traders out. In the first hours of a shock, capital buys protection. In the days that follow, it buys liquidity — and nothing is more liquid than the dollar. Traders who bought gold expecting a straight line higher have been squeezed by a dollar bid that arrived second but hit harder.
What Happens to Earnings
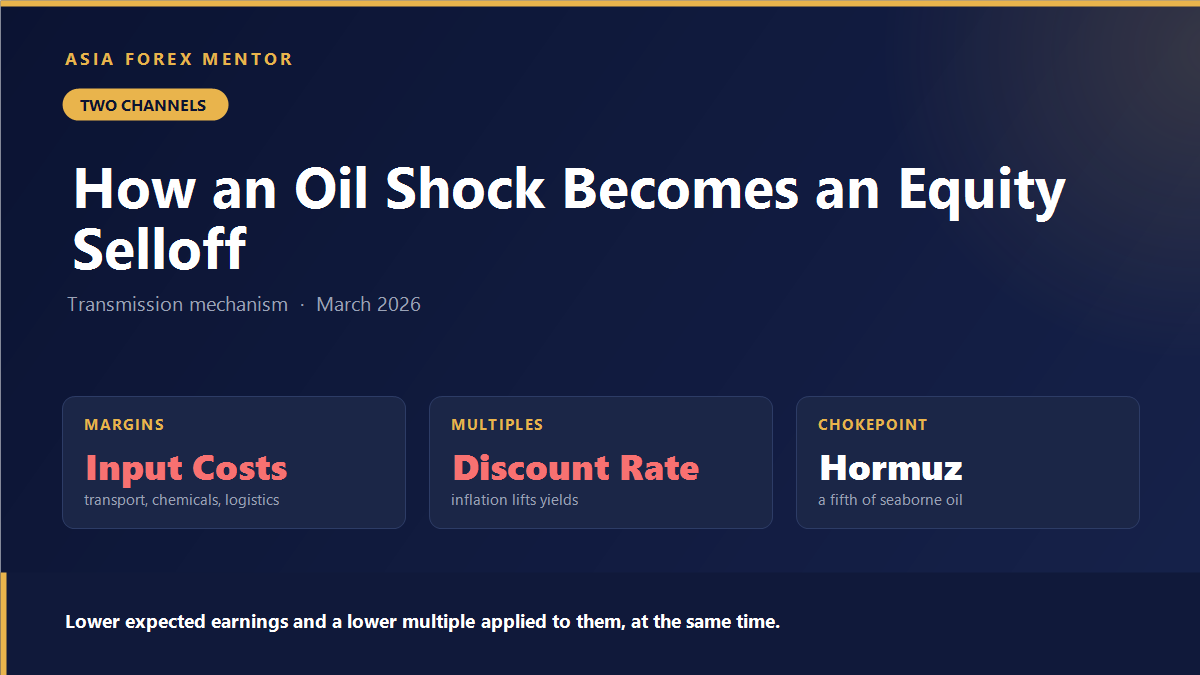
The mechanism that turns an oil shock into an equity selloff runs through two channels, and they compound.
The first is margins. Energy is an input cost for transport, manufacturing, chemicals, agriculture and retail logistics. When crude rises sharply, those costs land in the following quarter’s results whether or not demand holds up.
The second is the discount rate. Higher energy prices feed headline inflation. Higher inflation reduces the odds that a central bank eases, and may force it to tighten. A higher discount rate compresses the multiple investors will pay for future earnings.
Equities therefore get hit from both directions at once: lower expected earnings and a lower multiple applied to them. That is why an oil shock is one of the few events capable of producing a sustained equity drawdown rather than a two-day dip.
The Fed Problem
The policy implication is uncomfortable. A central bank facing an energy-driven inflation shock has no good options.
Cutting rates to support growth risks letting inflation expectations unanchor. Holding or hiking into a supply shock tightens conditions onto an economy already absorbing higher input costs. The textbook advice is to look through supply-driven inflation on the assumption it is transitory — but that advice depends entirely on the supply disruption actually being temporary, and nobody currently knows how long the Strait stays contested.
Traders who spent the start of the year positioned for policy easing should treat that assumption as suspended rather than merely delayed.
How to Handle a Market Like This
Volatility regimes change position sizing, not just direction. A stop distance that was appropriate in February is too tight for a market moving 2% before lunch. If you keep your usual stop, you keep getting stopped out. If you widen the stop without cutting size, you have quietly doubled your risk. Widen the stop and cut the size.
Correlations converge in a crisis. Positions that looked diversified in January are now expressions of the same trade — long risk, short oil, short volatility. Check what you actually own rather than what your sector labels say you own.
Do not fade a supply shock on valuation. “This has fallen enough” is not analysis while the underlying disruption is still active and unresolved.
Watch the Strait, not the index. The equity market is a lagging read on this conflict. Shipping traffic through Hormuz, tanker insurance rates and crude spreads will move first.
For traders reassessing risk management in a higher-volatility regime, our trading guides cover position sizing and stop placement in detail.
The Bottom Line
This is not a headline-driven wobble. It is a supply shock landing on a market that entered the year expensively valued and positioned for policy easing. Both of those assumptions are now under review, and until the situation in the Gulf stabilises, the market will keep repricing.
Figures cited are as of 3 March 2026. Market data moves quickly; verify current levels before trading. This article is general information, not personal financial advice.