
Most Japanese candlestick cheat sheets are useless. They hand you a shape and a name, then leave you staring at a live chart with no idea what to do. This one is different. Every pattern comes with the exact rule that tells you when to enter.
|
ABOUT THIS GUIDE |
This Japanese candlestick cheat sheet covers every major pattern forex traders encounter regularly, from how to read a single candle to three-candle reversal formations. Each pattern includes a specific entry trigger, stop placement, and the market conditions required for the trade to be valid. The goal is not pattern recognition. The goal is knowing what to do the moment a pattern appears on a live chart. |
|
QUICK ANSWER |
A Japanese candlestick cheat sheet maps candlestick patterns to specific forex entry rules. Hammers and shooting stars signal reversals at support or resistance. Engulfing pairs confirm momentum shifts. Morning and evening stars mark trend turns. Every pattern requires location, trend context, and a confirmation close before triggering an entry. |
How to Read a Single Candlestick
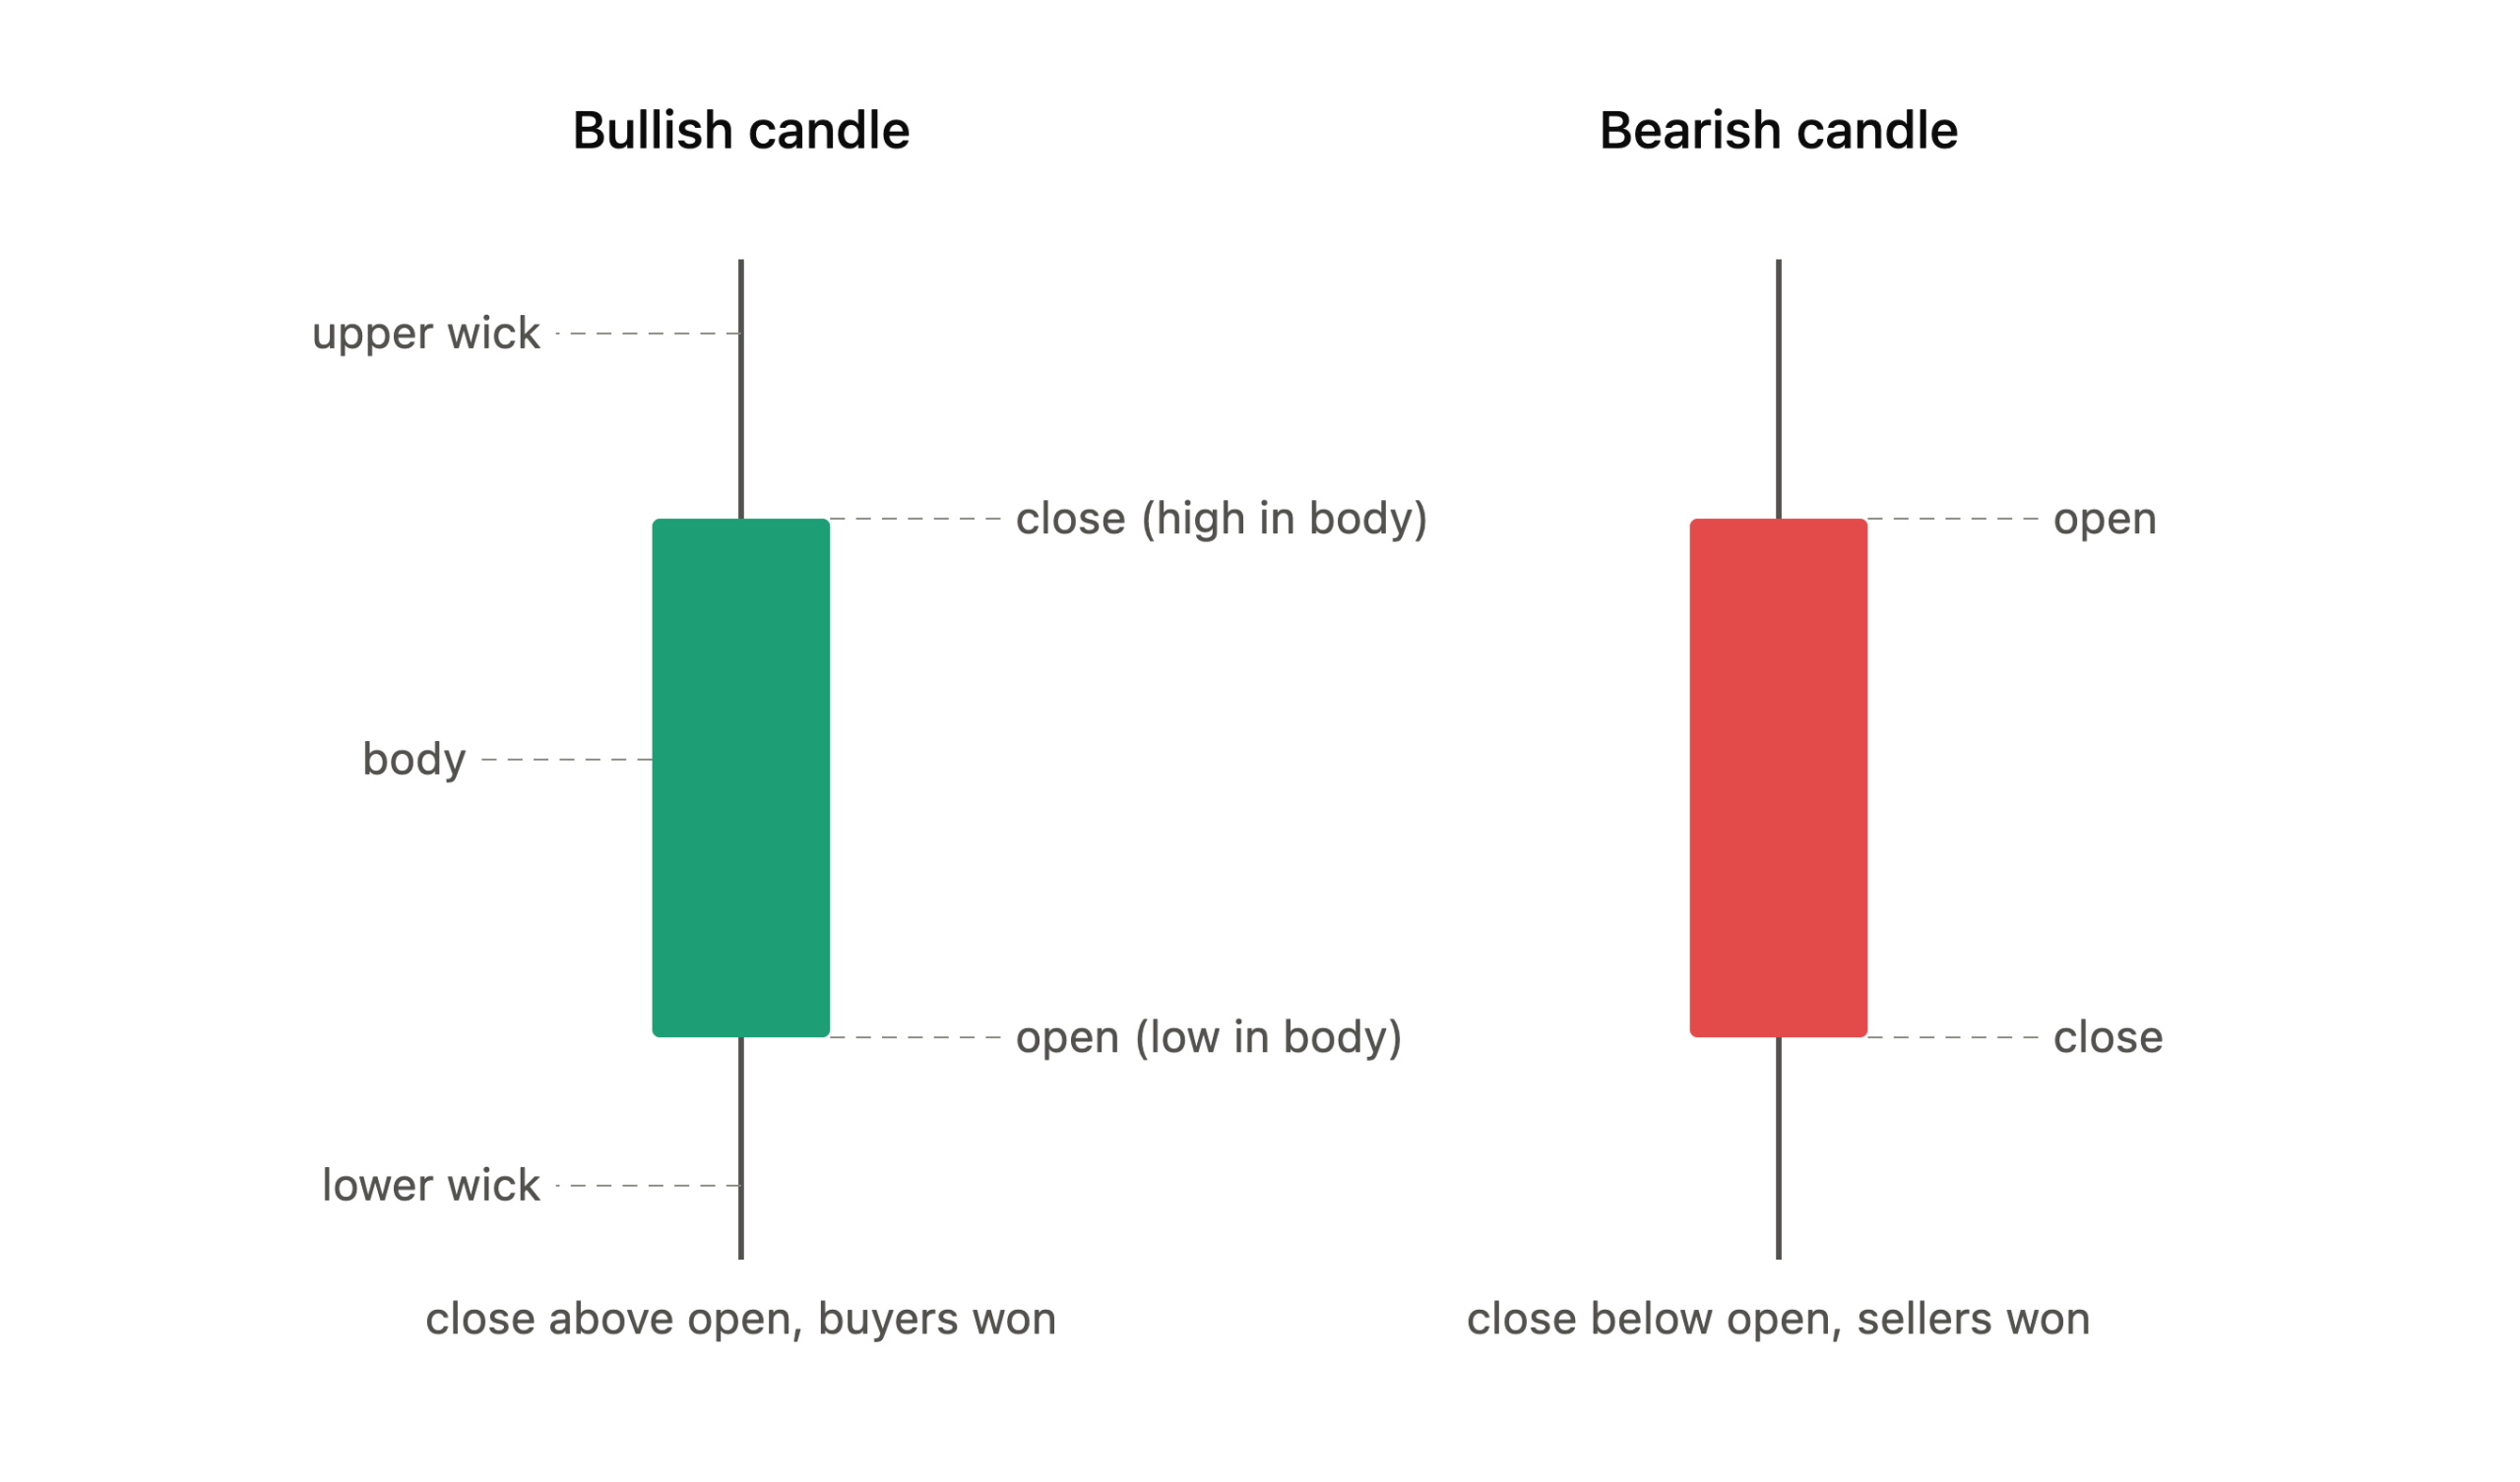
Every candlestick captures four prices from a single time period. Those four prices are the open, the close, the high, and the low. Understanding what each part of the candle represents is the foundation for reading any forex candlestick pattern correctly.
The body is the thick rectangle between the open price and the close price. A large body means one side dominated the session. A small or narrow body means neither buyers nor sellers held clear control by the end of the session.
The wicks extend from the top and bottom of the body. The upper wick shows the highest price reached during the session before being rejected back down. The lower wick shows the lowest price reached before buyers stepped in and drove it back up. Long wicks signal price rejection. Short or absent wicks signal that price moved with conviction and stayed at that level.
Candle color tells you who controlled the session:
- A green body (or white on some charting platforms) means the close was higher than the open. Buyers finished in control.
- A red body (or black) means the close was lower than the open. Sellers finished in control.
| Candle Component | What It Shows |
|---|---|
| Body | Distance between the open and the close |
| Upper wick | Highest price reached, then rejected |
| Lower wick | Lowest price reached, then defended |
| Green body | Bullish session, close above open |
| Red body | Bearish session, close below open |
For a broader foundation in price chart structure alongside candlestick anatomy, the Asia Forex Mentor guide on how to read forex charts covers the full framework.
The Complete Candlestick Patterns Reference Table
The table below maps every pattern in this guide to its type, signal, and entry trigger. Use it as a fast reference after reading the full breakdown of each pattern in the sections below.
| Pattern | Type | Signal | Entry Trigger |
|---|---|---|---|
| Hammer | Single | Bullish reversal | Next candle closes above hammer high |
| Shooting Star | Single | Bearish reversal | Next candle closes below shooting star low |
| Doji | Single | Indecision | Confirmed by following candle direction |
| Marubozu | Single | Strong momentum | Entry on next candle open, with trend |
| Bullish Engulfing | Double | Bullish reversal | Entry on close of the engulfing candle |
| Bearish Engulfing | Double | Bearish reversal | Entry on close of the engulfing candle |
| Tweezer Tops | Double | Bearish reversal | Entry on close of the second candle |
| Tweezer Bottoms | Double | Bullish reversal | Entry on close of the second candle |
| Morning Star | Triple | Bullish reversal | Entry on close of the third candle |
| Evening Star | Triple | Bearish reversal | Entry on close of the third candle |
| Three White Soldiers | Triple | Bullish continuation | Entry on close of the third candle |
| Three Black Crows | Triple | Bearish continuation | Entry on close of the third candle |
Single Candlestick Patterns With Entry Rules
Single candle patterns are the fastest setups to identify on a live chart. Each pattern below includes a full signal breakdown and the specific rule that makes it actionable rather than decorative.
The Hammer
The hammer is a bullish reversal signal. It forms with a small body at the top of the candle range, a lower wick at least two times the length of the body, and little or no upper wick.
What it signals: During the session, sellers drove price down sharply. Buyers absorbed that selling pressure and pushed price back up near the open. The long lower wick is the visual proof of that rejection. The candle shows the market hammering out a bottom.
Entry rule. Here is the exact sequence:
- Confirm the hammer appears at a known support level or after a clear downtrend.
- Wait for the next candle to close above the hammer’s high.
- Enter long on that confirmation close.
- Place the stop loss below the lowest point of the hammer’s lower wick.
What traders get wrong: They enter on the hammer candle itself rather than waiting for the following candle to confirm. A hammer without confirmation is a candle with a long wick. With confirmation, it becomes a high-probability setup worth taking.
The Shooting Star
The shooting star is the bearish mirror of the hammer. It has a small body at the bottom of the candle, an upper wick at least two times the length of the body, and little or no lower wick.
What it signals: Buyers drove price sharply higher during the session. Sellers stepped in at the high and forced price back down to near the open. The long upper wick shows exactly where the market rejected higher prices. It is the visual signature of supply overwhelming demand at a ceiling.
Entry rule. Here is the exact sequence:
- Confirm the shooting star appears at a resistance level or after a clear uptrend.
- Wait for the next candle to close below the shooting star’s low.
- Enter short on that confirmation close.
- Place the stop loss above the tip of the upper wick.
What traders get wrong: They trade shooting stars with no resistance level overhead. Without a structural ceiling, the signal has no weight behind it and produces far more false entries than confirmed ones.
The Doji
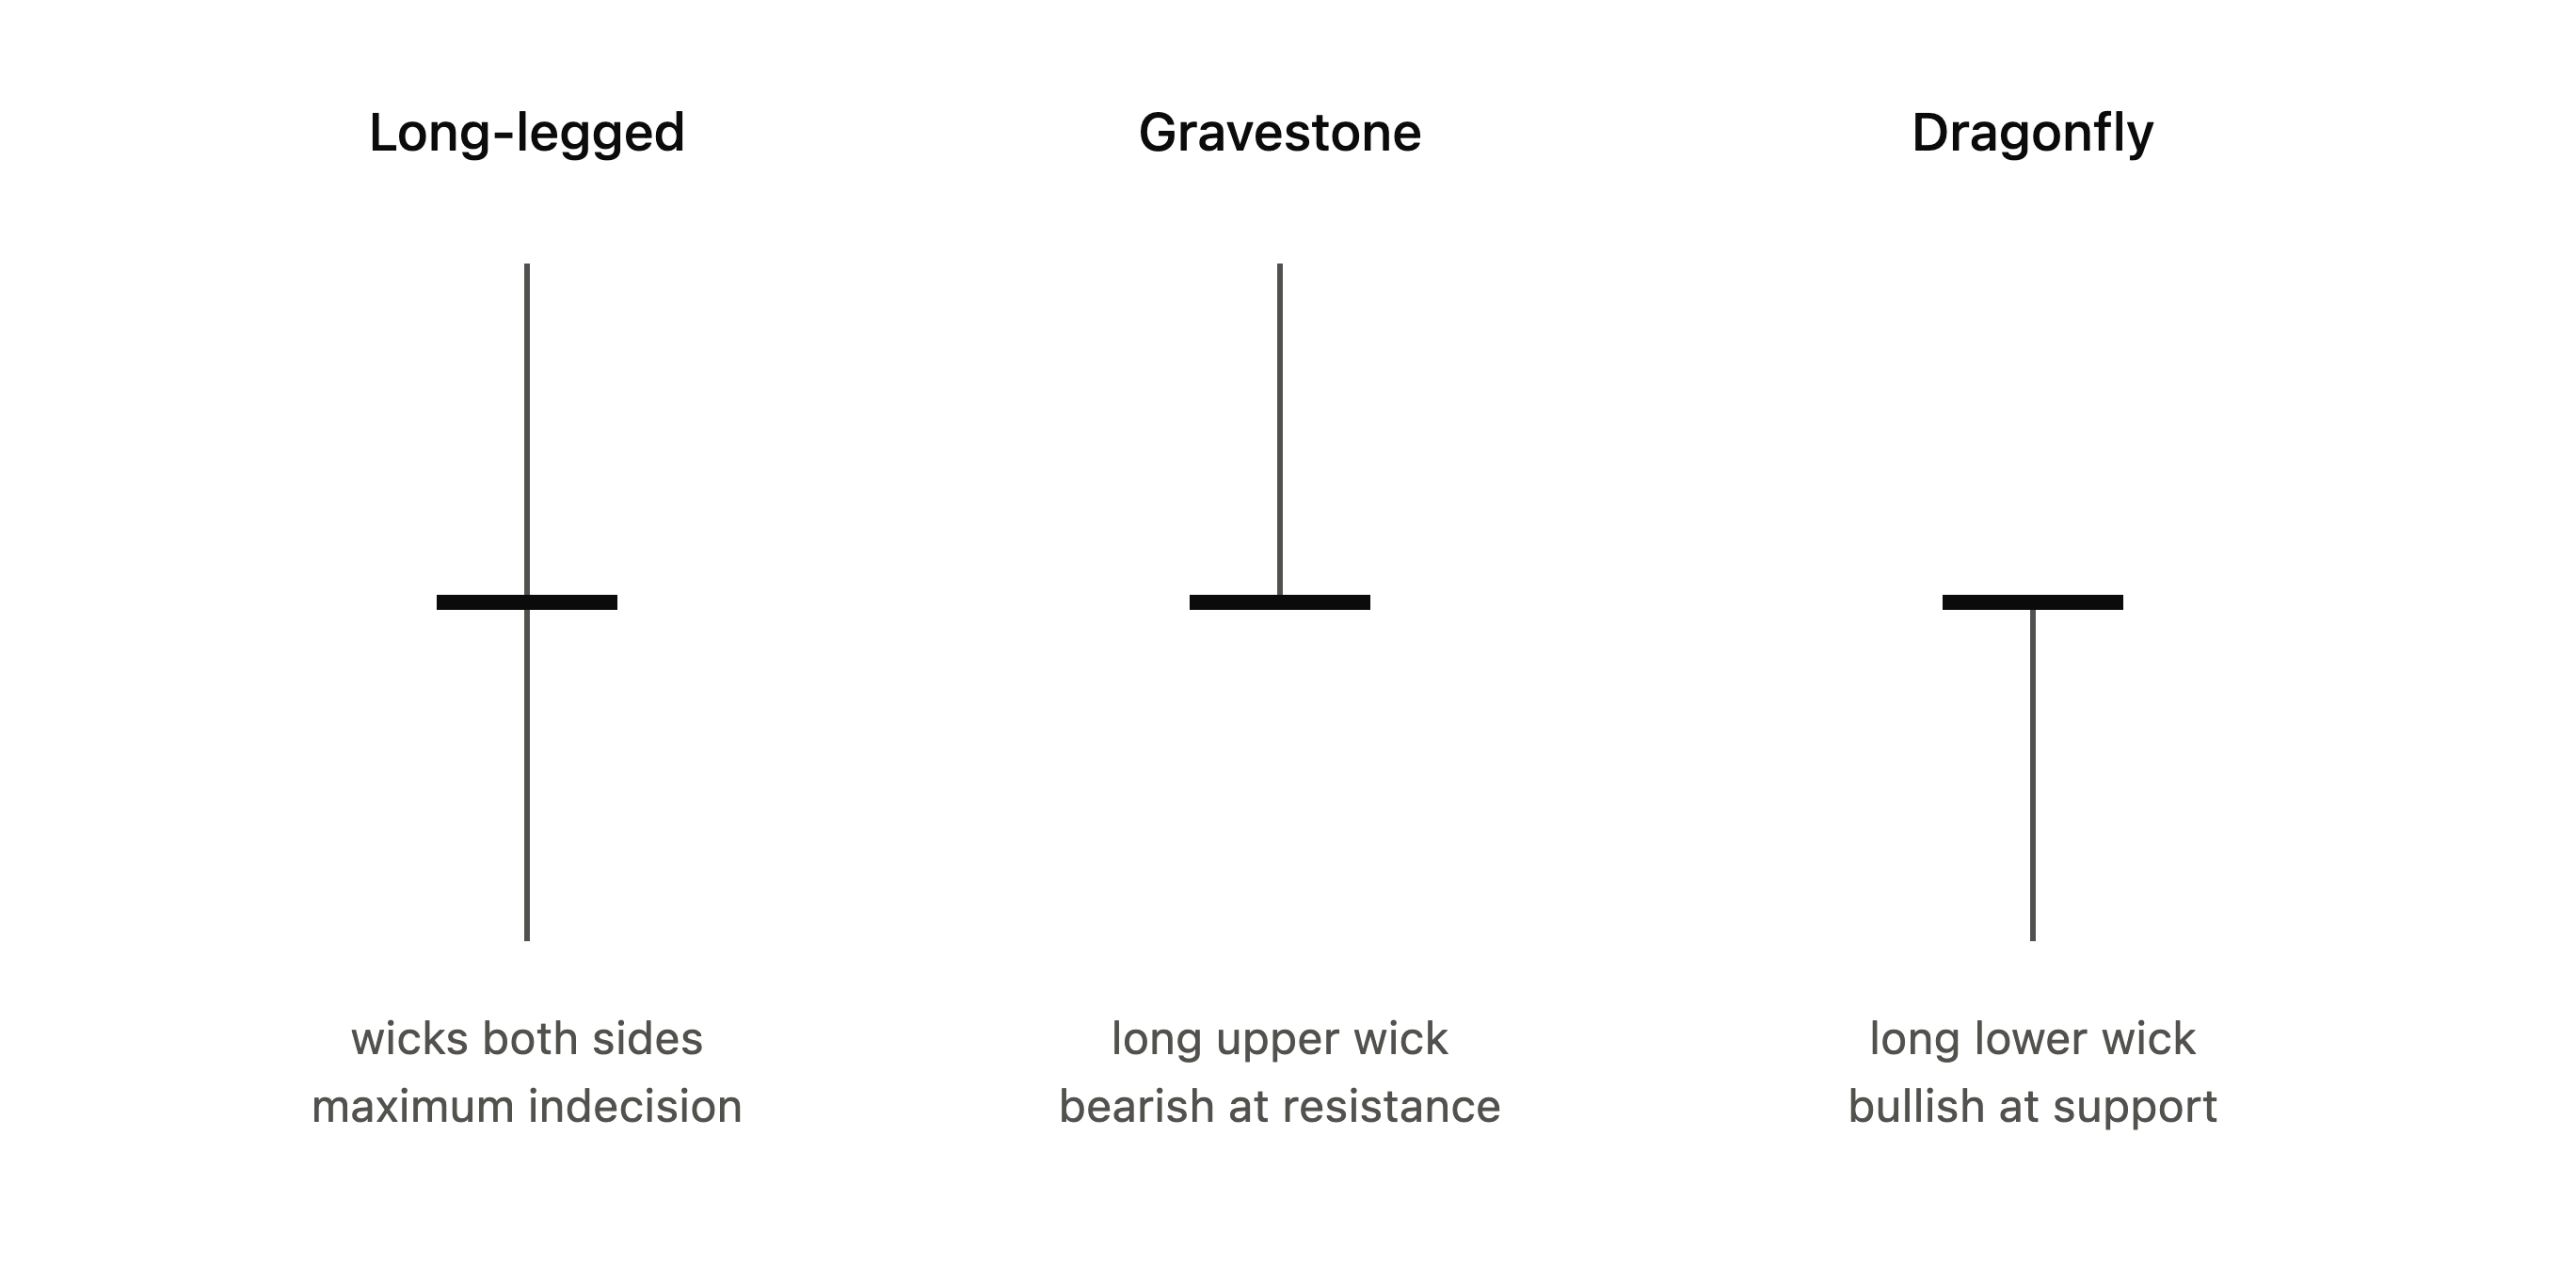
A doji forms when the open and close price for a session finish at nearly the same level. The body is tiny or invisible. Wicks may appear above, below, or on both sides of the body.
What it signals: Pure indecision. Neither buyers nor sellers could claim control of the session. On its own, a doji gives no directional signal. It tells the trader that a decision is coming and that price could break in either direction from here.
Three doji variations every forex trader should recognize:
- Long-legged doji: Wicks extend far in both directions. Maximum indecision with high volatility during the session.
- Gravestone doji: Long upper wick, no lower wick. Forms at the high of a move. Bearish signal when it appears at resistance.
- Dragonfly doji: Long lower wick, no upper wick. Forms at the low of a move. Bullish signal when it appears at support.
Entry rule: Never trade a doji in isolation. In a downtrend at support, a doji followed by a bullish candle close triggers a long entry. In an uptrend at resistance, a doji followed by a bearish close triggers a short entry. Stop is placed beyond the far wick of the doji.
The Marubozu
The marubozu is a full-bodied candle with no wicks, or only minimal ones. The open sits at one extreme of the session and the close sits at the other. The full anatomy and trade applications are covered in the Asia Forex Mentor article on the marubozu candlestick.
What it signals: One side completely dominated the session with zero pushback. A bullish marubozu opens at its low and closes at its high. A bearish marubozu opens at its high and closes at its low. The absence of wicks confirms there was no meaningful rejection at any point during the candle.
Entry rule. Here is the exact sequence:
- A bullish marubozu appearing after a downtrend and at support signals a potential reversal.
- Enter on the open of the next candle.
- Stop goes below the body of the marubozu.
- A bearish marubozu at resistance after an uptrend applies the same logic in reverse.
What traders get wrong: They treat every marubozu as a continuation signal without checking location. A bullish marubozu forming inside a resistance zone is not a buy trigger. The candle shows one-sided momentum. Location determines whether that momentum has room to extend.
Double Candlestick Patterns With Entry Rules
Two-candle patterns provide built-in confirmation. The second candle either validates or undermines what the first candle suggested. That interaction between two sessions makes these patterns more reliable than single-candle signals alone.
Bullish Engulfing
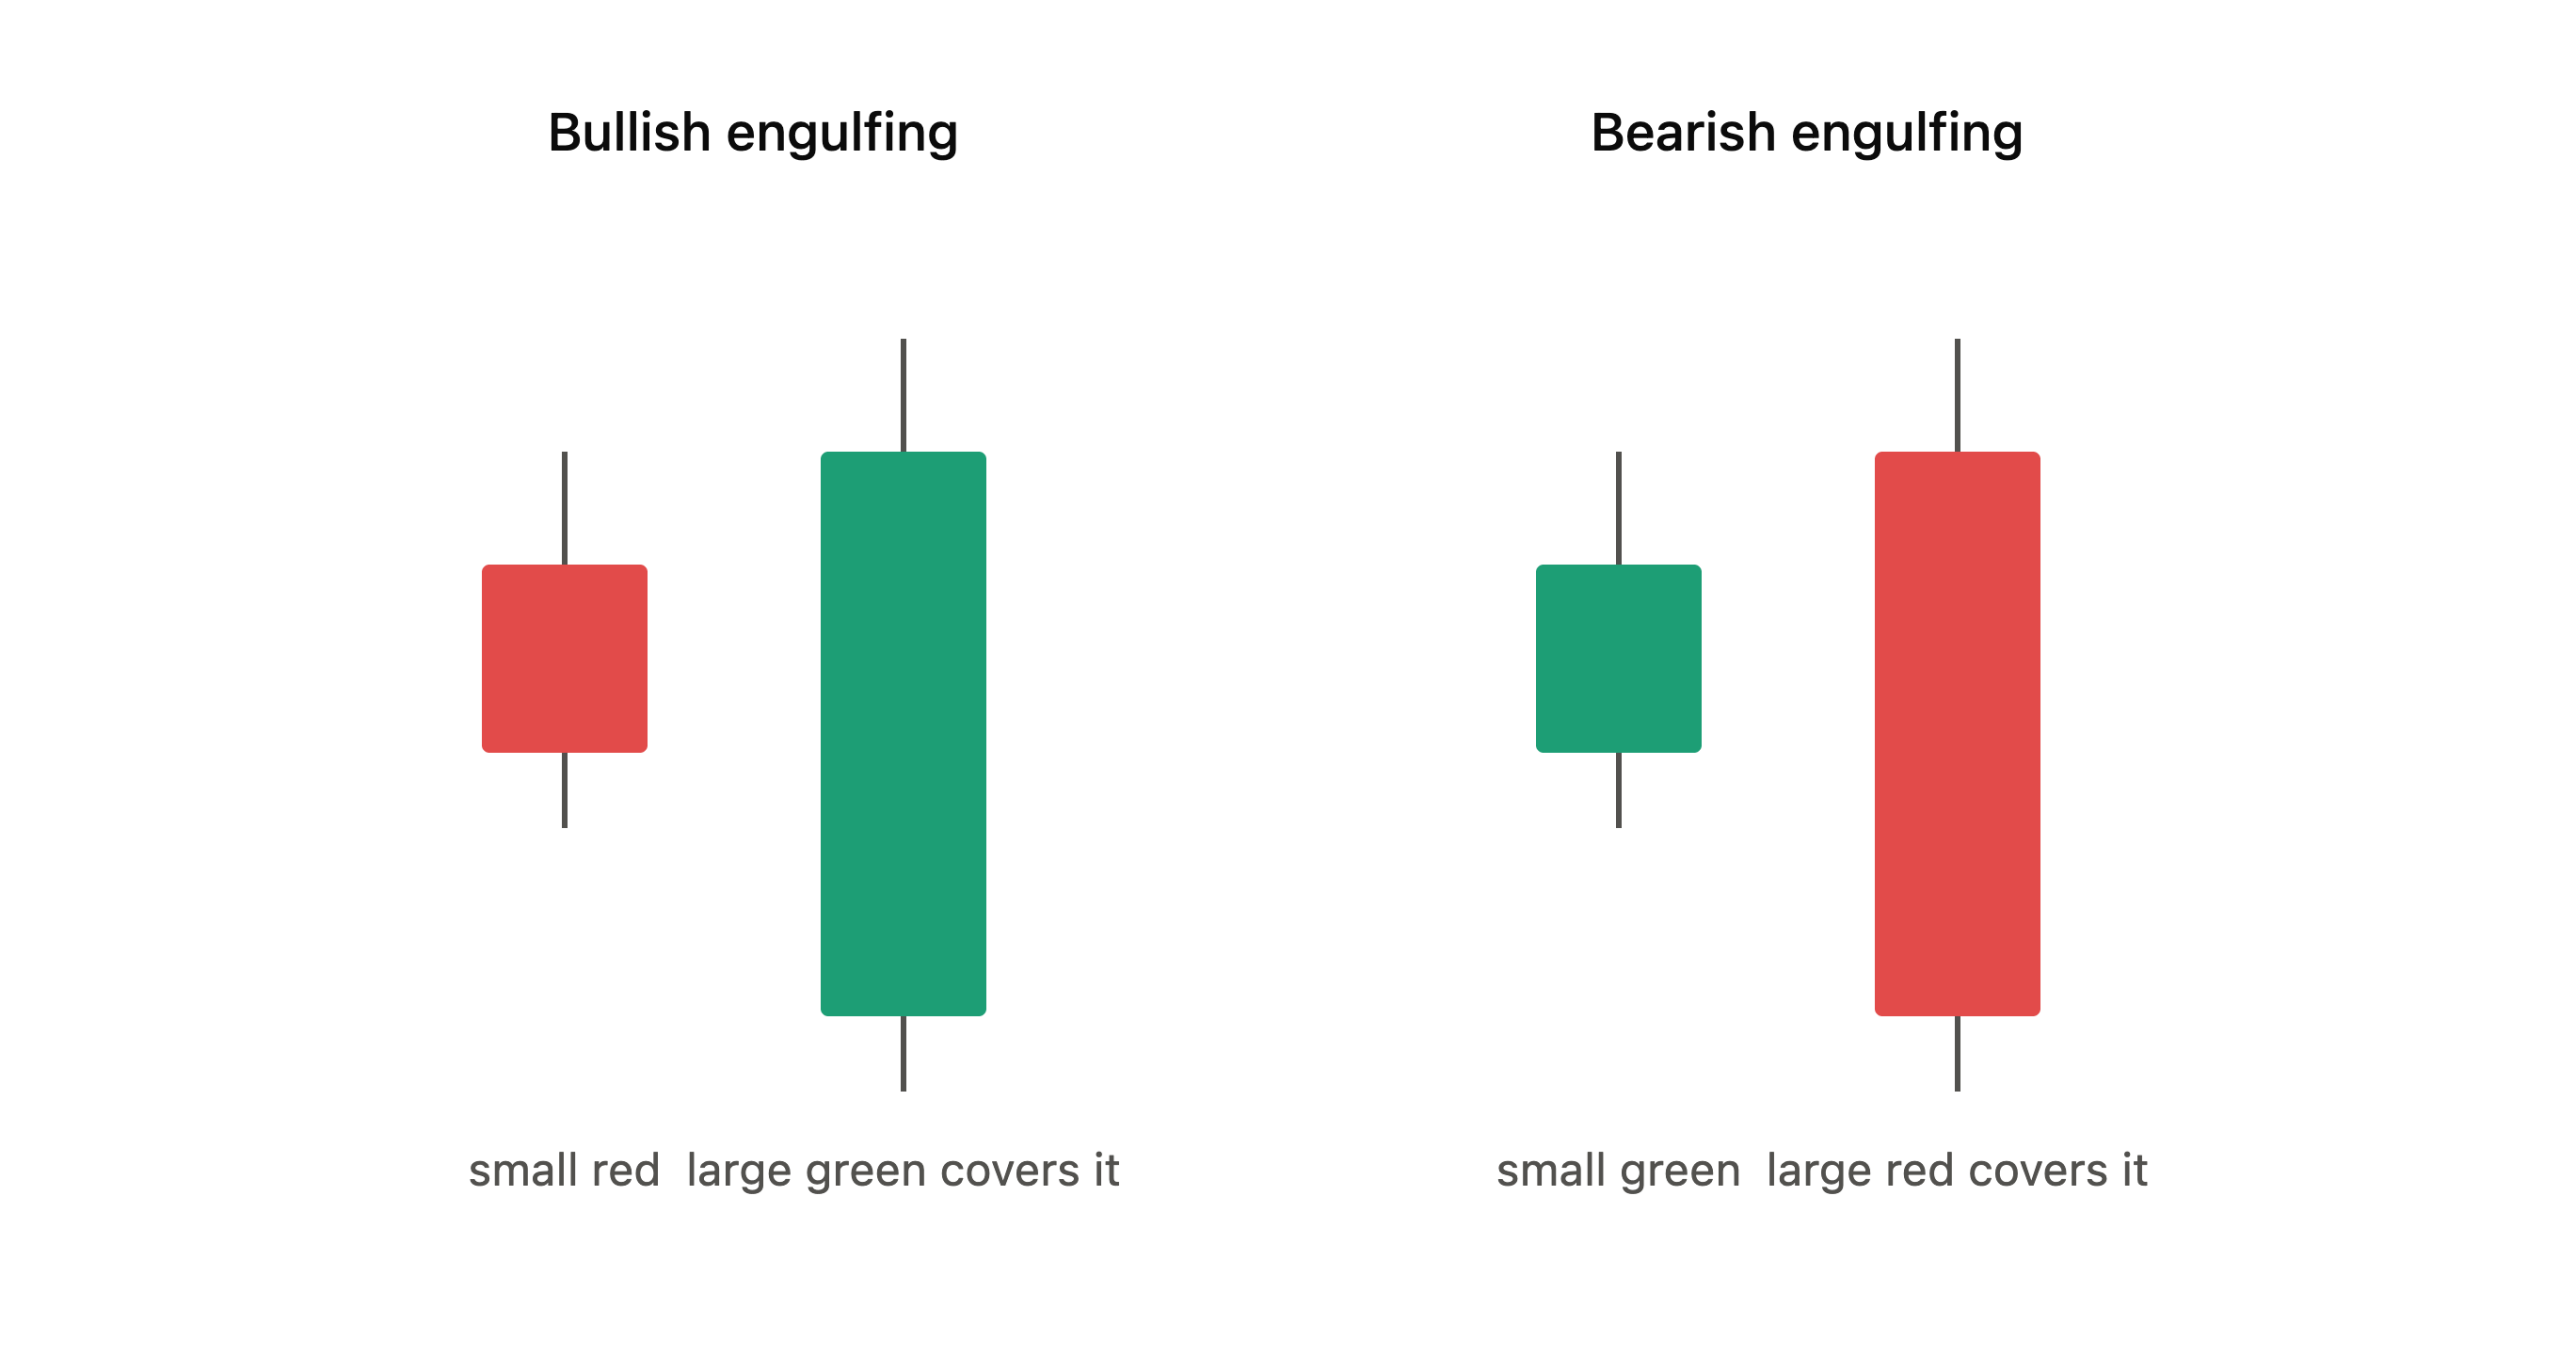
The bullish engulfing pattern forms when a red candle is followed by a green candle whose body completely covers the body of the previous red candle.
What it signals: Sellers held control in the first session. Buyers overwhelmed them in the second session, pushing price past the prior open so decisively that the first candle is entirely absorbed. The size advantage of the second candle shows how completely buyers took over.
Entry rule. Here is the exact sequence:
- The pattern must appear at a support level or after a downtrend.
- Enter long on the close of the engulfing candle, or on the open of the next session.
- Stop sits below the low of the first (red) candle in the pair.
- A wider body gap between the two candles signals stronger momentum behind the reversal.
What traders get wrong: They accept partial engulfing patterns where the second candle barely overlaps the first. The larger the engulfing body relative to the first candle, the stronger the reversal signal. Barely-engulfing candles are low-quality signals.
Bearish Engulfing
The bearish engulfing is the inverse. A green candle is followed by a larger red candle whose body completely absorbs the previous green body.
What it signals: Buyers controlled session one. Sellers overwhelmed them in session two, closing below the prior open with clear margin. The second candle’s dominance signals a decisive shift in who controls price direction.
Entry rule. Here is the exact sequence:
- The pattern must appear at a resistance level or after an uptrend.
- Enter short on the close of the engulfing candle or the open of the following session.
- Stop goes above the high of the first (green) candle.
The dark cloud cover pattern is a related bearish reversal signal worth studying alongside the bearish engulfing. It captures the same momentum shift with slightly different candle proportions and is one of the more reliable reversal signals at resistance.
What traders get wrong: They trade bearish engulfing patterns mid-trend without a resistance level overhead. A pattern without a structural ceiling is a lower-quality signal regardless of candle size.
Tweezer Tops
Tweezer tops form after an uptrend when two consecutive candles reach the same high and fail to close above it. The first candle is typically bullish. The second is bearish. The matching high is the defining feature.
What it signals: Price tested the same level twice and was rejected both times. The double rejection confirms that sellers are actively defending that area. This is a bearish reversal signal and is strongest when the shared high aligns with a prior resistance zone or a major round number.
Entry rule. Here is the exact sequence:
- Confirm the shared high aligns with a known resistance zone.
- Enter short when the second candle in the pair closes.
- Stop goes above the shared high of both wicks.
Tweezer Bottoms
Tweezer bottoms form after a downtrend when two consecutive candles share the same low. The first is bearish and the second is bullish. Neither candle closes below the shared low.
What it signals: Price tested the same floor twice and was bought up both times. Buyers are actively defending that level. This is a bullish reversal signal and carries the most weight when the shared low aligns with a prior support zone.
Entry rule. Here is the exact sequence:
- Confirm the shared low aligns with a known support zone.
- Enter long when the second candle in the pair closes.
- Stop goes below the shared low of both wicks.
Triple Candlestick Patterns With Entry Rules
Three-candle patterns take longer to form but carry more confirmation weight. Each formation tells a complete story about who controlled the market, where that control was lost, and who took over.
Morning Star
The morning star is a three-candle bullish reversal pattern. Session one is a large bullish candle. In session two, a small indecision candle opens at or above the prior close. By session three, a large bearish candle closes back into the body of that first bullish candle.
What it signals: Sellers dominated session one. Session two showed indecision near the low of the move, trapping late sellers at the bottom of the range. Buyers took full control in session three and closed well above the midpoint of the first bearish candle. The full context for this and related formations is covered in the Asia Forex Mentor guide to Japanese candlestick patterns.
Entry rule. Here is the exact sequence:
- The pattern must form at a significant support level or after a sustained downtrend.
- Enter long on the close of the third candle.
- Stop goes below the low of the middle candle.
- The deeper the third candle closes into the first candle’s body, the stronger the signal.
What traders get wrong: They enter on the second candle, the small indecision candle, instead of waiting for the third. The third candle is the confirmation. Without it, the pattern is incomplete and the reversal is unconfirmed.
Evening Star
The evening star is the bearish mirror of the morning star.
What it signals: Buyers dominated session one. The flat or slightly higher open in session two trapped late buyers near the top. Sellers took complete control in session three and closed deep into the first session’s bullish body. Traders who entered during sessions one or two are now in losing positions.
Entry rule. Here is the exact sequence:
- The pattern must form at a clear resistance level or after a sustained uptrend.
- Enter short at the close of the third candle.
- Stop goes above the high of the middle candle.
- The deeper the third candle closes into the first bullish body, the stronger the reversal signal.
Three White Soldiers
Three white soldiers is a pattern of three consecutive bullish candles. Each candle opens inside the prior candle’s body and closes at or near its high. The candles build in a steady staircase formation higher.
What it signals: Buyers are in consistent control across three sessions with no meaningful pushback from sellers. Each candle opening inside the prior body rather than gapping higher shows organic, sustained buying pressure rather than a single speculative spike.
Entry rule. Here is the exact sequence:
- As a reversal signal, the pattern must appear after a downtrend and ideally at a support level.
- As a continuation signal, the pattern forms after a pullback within an established uptrend.
- Enter long on the close of the third candle.
- Stop goes below the open price of the first candle in the formation.
Warning sign to watch for: If any candle in the trio shows a long upper wick, it signals buying exhaustion within the pattern. That weakens the signal significantly and the trade should be reassessed.
Three Black Crows
Three black crows is the bearish mirror of three white soldiers. It consists of three consecutive bearish candles, each opening inside the previous body and closing at or near its low. The candles descend in a steady staircase.
What it signals: Sellers are in control across three sessions with no recovery from buyers. Each candle opens inside the prior body and grinds lower, confirming consistent and sustained selling pressure rather than a panic spike.
Entry rule. Here is the exact sequence:
- As a reversal signal, the pattern must appear after an uptrend and at a resistance level.
- As a continuation signal, the pattern forms after a pullback inside a downtrend.
- Enter short on the close of the third candle.
- Stop goes above the open price of the first candle in the formation.
Warning sign to watch for: If any candle in the formation shows a long lower wick, buyers are starting to defend. The signal quality drops and the pattern may not follow through.
The Three Filters That Keep You Out of Bad Trades
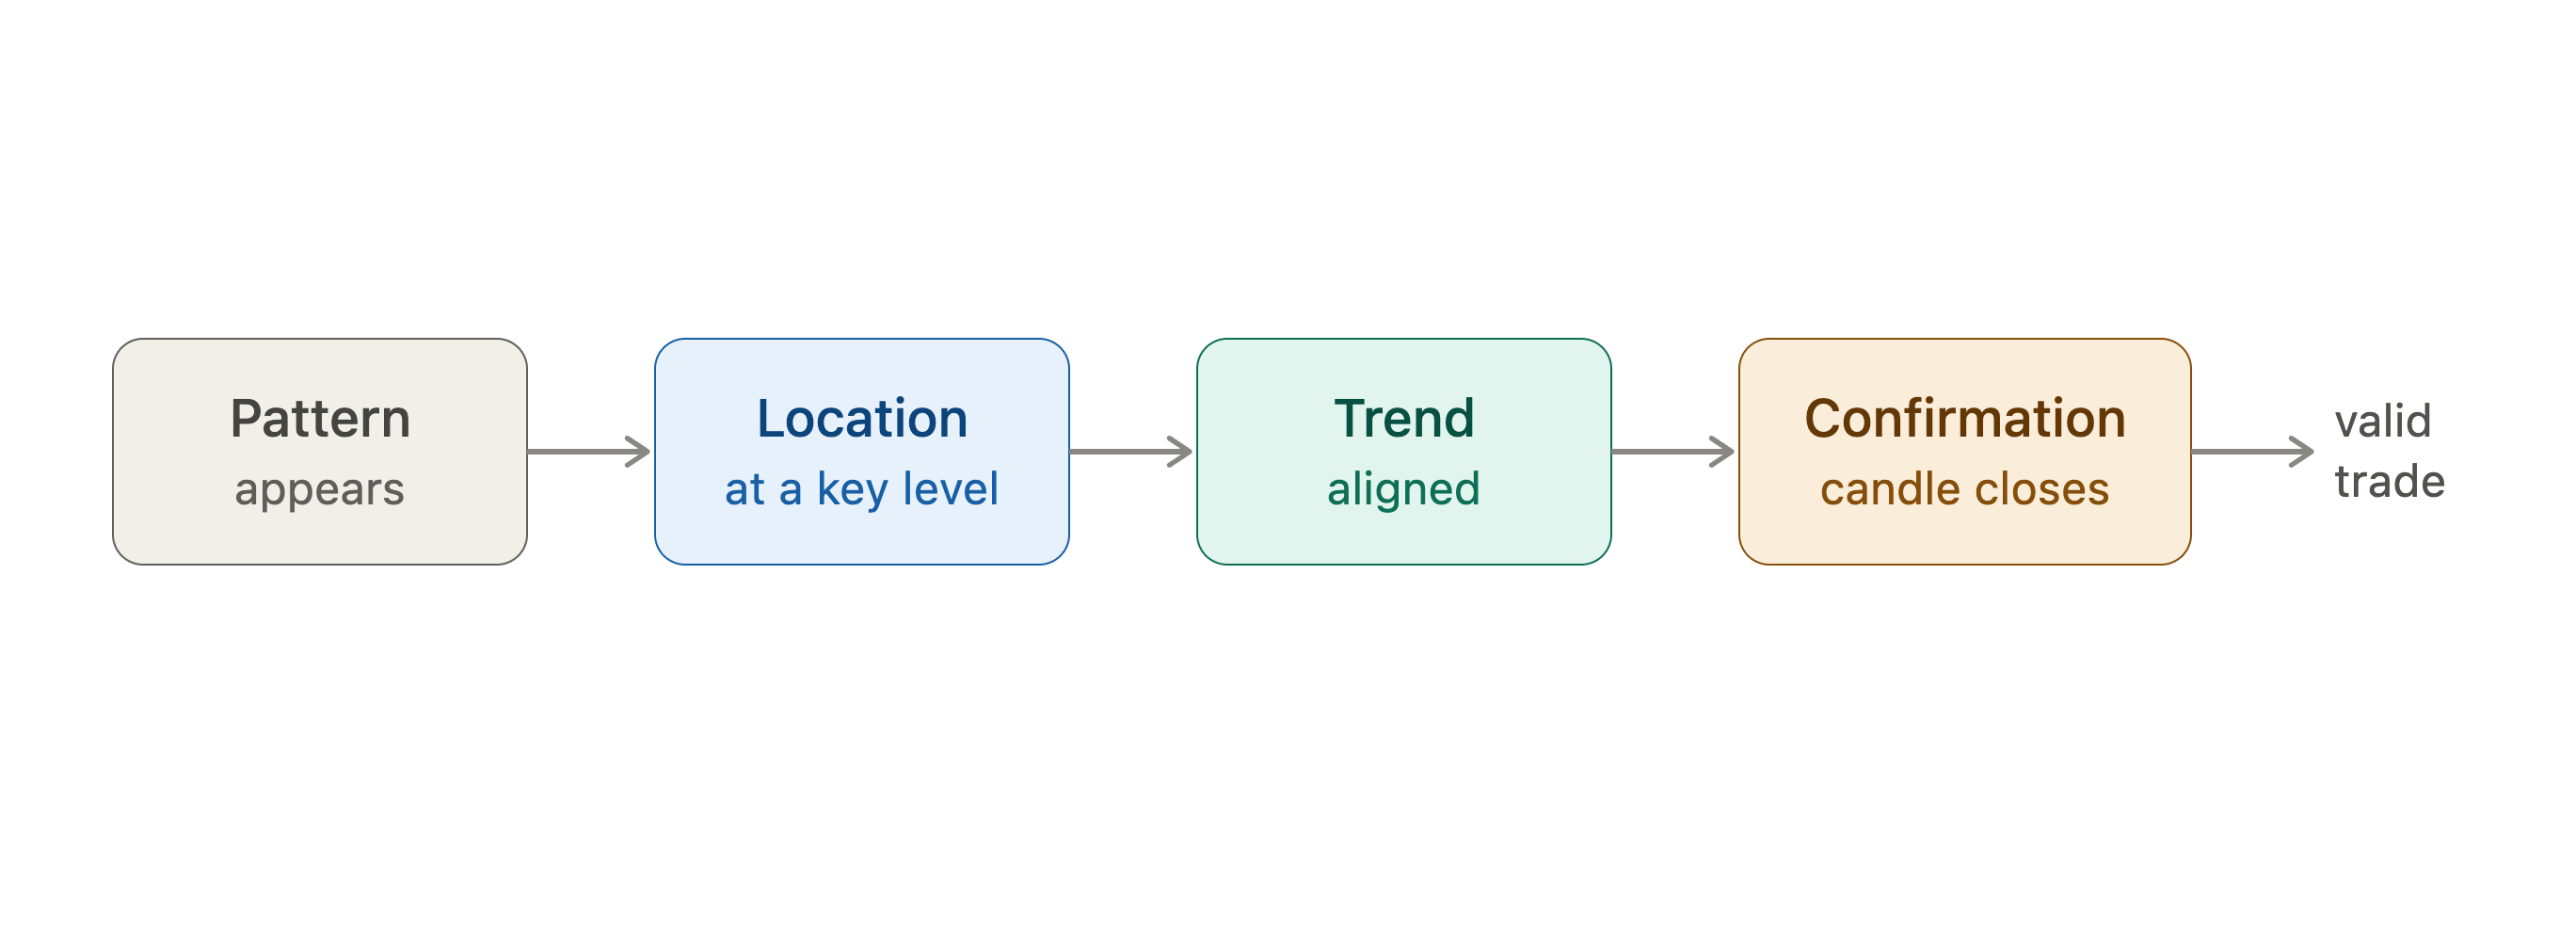
Asia Forex Mentor has trained more than 100,000 traders across 50+ countries. When those traders arrive from self-study or other programs, one mistake appears more consistently than any other: trading candlestick patterns as shapes in isolation rather than as events in context. These three filters address that problem directly.
Filter 1 Location
Location means the pattern appears at a price level where the market has already demonstrated it cares about that area.
Support and resistance zones, Fibonacci retracement levels, prior swing highs and lows, and major round numbers all qualify as meaningful locations. A bullish hammer forming below a broken support level carries almost no weight. The same hammer forming at a level that held price three or four times carries significant weight.
Skipping the location filter turns pattern trading into random entry. The pattern tells the story of what happened during the candle. Location gives the story a reason to matter.
The rule: if the pattern has no structural location behind it, skip the trade and wait for a setup that does.
Filter 2 Trend
Trend alignment means understanding the dominant direction of the market before interpreting any single pattern.
Reversal patterns like the morning star and hammer carry the most weight when they form after a move that has clearly exhausted itself. Continuation patterns like three white soldiers carry the most weight when they form after a pullback within a healthy trend. Trading a bullish reversal pattern inside a powerful downtrend is fighting institutional-level selling pressure without any structural reason to expect a turn.
Identify the trend first. Then determine whether the pattern is a reversal signal at the end of a tired move or a continuation signal within an established trend. The same candle formation carries a different meaning depending on where the trend stands.
The rule: always establish the trend before reading the pattern.
Filter 3 Confirmation
Confirmation means the candle after the pattern closes in the direction the pattern predicted. That close is the entry trigger.
A hammer suggests buyers may be stepping in. The next candle closing above the hammer’s high confirms they are acting on it with follow-through. A bearish engulfing suggests sellers took over. The candle that follows confirms the shift is holding rather than reversing again. Entering on the pattern candle itself removes this filter entirely.
Waiting for confirmation reduces the total number of entries slightly. It reduces false signals dramatically. Most traders who struggle with candlestick-based entries are skipping exactly this step.
The rule: the confirmation candle close is the entry trigger. Always.
Conclusion
This Japanese candlestick cheat sheet maps every major pattern to a specific entry rule because the pattern alone is never enough. Knowing what a hammer looks like is the starting point. Knowing the exact close that triggers the entry, where the stop goes, and what condition must be in place before the trade is taken is what makes the pattern usable on a real account.
Location, trend, and confirmation are not optional filters. They are the conditions that separate a high-probability setup from a coin flip. Remove any one of those three and the cleanest pattern on the chart becomes a low-quality trade.
Frequently Asked Questions
What is a Japanese candlestick cheat sheet?
A Japanese candlestick cheat sheet is a reference guide that maps each candlestick pattern to its signal and the specific trade rules that make it actionable. A useful cheat sheet for forex traders goes beyond naming patterns and provides the entry trigger, stop placement, and market conditions required for each setup to be valid. Pattern names alone do not tell a trader what to do.
What is the most reliable candlestick pattern in forex?
The bullish and bearish engulfing patterns are widely regarded as among the most consistently reliable because they show a decisive shift in session control across two candles. Both patterns require location alignment and a confirmation close to be valid. When they form at a major support or resistance level with trend context behind them, their signal quality is high.
Do candlestick patterns work on all timeframes?
Yes, but reliability increases on higher timeframes. A hammer on the daily chart carries more institutional weight than a hammer on the 5-minute chart because more market participants are reacting to that daily structure. Asia Forex Mentor recommends that traders learning candlestick analysis begin on the 4-hour and daily charts before applying patterns to shorter intraday timeframes.
Why do candlestick patterns fail?
Candlestick patterns fail most consistently when three conditions are absent: a meaningful structural location, trend alignment, and confirmation from the following candle. Patterns traded in isolation without these filters produce far more false signals. High-impact news releases and very low-liquidity sessions also increase false signal frequency significantly.
What is the difference between a hammer and a hanging man?
Both candles share the same shape: a small body at the top and a long lower wick with little or no upper wick. The difference is location and interpretation. A hammer appears at the bottom of a downtrend and signals a potential bullish reversal. A hanging man appears at the top of an uptrend and signals a potential bearish reversal. The candle shape is identical. Trend context determines which signal it is.