Learn To Trade Forex • Best Forex Trading Course • AsiaForexMentor

12 Forex Candlestick Indicators Ranked by Reliability

Written by

Ezekiel Chew

Updated on

August 10, 2026

i
Its a default text

12 Forex Candlestick Indicators Ranked by Reliability

Written by:

Last updated on:

August 10, 2026

Candlestick indicators fail traders not because the patterns are wrong, but because memorizing shapes without market context is not a strategy.

ABOUT THIS GUIDE

This guide ranks 12 candlestick indicators by reliability in forex, explains the buyer and seller behavior behind each pattern, and gives exact entry triggers and stop loss rules for every setup. It also covers why the same pattern behaves differently in forex versus stocks, and how to combine candlestick signals with confluence to trade setups rather than shapes. 


QUICK ANSWER

The most reliable candlestick indicators in forex are Bullish and Bearish Engulfing patterns, Pin Bars (Hammer and Shooting Star), and the Morning and Evening Star. These patterns signal a decisive shift in buyer or seller control. Reliability increases substantially when each pattern forms at a key support or resistance level with the higher-timeframe trend aligned.

Why Forex and Stocks Read Candlestick Patterns Differently

Candlestick charting originated in 18th-century Japan to track rice futures sentiment, a market with defined sessions and centralized price discovery. Forex operates as a decentralized, 24-hour, five-day-a-week market with no single exchange and no consolidated volume feed. That structural difference changes how reliable candlestick patterns are and exactly how they should be interpreted.

In stocks, a bullish engulfing candle on unusually high volume is a strong signal because centralized exchange data confirms institutional participation. In forex, every broker reports volume only from its own liquidity pool, representing a fraction of total global activity. A large green candle on a retail platform could reflect heavy retail buying with no institutional interest behind it at all.

Liquidity shifts throughout the 24-hour forex cycle. The London session, the New York session, and their overlap between 1pm and 5pm UTC generate the highest institutional participation. Candlestick patterns that form during these windows, particularly on major pairs like EURUSD and GBPUSD, carry substantially more weight than identical patterns forming during the quiet Asian session hours. A pin bar on EURUSD during the London open reflects real institutional rejection of a price level. The same pattern on USDJPY at 2am UTC is often just noise from thin market conditions.

Three Conditions That Separate Reliable Patterns From Noise

Before acting on any candlestick signal, check these three conditions. They determine whether the pattern has the environment it needs to perform.

Here are the three conditions that matter most in forex:

  • Timeframe: Patterns on H4 and Daily charts filter out the session noise that creates false signals on lower timeframes. A hammer on M15 is likely a reaction to a data release or a liquidity sweep. The same hammer on the Daily chart reflects a full session of buyer control.
  • Session timing: Patterns that form during the London or New York session, particularly around the open and during the London-New York overlap, reflect genuine institutional activity. Patterns from quiet sessions need additional confirmation before they qualify as actionable setups.
  • Key level: A candlestick pattern at a tested support or resistance level, a prior swing high or low, a significant round number, or a major moving average has measurably more predictive value than the same pattern forming in the middle of a range with no structural context.

How to Read a Candlestick Correctly

Each candlestick represents one complete period of trading activity. Four data points define every candle, and the relationship between them reveals far more than just direction.

Here is what each component shows about buyer and seller behavior:

  • The body: The rectangular section between the open and the close. A green or white body means price closed above the open. A red or black body means price closed below the open. A large body shows conviction from one side. A small body shows indecision or a contested session.
  • The upper wick: The thin line above the body showing the highest price reached during the period. A long upper wick means buyers pushed price higher but sellers pushed it back down before the close. It signals rejection of higher prices.
  • The lower wick: The thin line below the body showing the lowest price reached during the period. A long lower wick means sellers drove price lower but buyers recovered it before the close. It signals rejection of lower prices.
  • Wick-to-body ratio: The relationship between wick length and body size carries significant analytical weight. A small body with a long lower wick shows buyers had enough power to completely reverse a strong bearish push. A large body with tiny wicks shows one side dominated the entire session without meaningful resistance.
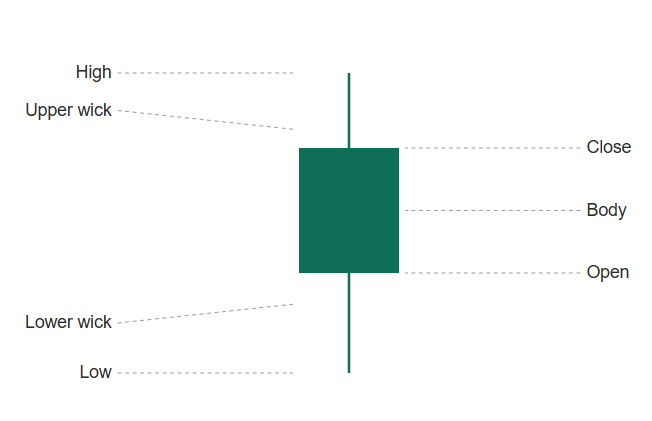
Every candle boils down to four data points — where those four points sit relative to each other is what a pattern actually reads.

The 12 Most Reliable Candlestick Indicators Ranked

The table below ranks 12 candlestick indicators from highest to lowest reliability in forex. The reliability rating reflects how consistently each pattern leads to a meaningful directional move when it forms at a key structural level on H4 or Daily timeframes.

Rank Pattern Type Reliability Best Timeframe
1 Bullish Engulfing Bullish Reversal Very High H4, Daily
2 Bearish Engulfing Bearish Reversal Very High H4, Daily
3 Hammer (Bullish Pin Bar) Bullish Reversal High H4, Daily
4 Shooting Star (Bearish Pin Bar) Bearish Reversal High H4, Daily
5 Morning Star Bullish Reversal High Daily
6 Evening Star Bearish Reversal High Daily
7 Three White Soldiers Bullish Continuation Moderate-High Daily
8 Three Black Crows Bearish Continuation Moderate-High Daily
9 Tweezer Bottom Bullish Reversal Moderate H4, Daily
10 Tweezer Top Bearish Reversal Moderate H4, Daily
11 Bullish Harami Bullish Reversal Moderate H4
12 Doji Neutral or Reversal Context-Dependent Daily

1. Bullish Engulfing

What It Looks Like: A small bearish candle is followed immediately by a large bullish candle. The body of the bullish candle completely engulfs the body of the bearish candle. The bullish candle opens at or below the prior close and closes above the prior open. The larger the engulfing body relative to the prior candle, the stronger the signal.

What It Signals: Sellers controlled the first candle. Buyers entered with enough force on the second candle to not only reverse the prior loss but extend significantly beyond it by the close. This is a decisive takeover of price, not a gradual shift. When this pattern appears at a known support level inside a bullish higher-timeframe trend, it is one of the cleanest long signals in forex.

Entry Trigger: Wait for the engulfing candle to fully close before entering. Enter long at the open of the next candle, or place a limit order at the 50% retracement of the engulfing candle's body for a tighter entry with a better risk-to-reward ratio.

Stop Loss: Place the stop below the low of the engulfing candle. That low is the structural point buyers defended during the pattern's formation. If price returns below it, the pattern's logic has broken down.

2. Bearish Engulfing

What It Looks Like: A small bullish candle is followed by a large bearish candle. The body of the bearish candle completely engulfs the body of the bullish candle. The bearish candle opens at or above the prior close and closes below the prior open.

What It Signals: Buyers were in control for the first candle. Sellers responded with overwhelming pressure, driving price low enough to completely erase the prior gains and extend further. It signals decisive rejection of the current price level, with sellers asserting institutional-level dominance over buyers by the close.

Entry Trigger: Enter short at the open of the candle following the bearish engulfing candle. Alternatively, set a limit order at the 50% retracement of the engulfing candle's body for a tighter stop and a higher reward-to-risk ratio.

Stop Loss: Place the stop above the high of the engulfing candle. If price exceeds that level, sellers have failed to maintain dominance and the pattern logic is invalid.
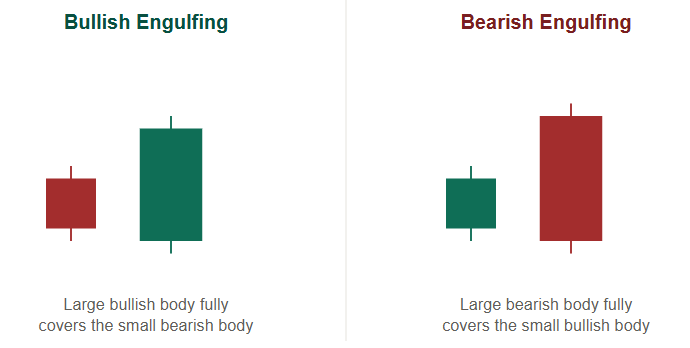
The defining feature is the same in both directions — the second body has to fully swallow the first, not just overlap it.

3. Hammer (Bullish Pin Bar)

What It Looks Like: A candle with a small real body positioned near the top of the candle's full range, little to no upper wick, and a long lower wick extending at least two times the length of the body. The pattern is defined by the wick structure, not the body color.

What It Signals: Sellers drove price significantly lower during the session. Buyers then absorbed that selling pressure and pushed price back up to close near the top of the range. The long lower wick is the visible record of that rejection. Sellers pressed their advantage and buyers refused to let them hold it.

Entry Trigger: Enter long at the open of the candle following the hammer. A more conservative approach waits for that candle to close above the high of the hammer before entering, confirming bullish momentum has continued beyond the pattern.

Stop Loss: Place the stop a few pips below the low of the hammer's lower wick. That low is the precise price level buyers defended with enough force to reverse the entire candle. If it breaks, the reversal case is gone.

4. Shooting Star (Bearish Pin Bar)

What It Looks Like: A candle with a small real body near the bottom of the candle's range, little to no lower wick, and a long upper wick extending at least two times the length of the body. This is the exact mirror image of the hammer and appears at the top of an uptrend or at a tested resistance level.

What It Signals: Buyers pushed price significantly higher during the session. Sellers then absorbed that buying pressure completely and drove price back to close near the lows. The long upper wick shows buyers could not hold the high ground. Sellers rejected the move with enough force to reverse the entire session.

Entry Trigger: Enter short at the open of the candle following the shooting star. A confirmation-based approach waits for that following candle to show clear bearish momentum before committing to the trade.

Stop Loss: Place the stop above the high of the upper wick with a small buffer. That high is the exact price level where sellers asserted control. A break above it means the rejection was temporary and buyers have resumed upward pressure.
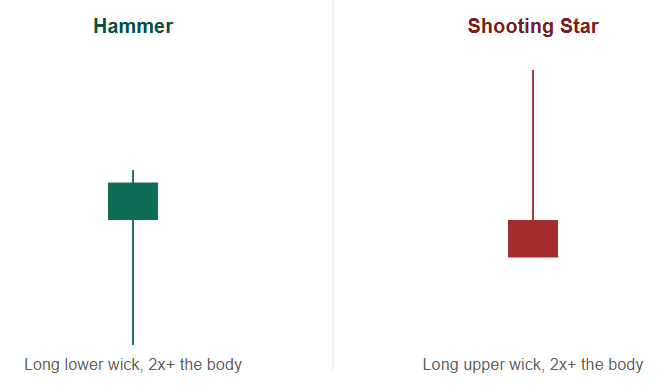
Same candle, flipped — the wick has to be at least twice the body for either one to count.

5. Morning Star

What It Looks Like: A three-candle reversal pattern. A large bearish candle opens the sequence. It's followed by a small-bodied second candle that gaps away or shows a tight range, representing indecision. The third candle then closes bullish and large, reaching at least 50% into the body of that first bearish candle.

What It Signals: The first candle shows sellers in full command. The second shows momentum stalling as selling pressure weakens and indecision enters. The third candle confirms that buyers have stepped in decisively, reclaiming significant ground. This three-step structure gives the Morning Star more confirmatory power than any single-candle reversal signal.

Entry Trigger: Enter long on the close of the third candle or at the open of the candle following the three-candle sequence. The third candle must close at least 50% into the body of the first bearish candle. A recovery of only 20-30% does not qualify as a valid Morning Star.

Stop Loss: Place the stop below the low of the second (middle) candle. That is the pivot point where the reversal actually began. If price falls below it, the reversal signal has failed.

6. Evening Star

What It Looks Like: The bearish counterpart of the Morning Star. A large bullish candle opens the sequence. A small-bodied second candle follows, possibly gapping away from the first, showing indecision. Then a large bearish third candle closes at least 50% into the body of that first bullish candle.

What It Signals: Buyers drive price strongly in the first candle. The second candle shows buyers losing conviction at a higher price level. The third candle confirms sellers have taken decisive control, erasing a substantial portion of the prior bullish move. The three-session structure confirms both exhaustion and reversal in sequence.

Entry Trigger: Enter short on the close of the third candle. Confirm the third candle closes at least 50% into the first bullish candle's body. A partial reversal that only clips the top portion of the first candle does not qualify.

Stop Loss: Place the stop above the high of the middle (second) candle. A break above that level means buyers have reasserted control and the reversal case has collapsed.
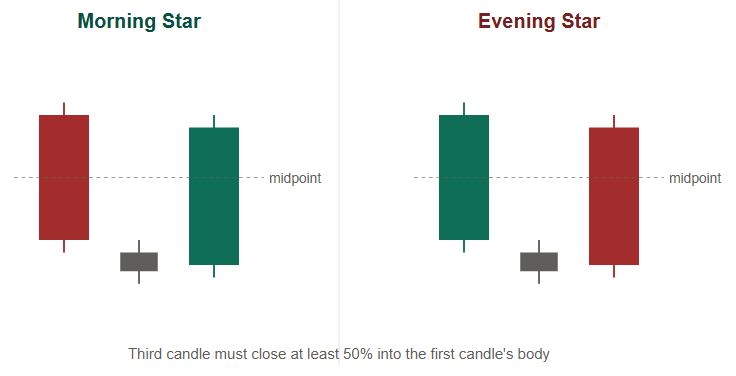
The middle candle is the tell — it marks the exact session where momentum stalled before the reversal confirmed.

7. Three White Soldiers

What It Looks Like: Three consecutive large bullish candles, each opening within the body of the previous candle and closing progressively higher. Minimal upper wicks confirm buyers held control through each close without significant pushback from sellers.

What It Signals: Sustained, organized buying pressure across three consecutive sessions. This is not a single spike of enthusiasm but systematic accumulation showing institutional conviction across multiple periods. The pattern carries the most weight after a downtrend or following a consolidation breakout.

Entry Trigger: Enter long at the open of the candle following the third soldier. Be aware that entering after three large bullish candles means buying into momentum at an elevated price. Confirm the pattern does not appear directly under a major resistance zone that could cap the move.

Stop Loss: Place the stop below the low of the first soldier candle. A return below that level suggests the multi-session buying push has lost its structural foundation.

8. Three Black Crows

What It Looks Like: Three consecutive large bearish candles, each opening within the body of the previous candle and closing progressively lower. Minimal lower wicks confirm sellers held control through each close without meaningful buyer recovery.

What It Signals: Organized, sustained selling pressure across three sessions. This confirms sellers are not reacting to a single event but pressing their advantage systematically. When this pattern appears after an uptrend or at a resistance area, it signals that sellers have decisively reasserted control.

Entry Trigger: Enter short at the open of the candle following the third crow. Be cautious if the pattern forms after the market has already dropped significantly. Entering too late into an extended move reduces the available reward.

Stop Loss: Place the stop above the high of the first crow candle. A return above that level means sellers have lost control of the move and the pattern has failed.
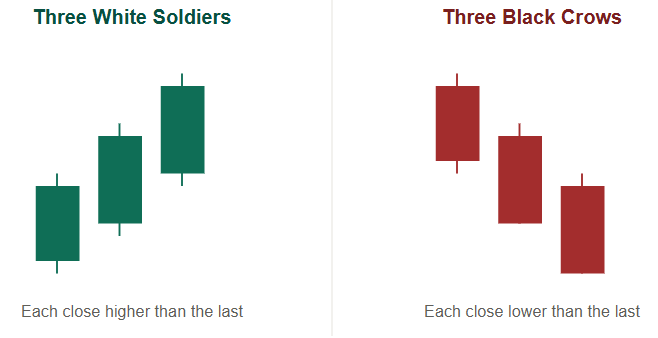
Three sessions in a row, same direction, no meaningful pushback — that's organized pressure, not a single spike.

9. Tweezer Bottom

What It Looks Like: Two consecutive candles with identical or near-identical lows. The first candle is bearish and the second candle is bullish. Both candles reach the same price level at the low before reversing. The matching lows are the defining feature of this pattern.

What It Signals: The market tested a specific price level twice on consecutive candles and rejected it both times. This double rejection shows sellers cannot sustain downward momentum through that price and that buyers are actively defending it. It is more reliable than a single reversal candle because the same support level was tested and held twice in a row.

Entry Trigger: Enter long at the open of the candle following the second (bullish) candle. The matching lows must align with a known support level or structural zone for the pattern to carry sufficient weight.

Stop Loss: Place the stop below the matching lows with a small buffer. If price breaks below the double low, the support level has failed and the pattern is invalid.

10. Tweezer Top

What It Looks Like: Two consecutive candles with identical or near-identical highs. The first candle is bullish and the second candle is bearish. Both reach the same high before reversing. This is the exact mirror image of the Tweezer Bottom.

What It Signals: The market attempted to push through a resistance level twice and was rejected on both occasions. Buyers could not sustain price above that level across two consecutive attempts. This double failure is more convincing evidence of resistance strength than a single failed breakout.

Entry Trigger: Enter short at the open of the candle following the second (bearish) candle. Confirm the matching highs align with a recognized resistance level or a prior tested swing high.

Stop Loss: Place the stop above the matching highs with a small buffer. A break above the double high means the resistance has been absorbed and the pattern logic has been invalidated.
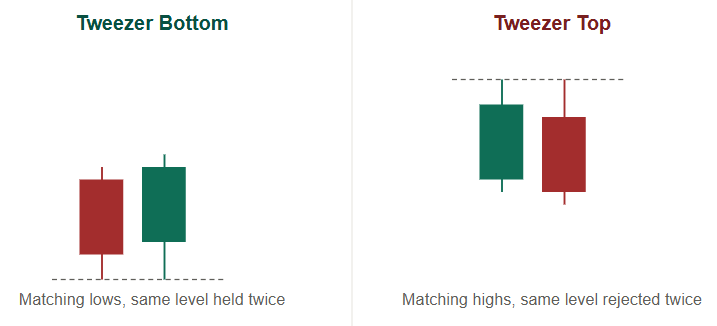
One rejection could be noise. The same level holding or failing twice in a row is a much harder thing to fake.

11. Bullish Harami

What It Looks Like: A large bearish candle followed by a small bullish candle whose entire body sits within the range of the prior bearish candle's body. The name translates to “pregnant” in Japanese, describing the visual of a small candle nested inside the larger one.

What It Signals: After a strong bearish move, momentum is slowing. The small bullish candle shows sellers can no longer produce a large bearish close. This signals hesitation rather than a completed reversal. Buyers have not overpowered sellers yet. They have simply stalled them. This is why the Harami ranks lower than engulfing patterns and requires careful confirmation before entry.

Entry Trigger: Enter long on a breakout above the high of the small inner candle. That breakout confirms buyers are taking initiative rather than just pausing the sell-off. Entering before the breakout is premature and increases the risk of a failed setup.

Stop Loss: Place the stop below the low of the inner (small bullish) candle. Using the low of the large bearish candle produces a stop that is too wide for the risk-reward to make sense on most setups.

12. Doji

What It Looks Like: A candle where the open and close are at the same or nearly the same price, producing a very small or invisible body. Wicks can extend in either direction. Common variations include the standard Doji with balanced wicks, the Gravestone Doji with a long upper wick and no lower wick, and the Dragonfly Doji with a long lower wick and no upper wick.

What It Signals: Complete indecision. Neither buyers nor sellers won the session. Taken alone, a Doji provides no directional edge. Its value comes entirely from context. A Gravestone Doji at a tested resistance level after a prolonged uptrend signals potential bearish reversal. The same candle in the middle of a ranging market signals nothing actionable.

Entry Trigger: Never enter a trade based on a Doji alone. Wait for the following candle to close in the expected direction before committing. A Gravestone Doji at resistance followed by a bearish candle close is a valid short entry. A Dragonfly Doji at support followed by a bullish candle close is a valid long entry.

Stop Loss: Place the stop beyond the extreme wick of the Doji. For a Gravestone Doji short, the stop goes above the top of the upper wick. For a Dragonfly Doji long, the stop goes below the tip of the lower wick.

How to Build a High-Probability Candlestick Trade

A candlestick pattern tells you what buyers and sellers did during a specific period of time. What it cannot tell you on its own is whether the environment supports a sustained move in that direction. Trading any pattern in isolation, without supporting context, drops the probability profile significantly.

Treat candlestick patterns as the final confirmation in a structured process, not the first reason to enter. Bias comes from the higher timeframe. The level comes from market structure analysis. The candlestick pattern is the trigger that initiates the trade. Every high-probability setup runs through those three steps in that order, which is why this approach produces high-probability setups rather than random pattern chasing.

Bollinger Bands are a practical volatility tool for gauging whether the current market environment supports a candlestick-based entry or signals conditions that are too erratic to trade.

The Three-Layer Confluence Framework

Use these three layers to assess whether any candlestick pattern is genuinely worth trading.

Here is how each layer filters setups:

  • Key level alignment: The pattern must form at a recognized structural level such as a prior swing high or low, a tested support or resistance zone, a significant round number like 1.2000 on EURUSD or 150.00 on USDJPY, or a major moving average confluence. A bearish engulfing at a clean Daily resistance level with multiple prior touches is a fundamentally different trade from the same pattern appearing at a random mid-range location.
  • Higher-timeframe trend direction: Trading reversal patterns in the direction of the higher-timeframe trend produces consistently better results than counter-trend trades. A bullish hammer on H4 is far more reliable when the Daily chart shows a clear uptrend with higher highs and higher lows. That hammer represents a pullback within an established trend that has found support, which is a structurally sound scenario.
  • Volatility and event context: Patterns forming just before major economic events such as Non-Farm Payrolls , Federal Reserve decisions, or CPI releases carry unreliable signals. The data release can completely override any technical signal. Wait for the event to print, then re-assess the pattern in the post-data environment.

Candle Close Discipline

One rule applies to all 12 patterns: enter on the confirmed close of the signal candle or the open of the following candle, never mid-candle. A pattern is only valid when the candle has fully closed. A candle that looks like a strong bullish engulfing at 95% completion might close as a small-bodied candle with a large upper wick if sellers push back in the final moments of the period.

Waiting for the close costs a few pips on the entry price. It prevents entering patterns that fail to complete. That is a far more expensive error than a slightly worse fill.

Four Mistakes That Destroy Candlestick Trading Results

Understanding the patterns is the first half of the equation. Avoiding the systematic errors most traders make around them determines whether the patterns produce consistent results over time.

Here are the four most common mistakes that destroy candlestick trading performance:

  • Trading patterns without a key level: A bullish engulfing without structural context is a directional guess, not a trade. Every pattern in the ranking above performs substantially better when it forms at a recognized price level. Without a key level, the pattern is a shape without a reason.
  • Using low timeframes as the primary signal: Patterns on M5, M15, and M30 are heavily influenced by session transitions, liquidity sweeps, and news spikes. They are useful for refining an entry already justified on H4 or Daily analysis. Building a complete strategy around low-timeframe patterns alone leads to overtrading and unpredictable results.
  • Accepting ambiguous patterns: The best setups are immediately obvious. If justification is needed for why a candle qualifies as an engulfing pattern, it probably does not qualify. Clean patterns at clean levels are the only ones worth putting capital behind.
  • Skipping the validation process: EURUSD behaves very differently from GBPJPY. The reliability of any specific pattern on any specific pair depends on historical data for that pair, not general rules from a textbook. Run at least 100 historical examples of each pattern on each pair before trusting it in live markets.

A proper back testing process is how traders validate which candlestick indicators actually perform on their specific pairs and timeframes.

Also Read: How to Read Forex Charts Before You Lose Another Trade

Conclusion

Candlestick indicators are not a trading strategy on their own. They are a language for reading what buyers and sellers did during a specific window of market activity. Learning to read that language with precision, placing every pattern in its proper context, and acting only when the broader market environment confirms the signal separates traders who compound consistently from those who chase shapes and wonder why identical setups sometimes work and sometimes fail.

Reliable candlestick traders are not the ones who know the most patterns. They are the ones who understand the market narrative behind each pattern, trade only at levels where the logic holds, and enter with a defined stop and a clear invalidation point. That discipline is what makes candlestick indicators ruthlessly effective instead of just interesting shapes on a chart.

Frequently Asked Questions

What Are the Most Reliable Candlestick Indicators for Forex Trading?

The most reliable candlestick indicators in forex are the Bullish and Bearish Engulfing patterns, the Hammer and Shooting Star (also called Pin Bars), and the Morning and Evening Star three-candle reversals. These patterns rank highest because they show a decisive and measurable shift in buyer or seller control. Reliability increases significantly when the pattern forms at a tested key level on the H4 or Daily timeframe during the London or New York trading session.

Why Do Candlestick Patterns Perform Differently in Forex Than in Stocks?

In stocks, candlestick patterns can be confirmed with centralized exchange volume data that reflects genuine institutional participation. In forex, there is no single exchange and no consolidated volume feed, so patterns must be confirmed through price structure and context rather than volume. The 24-hour forex market also creates session-based liquidity shifts that cause identical patterns to carry very different weight depending on when they form. Patterns during the London and New York sessions reflect real institutional activity, while patterns in the quiet Asian session hours on major pairs are often low-reliability noise.

What Is the Correct Stop Loss Placement for Candlestick Patterns?

Stop loss placement should be based on the structural extreme that would invalidate each pattern's logic, not on a fixed pip amount or account percentage. Engulfing patterns need the stop placed beyond the extreme of the engulfing candle. Pin Bars call for the stop beyond the tip of the wick. Three-candle reversals like Morning and Evening Stars need the stop beyond the low or high of the middle indecision candle. Placing stops based on arbitrary distances rather than pattern structure is one of the most common and costly errors in candlestick trading.

How Many Confirmation Factors Are Needed Before Entering a Candlestick Trade?

Look for at least two confirming factors beyond the pattern itself before entering. The pattern must form at a key structural level such as a tested support or resistance zone, and it must align with the direction of the higher-timeframe trend. Adding a third factor, such as high-liquidity session timing or the absence of a nearby major economic event, further improves the probability profile. Trading a candlestick pattern in complete isolation treats the shape as the signal rather than the environment around it.

What Timeframe Works Best for Candlestick Indicators in Forex?

The H4 and Daily timeframes produce the most reliable candlestick signals in forex. These timeframes filter out the session-based noise that creates false signals on M5, M15, and M30 charts. Lower timeframes are useful for refining an entry after the setup has been identified on H4 or Daily, but they should not serve as the primary basis for the trade decision. The Daily timeframe is particularly reliable for three-candle patterns like Morning Star, Evening Star, Three White Soldiers, and Three Black Crows.

About Ezekiel Chew​

Ezekiel Chew, founder and head of training at Asia Forex Mentor, is a renowned forex expert, frequently invited to speak at major industry events. Known for his deep market insights, Ezekiel is one of the top traders committed to supporting the trading community. Making six figures per trade, he also trains traders working in banks, fund management, and prop trading firms.

Average True Range Most Traders Use It Wrong

Most traders treat the average true range as a background indicator and use it the same way beginners do: glance at the number and guess at a stop loss. ABOUT THIS GUIDE This guide covers how professional forex traders actually apply the average true range. It goes from ATR stop

Read More

8 Best Day Trading Books That Actually Works

The best day trading books on most recommended lists were written for markets that no longer exist the way they once did. Traders buy the top-rated titles, work through them, and find that the strategies fail in a live account. The problem is rarely the trader. Most lists recommend books

Read More

Position Size Calculator Every Forex Trader Needs

Most traders lose their accounts not because of a bad entry call but because they put too much on the line. The position size calculator is what stops that from happening before an order is ever placed. ABOUT THIS GUIDE This guide covers what a position size calculator actually does,

Read More

How to Draw Trend Lines in Trading the Right Way 2026

Most traders drawing trend lines in trading are connecting random price points and calling it technical analysis, which is why their supposed support turns into thin air the moment price actually touches it. ABOUT THIS GUIDE This guide covers the institutional method for drawing valid trend lines in forex. It

Read More

Head and Shoulders Pattern Forex Guide 2026

Recognizing the head and shoulders pattern and trading it correctly are two entirely different skills. Most forex traders who spot the formation still end up stopped out before the move begins. The pattern appears in virtually every technical analysis curriculum and across all forex pairs and timeframes, yet the entry

Read More

AFM Trading Summit Live

Date: Coming Soon

Join us at the AFM Trading Summit Live and learn from top industry experts through live trading sessions, market insights, and actionable strategies.

12 Forex Candlestick Indicators Ranked by Reliability

4.0
Overall Trust Index

Written by:

Updated:

August 10, 2026
Candlestick indicators fail traders not because the patterns are wrong, but because memorizing shapes without market context is not a strategy.

ABOUT THIS GUIDE

This guide ranks 12 candlestick indicators by reliability in forex, explains the buyer and seller behavior behind each pattern, and gives exact entry triggers and stop loss rules for every setup. It also covers why the same pattern behaves differently in forex versus stocks, and how to combine candlestick signals with confluence to trade setups rather than shapes. 
 

QUICK ANSWER

The most reliable candlestick indicators in forex are Bullish and Bearish Engulfing patterns, Pin Bars (Hammer and Shooting Star), and the Morning and Evening Star. These patterns signal a decisive shift in buyer or seller control. Reliability increases substantially when each pattern forms at a key support or resistance level with the higher-timeframe trend aligned.

Why Forex and Stocks Read Candlestick Patterns Differently

Candlestick charting originated in 18th-century Japan to track rice futures sentiment, a market with defined sessions and centralized price discovery. Forex operates as a decentralized, 24-hour, five-day-a-week market with no single exchange and no consolidated volume feed. That structural difference changes how reliable candlestick patterns are and exactly how they should be interpreted.

In stocks, a bullish engulfing candle on unusually high volume is a strong signal because centralized exchange data confirms institutional participation. In forex, every broker reports volume only from its own liquidity pool, representing a fraction of total global activity. A large green candle on a retail platform could reflect heavy retail buying with no institutional interest behind it at all.

Liquidity shifts throughout the 24-hour forex cycle. The London session, the New York session, and their overlap between 1pm and 5pm UTC generate the highest institutional participation. Candlestick patterns that form during these windows, particularly on major pairs like EURUSD and GBPUSD, carry substantially more weight than identical patterns forming during the quiet Asian session hours. A pin bar on EURUSD during the London open reflects real institutional rejection of a price level. The same pattern on USDJPY at 2am UTC is often just noise from thin market conditions.

Three Conditions That Separate Reliable Patterns From Noise

Before acting on any candlestick signal, check these three conditions. They determine whether the pattern has the environment it needs to perform.

Here are the three conditions that matter most in forex:

  • Timeframe: Patterns on H4 and Daily charts filter out the session noise that creates false signals on lower timeframes. A hammer on M15 is likely a reaction to a data release or a liquidity sweep. The same hammer on the Daily chart reflects a full session of buyer control.
  • Session timing: Patterns that form during the London or New York session, particularly around the open and during the London-New York overlap, reflect genuine institutional activity. Patterns from quiet sessions need additional confirmation before they qualify as actionable setups.
  • Key level: A candlestick pattern at a tested support or resistance level, a prior swing high or low, a significant round number, or a major moving average has measurably more predictive value than the same pattern forming in the middle of a range with no structural context.

How to Read a Candlestick Correctly

Each candlestick represents one complete period of trading activity. Four data points define every candle, and the relationship between them reveals far more than just direction.

Here is what each component shows about buyer and seller behavior:

  • The body: The rectangular section between the open and the close. A green or white body means price closed above the open. A red or black body means price closed below the open. A large body shows conviction from one side. A small body shows indecision or a contested session.
  • The upper wick: The thin line above the body showing the highest price reached during the period. A long upper wick means buyers pushed price higher but sellers pushed it back down before the close. It signals rejection of higher prices.
  • The lower wick: The thin line below the body showing the lowest price reached during the period. A long lower wick means sellers drove price lower but buyers recovered it before the close. It signals rejection of lower prices.
  • Wick-to-body ratio: The relationship between wick length and body size carries significant analytical weight. A small body with a long lower wick shows buyers had enough power to completely reverse a strong bearish push. A large body with tiny wicks shows one side dominated the entire session without meaningful resistance.

Every candle boils down to four data points — where those four points sit relative to each other is what a pattern actually reads.

The 12 Most Reliable Candlestick Indicators Ranked

The table below ranks 12 candlestick indicators from highest to lowest reliability in forex. The reliability rating reflects how consistently each pattern leads to a meaningful directional move when it forms at a key structural level on H4 or Daily timeframes.

Rank Pattern Type Reliability Best Timeframe
1 Bullish Engulfing Bullish Reversal Very High H4, Daily
2 Bearish Engulfing Bearish Reversal Very High H4, Daily
3 Hammer (Bullish Pin Bar) Bullish Reversal High H4, Daily
4 Shooting Star (Bearish Pin Bar) Bearish Reversal High H4, Daily
5 Morning Star Bullish Reversal High Daily
6 Evening Star Bearish Reversal High Daily
7 Three White Soldiers Bullish Continuation Moderate-High Daily
8 Three Black Crows Bearish Continuation Moderate-High Daily
9 Tweezer Bottom Bullish Reversal Moderate H4, Daily
10 Tweezer Top Bearish Reversal Moderate H4, Daily
11 Bullish Harami Bullish Reversal Moderate H4
12 Doji Neutral or Reversal Context-Dependent Daily

1. Bullish Engulfing

What It Looks Like: A small bearish candle is followed immediately by a large bullish candle. The body of the bullish candle completely engulfs the body of the bearish candle. The bullish candle opens at or below the prior close and closes above the prior open. The larger the engulfing body relative to the prior candle, the stronger the signal.

What It Signals: Sellers controlled the first candle. Buyers entered with enough force on the second candle to not only reverse the prior loss but extend significantly beyond it by the close. This is a decisive takeover of price, not a gradual shift. When this pattern appears at a known support level inside a bullish higher-timeframe trend, it is one of the cleanest long signals in forex.

Entry Trigger: Wait for the engulfing candle to fully close before entering. Enter long at the open of the next candle, or place a limit order at the 50% retracement of the engulfing candle's body for a tighter entry with a better risk-to-reward ratio.

Stop Loss: Place the stop below the low of the engulfing candle. That low is the structural point buyers defended during the pattern's formation. If price returns below it, the pattern's logic has broken down.

2. Bearish Engulfing

What It Looks Like: A small bullish candle is followed by a large bearish candle. The body of the bearish candle completely engulfs the body of the bullish candle. The bearish candle opens at or above the prior close and closes below the prior open.

What It Signals: Buyers were in control for the first candle. Sellers responded with overwhelming pressure, driving price low enough to completely erase the prior gains and extend further. It signals decisive rejection of the current price level, with sellers asserting institutional-level dominance over buyers by the close.

Entry Trigger: Enter short at the open of the candle following the bearish engulfing candle. Alternatively, set a limit order at the 50% retracement of the engulfing candle's body for a tighter stop and a higher reward-to-risk ratio.

Stop Loss: Place the stop above the high of the engulfing candle. If price exceeds that level, sellers have failed to maintain dominance and the pattern logic is invalid.

The defining feature is the same in both directions — the second body has to fully swallow the first, not just overlap it.

3. Hammer (Bullish Pin Bar)

What It Looks Like: A candle with a small real body positioned near the top of the candle's full range, little to no upper wick, and a long lower wick extending at least two times the length of the body. The pattern is defined by the wick structure, not the body color.

What It Signals: Sellers drove price significantly lower during the session. Buyers then absorbed that selling pressure and pushed price back up to close near the top of the range. The long lower wick is the visible record of that rejection. Sellers pressed their advantage and buyers refused to let them hold it.

Entry Trigger: Enter long at the open of the candle following the hammer. A more conservative approach waits for that candle to close above the high of the hammer before entering, confirming bullish momentum has continued beyond the pattern.

Stop Loss: Place the stop a few pips below the low of the hammer's lower wick. That low is the precise price level buyers defended with enough force to reverse the entire candle. If it breaks, the reversal case is gone.

4. Shooting Star (Bearish Pin Bar)

What It Looks Like: A candle with a small real body near the bottom of the candle's range, little to no lower wick, and a long upper wick extending at least two times the length of the body. This is the exact mirror image of the hammer and appears at the top of an uptrend or at a tested resistance level.

What It Signals: Buyers pushed price significantly higher during the session. Sellers then absorbed that buying pressure completely and drove price back to close near the lows. The long upper wick shows buyers could not hold the high ground. Sellers rejected the move with enough force to reverse the entire session.

Entry Trigger: Enter short at the open of the candle following the shooting star. A confirmation-based approach waits for that following candle to show clear bearish momentum before committing to the trade.

Stop Loss: Place the stop above the high of the upper wick with a small buffer. That high is the exact price level where sellers asserted control. A break above it means the rejection was temporary and buyers have resumed upward pressure.

Same candle, flipped — the wick has to be at least twice the body for either one to count.

5. Morning Star

What It Looks Like: A three-candle reversal pattern. A large bearish candle opens the sequence. It's followed by a small-bodied second candle that gaps away or shows a tight range, representing indecision. The third candle then closes bullish and large, reaching at least 50% into the body of that first bearish candle.

What It Signals: The first candle shows sellers in full command. The second shows momentum stalling as selling pressure weakens and indecision enters. The third candle confirms that buyers have stepped in decisively, reclaiming significant ground. This three-step structure gives the Morning Star more confirmatory power than any single-candle reversal signal.

Entry Trigger: Enter long on the close of the third candle or at the open of the candle following the three-candle sequence. The third candle must close at least 50% into the body of the first bearish candle. A recovery of only 20-30% does not qualify as a valid Morning Star.

Stop Loss: Place the stop below the low of the second (middle) candle. That is the pivot point where the reversal actually began. If price falls below it, the reversal signal has failed.

6. Evening Star

What It Looks Like: The bearish counterpart of the Morning Star. A large bullish candle opens the sequence. A small-bodied second candle follows, possibly gapping away from the first, showing indecision. Then a large bearish third candle closes at least 50% into the body of that first bullish candle.

What It Signals: Buyers drive price strongly in the first candle. The second candle shows buyers losing conviction at a higher price level. The third candle confirms sellers have taken decisive control, erasing a substantial portion of the prior bullish move. The three-session structure confirms both exhaustion and reversal in sequence.

Entry Trigger: Enter short on the close of the third candle. Confirm the third candle closes at least 50% into the first bullish candle's body. A partial reversal that only clips the top portion of the first candle does not qualify.

Stop Loss: Place the stop above the high of the middle (second) candle. A break above that level means buyers have reasserted control and the reversal case has collapsed.

The middle candle is the tell — it marks the exact session where momentum stalled before the reversal confirmed.

7. Three White Soldiers

What It Looks Like: Three consecutive large bullish candles, each opening within the body of the previous candle and closing progressively higher. Minimal upper wicks confirm buyers held control through each close without significant pushback from sellers.

What It Signals: Sustained, organized buying pressure across three consecutive sessions. This is not a single spike of enthusiasm but systematic accumulation showing institutional conviction across multiple periods. The pattern carries the most weight after a downtrend or following a consolidation breakout.

Entry Trigger: Enter long at the open of the candle following the third soldier. Be aware that entering after three large bullish candles means buying into momentum at an elevated price. Confirm the pattern does not appear directly under a major resistance zone that could cap the move.

Stop Loss: Place the stop below the low of the first soldier candle. A return below that level suggests the multi-session buying push has lost its structural foundation.

8. Three Black Crows

What It Looks Like: Three consecutive large bearish candles, each opening within the body of the previous candle and closing progressively lower. Minimal lower wicks confirm sellers held control through each close without meaningful buyer recovery.

What It Signals: Organized, sustained selling pressure across three sessions. This confirms sellers are not reacting to a single event but pressing their advantage systematically. When this pattern appears after an uptrend or at a resistance area, it signals that sellers have decisively reasserted control.

Entry Trigger: Enter short at the open of the candle following the third crow. Be cautious if the pattern forms after the market has already dropped significantly. Entering too late into an extended move reduces the available reward.

Stop Loss: Place the stop above the high of the first crow candle. A return above that level means sellers have lost control of the move and the pattern has failed.

Three sessions in a row, same direction, no meaningful pushback — that's organized pressure, not a single spike.

9. Tweezer Bottom

What It Looks Like: Two consecutive candles with identical or near-identical lows. The first candle is bearish and the second candle is bullish. Both candles reach the same price level at the low before reversing. The matching lows are the defining feature of this pattern.

What It Signals: The market tested a specific price level twice on consecutive candles and rejected it both times. This double rejection shows sellers cannot sustain downward momentum through that price and that buyers are actively defending it. It is more reliable than a single reversal candle because the same support level was tested and held twice in a row.

Entry Trigger: Enter long at the open of the candle following the second (bullish) candle. The matching lows must align with a known support level or structural zone for the pattern to carry sufficient weight.

Stop Loss: Place the stop below the matching lows with a small buffer. If price breaks below the double low, the support level has failed and the pattern is invalid.

10. Tweezer Top

What It Looks Like: Two consecutive candles with identical or near-identical highs. The first candle is bullish and the second candle is bearish. Both reach the same high before reversing. This is the exact mirror image of the Tweezer Bottom.

What It Signals: The market attempted to push through a resistance level twice and was rejected on both occasions. Buyers could not sustain price above that level across two consecutive attempts. This double failure is more convincing evidence of resistance strength than a single failed breakout.

Entry Trigger: Enter short at the open of the candle following the second (bearish) candle. Confirm the matching highs align with a recognized resistance level or a prior tested swing high.

Stop Loss: Place the stop above the matching highs with a small buffer. A break above the double high means the resistance has been absorbed and the pattern logic has been invalidated.

One rejection could be noise. The same level holding or failing twice in a row is a much harder thing to fake.

11. Bullish Harami

What It Looks Like: A large bearish candle followed by a small bullish candle whose entire body sits within the range of the prior bearish candle's body. The name translates to "pregnant" in Japanese, describing the visual of a small candle nested inside the larger one.

What It Signals: After a strong bearish move, momentum is slowing. The small bullish candle shows sellers can no longer produce a large bearish close. This signals hesitation rather than a completed reversal. Buyers have not overpowered sellers yet. They have simply stalled them. This is why the Harami ranks lower than engulfing patterns and requires careful confirmation before entry.

Entry Trigger: Enter long on a breakout above the high of the small inner candle. That breakout confirms buyers are taking initiative rather than just pausing the sell-off. Entering before the breakout is premature and increases the risk of a failed setup.

Stop Loss: Place the stop below the low of the inner (small bullish) candle. Using the low of the large bearish candle produces a stop that is too wide for the risk-reward to make sense on most setups.

12. Doji

What It Looks Like: A candle where the open and close are at the same or nearly the same price, producing a very small or invisible body. Wicks can extend in either direction. Common variations include the standard Doji with balanced wicks, the Gravestone Doji with a long upper wick and no lower wick, and the Dragonfly Doji with a long lower wick and no upper wick.

What It Signals: Complete indecision. Neither buyers nor sellers won the session. Taken alone, a Doji provides no directional edge. Its value comes entirely from context. A Gravestone Doji at a tested resistance level after a prolonged uptrend signals potential bearish reversal. The same candle in the middle of a ranging market signals nothing actionable.

Entry Trigger: Never enter a trade based on a Doji alone. Wait for the following candle to close in the expected direction before committing. A Gravestone Doji at resistance followed by a bearish candle close is a valid short entry. A Dragonfly Doji at support followed by a bullish candle close is a valid long entry.

Stop Loss: Place the stop beyond the extreme wick of the Doji. For a Gravestone Doji short, the stop goes above the top of the upper wick. For a Dragonfly Doji long, the stop goes below the tip of the lower wick.

How to Build a High-Probability Candlestick Trade

A candlestick pattern tells you what buyers and sellers did during a specific period of time. What it cannot tell you on its own is whether the environment supports a sustained move in that direction. Trading any pattern in isolation, without supporting context, drops the probability profile significantly.

Treat candlestick patterns as the final confirmation in a structured process, not the first reason to enter. Bias comes from the higher timeframe. The level comes from market structure analysis. The candlestick pattern is the trigger that initiates the trade. Every high-probability setup runs through those three steps in that order, which is why this approach produces high-probability setups rather than random pattern chasing.

Bollinger Bands are a practical volatility tool for gauging whether the current market environment supports a candlestick-based entry or signals conditions that are too erratic to trade.

The Three-Layer Confluence Framework

Use these three layers to assess whether any candlestick pattern is genuinely worth trading.

Here is how each layer filters setups:

  • Key level alignment: The pattern must form at a recognized structural level such as a prior swing high or low, a tested support or resistance zone, a significant round number like 1.2000 on EURUSD or 150.00 on USDJPY, or a major moving average confluence. A bearish engulfing at a clean Daily resistance level with multiple prior touches is a fundamentally different trade from the same pattern appearing at a random mid-range location.
  • Higher-timeframe trend direction: Trading reversal patterns in the direction of the higher-timeframe trend produces consistently better results than counter-trend trades. A bullish hammer on H4 is far more reliable when the Daily chart shows a clear uptrend with higher highs and higher lows. That hammer represents a pullback within an established trend that has found support, which is a structurally sound scenario.
  • Volatility and event context: Patterns forming just before major economic events such as Non-Farm Payrolls, Federal Reserve decisions, or CPI releases carry unreliable signals. The data release can completely override any technical signal. Wait for the event to print, then re-assess the pattern in the post-data environment.

Candle Close Discipline

One rule applies to all 12 patterns: enter on the confirmed close of the signal candle or the open of the following candle, never mid-candle. A pattern is only valid when the candle has fully closed. A candle that looks like a strong bullish engulfing at 95% completion might close as a small-bodied candle with a large upper wick if sellers push back in the final moments of the period.

Waiting for the close costs a few pips on the entry price. It prevents entering patterns that fail to complete. That is a far more expensive error than a slightly worse fill.

Four Mistakes That Destroy Candlestick Trading Results

Understanding the patterns is the first half of the equation. Avoiding the systematic errors most traders make around them determines whether the patterns produce consistent results over time.

Here are the four most common mistakes that destroy candlestick trading performance:

  • Trading patterns without a key level: A bullish engulfing without structural context is a directional guess, not a trade. Every pattern in the ranking above performs substantially better when it forms at a recognized price level. Without a key level, the pattern is a shape without a reason.
  • Using low timeframes as the primary signal: Patterns on M5, M15, and M30 are heavily influenced by session transitions, liquidity sweeps, and news spikes. They are useful for refining an entry already justified on H4 or Daily analysis. Building a complete strategy around low-timeframe patterns alone leads to overtrading and unpredictable results.
  • Accepting ambiguous patterns: The best setups are immediately obvious. If justification is needed for why a candle qualifies as an engulfing pattern, it probably does not qualify. Clean patterns at clean levels are the only ones worth putting capital behind.
  • Skipping the validation process: EURUSD behaves very differently from GBPJPY. The reliability of any specific pattern on any specific pair depends on historical data for that pair, not general rules from a textbook. Run at least 100 historical examples of each pattern on each pair before trusting it in live markets.

A proper back testing process is how traders validate which candlestick indicators actually perform on their specific pairs and timeframes.

Also Read: How to Read Forex Charts Before You Lose Another Trade

Conclusion

Candlestick indicators are not a trading strategy on their own. They are a language for reading what buyers and sellers did during a specific window of market activity. Learning to read that language with precision, placing every pattern in its proper context, and acting only when the broader market environment confirms the signal separates traders who compound consistently from those who chase shapes and wonder why identical setups sometimes work and sometimes fail.

Reliable candlestick traders are not the ones who know the most patterns. They are the ones who understand the market narrative behind each pattern, trade only at levels where the logic holds, and enter with a defined stop and a clear invalidation point. That discipline is what makes candlestick indicators ruthlessly effective instead of just interesting shapes on a chart.

Frequently Asked Questions

What Are the Most Reliable Candlestick Indicators for Forex Trading?

The most reliable candlestick indicators in forex are the Bullish and Bearish Engulfing patterns, the Hammer and Shooting Star (also called Pin Bars), and the Morning and Evening Star three-candle reversals. These patterns rank highest because they show a decisive and measurable shift in buyer or seller control. Reliability increases significantly when the pattern forms at a tested key level on the H4 or Daily timeframe during the London or New York trading session.

Why Do Candlestick Patterns Perform Differently in Forex Than in Stocks?

In stocks, candlestick patterns can be confirmed with centralized exchange volume data that reflects genuine institutional participation. In forex, there is no single exchange and no consolidated volume feed, so patterns must be confirmed through price structure and context rather than volume. The 24-hour forex market also creates session-based liquidity shifts that cause identical patterns to carry very different weight depending on when they form. Patterns during the London and New York sessions reflect real institutional activity, while patterns in the quiet Asian session hours on major pairs are often low-reliability noise.

What Is the Correct Stop Loss Placement for Candlestick Patterns?

Stop loss placement should be based on the structural extreme that would invalidate each pattern's logic, not on a fixed pip amount or account percentage. Engulfing patterns need the stop placed beyond the extreme of the engulfing candle. Pin Bars call for the stop beyond the tip of the wick. Three-candle reversals like Morning and Evening Stars need the stop beyond the low or high of the middle indecision candle. Placing stops based on arbitrary distances rather than pattern structure is one of the most common and costly errors in candlestick trading.

How Many Confirmation Factors Are Needed Before Entering a Candlestick Trade?

Look for at least two confirming factors beyond the pattern itself before entering. The pattern must form at a key structural level such as a tested support or resistance zone, and it must align with the direction of the higher-timeframe trend. Adding a third factor, such as high-liquidity session timing or the absence of a nearby major economic event, further improves the probability profile. Trading a candlestick pattern in complete isolation treats the shape as the signal rather than the environment around it.

What Timeframe Works Best for Candlestick Indicators in Forex?

The H4 and Daily timeframes produce the most reliable candlestick signals in forex. These timeframes filter out the session-based noise that creates false signals on M5, M15, and M30 charts. Lower timeframes are useful for refining an entry after the setup has been identified on H4 or Daily, but they should not serve as the primary basis for the trade decision. The Daily timeframe is particularly reliable for three-candle patterns like Morning Star, Evening Star, Three White Soldiers, and Three Black Crows.
ezekiel chew asiaforexmentor

About Ezekiel Chew

Ezekiel Chew, founder and head of training at Asia Forex Mentor, is a renowned forex expert, frequently invited to speak at major industry events. Known for his deep market insights, Ezekiel is one of the top traders committed to supporting the trading community. Making six figures per trade, he also trains traders working in banks, fund management, and prop trading firms.

RELATED ARTICLES

12 Forex Candlestick Indicators Ranked by Reliability

4.0
Overall Trust Index

Written by:

Updated:

August 10, 2026
Candlestick indicators fail traders not because the patterns are wrong, but because memorizing shapes without market context is not a strategy.

ABOUT THIS GUIDE

This guide ranks 12 candlestick indicators by reliability in forex, explains the buyer and seller behavior behind each pattern, and gives exact entry triggers and stop loss rules for every setup. It also covers why the same pattern behaves differently in forex versus stocks, and how to combine candlestick signals with confluence to trade setups rather than shapes. 
 

QUICK ANSWER

The most reliable candlestick indicators in forex are Bullish and Bearish Engulfing patterns, Pin Bars (Hammer and Shooting Star), and the Morning and Evening Star. These patterns signal a decisive shift in buyer or seller control. Reliability increases substantially when each pattern forms at a key support or resistance level with the higher-timeframe trend aligned.

Why Forex and Stocks Read Candlestick Patterns Differently

Candlestick charting originated in 18th-century Japan to track rice futures sentiment, a market with defined sessions and centralized price discovery. Forex operates as a decentralized, 24-hour, five-day-a-week market with no single exchange and no consolidated volume feed. That structural difference changes how reliable candlestick patterns are and exactly how they should be interpreted.

In stocks, a bullish engulfing candle on unusually high volume is a strong signal because centralized exchange data confirms institutional participation. In forex, every broker reports volume only from its own liquidity pool, representing a fraction of total global activity. A large green candle on a retail platform could reflect heavy retail buying with no institutional interest behind it at all.

Liquidity shifts throughout the 24-hour forex cycle. The London session, the New York session, and their overlap between 1pm and 5pm UTC generate the highest institutional participation. Candlestick patterns that form during these windows, particularly on major pairs like EURUSD and GBPUSD, carry substantially more weight than identical patterns forming during the quiet Asian session hours. A pin bar on EURUSD during the London open reflects real institutional rejection of a price level. The same pattern on USDJPY at 2am UTC is often just noise from thin market conditions.

Three Conditions That Separate Reliable Patterns From Noise

Before acting on any candlestick signal, check these three conditions. They determine whether the pattern has the environment it needs to perform.

Here are the three conditions that matter most in forex:

  • Timeframe: Patterns on H4 and Daily charts filter out the session noise that creates false signals on lower timeframes. A hammer on M15 is likely a reaction to a data release or a liquidity sweep. The same hammer on the Daily chart reflects a full session of buyer control.
  • Session timing: Patterns that form during the London or New York session, particularly around the open and during the London-New York overlap, reflect genuine institutional activity. Patterns from quiet sessions need additional confirmation before they qualify as actionable setups.
  • Key level: A candlestick pattern at a tested support or resistance level, a prior swing high or low, a significant round number, or a major moving average has measurably more predictive value than the same pattern forming in the middle of a range with no structural context.

How to Read a Candlestick Correctly

Each candlestick represents one complete period of trading activity. Four data points define every candle, and the relationship between them reveals far more than just direction.

Here is what each component shows about buyer and seller behavior:

  • The body: The rectangular section between the open and the close. A green or white body means price closed above the open. A red or black body means price closed below the open. A large body shows conviction from one side. A small body shows indecision or a contested session.
  • The upper wick: The thin line above the body showing the highest price reached during the period. A long upper wick means buyers pushed price higher but sellers pushed it back down before the close. It signals rejection of higher prices.
  • The lower wick: The thin line below the body showing the lowest price reached during the period. A long lower wick means sellers drove price lower but buyers recovered it before the close. It signals rejection of lower prices.
  • Wick-to-body ratio: The relationship between wick length and body size carries significant analytical weight. A small body with a long lower wick shows buyers had enough power to completely reverse a strong bearish push. A large body with tiny wicks shows one side dominated the entire session without meaningful resistance.

Every candle boils down to four data points — where those four points sit relative to each other is what a pattern actually reads.

The 12 Most Reliable Candlestick Indicators Ranked

The table below ranks 12 candlestick indicators from highest to lowest reliability in forex. The reliability rating reflects how consistently each pattern leads to a meaningful directional move when it forms at a key structural level on H4 or Daily timeframes.

Rank Pattern Type Reliability Best Timeframe
1 Bullish Engulfing Bullish Reversal Very High H4, Daily
2 Bearish Engulfing Bearish Reversal Very High H4, Daily
3 Hammer (Bullish Pin Bar) Bullish Reversal High H4, Daily
4 Shooting Star (Bearish Pin Bar) Bearish Reversal High H4, Daily
5 Morning Star Bullish Reversal High Daily
6 Evening Star Bearish Reversal High Daily
7 Three White Soldiers Bullish Continuation Moderate-High Daily
8 Three Black Crows Bearish Continuation Moderate-High Daily
9 Tweezer Bottom Bullish Reversal Moderate H4, Daily
10 Tweezer Top Bearish Reversal Moderate H4, Daily
11 Bullish Harami Bullish Reversal Moderate H4
12 Doji Neutral or Reversal Context-Dependent Daily

1. Bullish Engulfing

What It Looks Like: A small bearish candle is followed immediately by a large bullish candle. The body of the bullish candle completely engulfs the body of the bearish candle. The bullish candle opens at or below the prior close and closes above the prior open. The larger the engulfing body relative to the prior candle, the stronger the signal.

What It Signals: Sellers controlled the first candle. Buyers entered with enough force on the second candle to not only reverse the prior loss but extend significantly beyond it by the close. This is a decisive takeover of price, not a gradual shift. When this pattern appears at a known support level inside a bullish higher-timeframe trend, it is one of the cleanest long signals in forex.

Entry Trigger: Wait for the engulfing candle to fully close before entering. Enter long at the open of the next candle, or place a limit order at the 50% retracement of the engulfing candle's body for a tighter entry with a better risk-to-reward ratio.

Stop Loss: Place the stop below the low of the engulfing candle. That low is the structural point buyers defended during the pattern's formation. If price returns below it, the pattern's logic has broken down.

2. Bearish Engulfing

What It Looks Like: A small bullish candle is followed by a large bearish candle. The body of the bearish candle completely engulfs the body of the bullish candle. The bearish candle opens at or above the prior close and closes below the prior open.

What It Signals: Buyers were in control for the first candle. Sellers responded with overwhelming pressure, driving price low enough to completely erase the prior gains and extend further. It signals decisive rejection of the current price level, with sellers asserting institutional-level dominance over buyers by the close.

Entry Trigger: Enter short at the open of the candle following the bearish engulfing candle. Alternatively, set a limit order at the 50% retracement of the engulfing candle's body for a tighter stop and a higher reward-to-risk ratio.

Stop Loss: Place the stop above the high of the engulfing candle. If price exceeds that level, sellers have failed to maintain dominance and the pattern logic is invalid.

The defining feature is the same in both directions — the second body has to fully swallow the first, not just overlap it.

3. Hammer (Bullish Pin Bar)

What It Looks Like: A candle with a small real body positioned near the top of the candle's full range, little to no upper wick, and a long lower wick extending at least two times the length of the body. The pattern is defined by the wick structure, not the body color.

What It Signals: Sellers drove price significantly lower during the session. Buyers then absorbed that selling pressure and pushed price back up to close near the top of the range. The long lower wick is the visible record of that rejection. Sellers pressed their advantage and buyers refused to let them hold it.

Entry Trigger: Enter long at the open of the candle following the hammer. A more conservative approach waits for that candle to close above the high of the hammer before entering, confirming bullish momentum has continued beyond the pattern.

Stop Loss: Place the stop a few pips below the low of the hammer's lower wick. That low is the precise price level buyers defended with enough force to reverse the entire candle. If it breaks, the reversal case is gone.

4. Shooting Star (Bearish Pin Bar)

What It Looks Like: A candle with a small real body near the bottom of the candle's range, little to no lower wick, and a long upper wick extending at least two times the length of the body. This is the exact mirror image of the hammer and appears at the top of an uptrend or at a tested resistance level.

What It Signals: Buyers pushed price significantly higher during the session. Sellers then absorbed that buying pressure completely and drove price back to close near the lows. The long upper wick shows buyers could not hold the high ground. Sellers rejected the move with enough force to reverse the entire session.

Entry Trigger: Enter short at the open of the candle following the shooting star. A confirmation-based approach waits for that following candle to show clear bearish momentum before committing to the trade.

Stop Loss: Place the stop above the high of the upper wick with a small buffer. That high is the exact price level where sellers asserted control. A break above it means the rejection was temporary and buyers have resumed upward pressure.

Same candle, flipped — the wick has to be at least twice the body for either one to count.

5. Morning Star

What It Looks Like: A three-candle reversal pattern. A large bearish candle opens the sequence. It's followed by a small-bodied second candle that gaps away or shows a tight range, representing indecision. The third candle then closes bullish and large, reaching at least 50% into the body of that first bearish candle.

What It Signals: The first candle shows sellers in full command. The second shows momentum stalling as selling pressure weakens and indecision enters. The third candle confirms that buyers have stepped in decisively, reclaiming significant ground. This three-step structure gives the Morning Star more confirmatory power than any single-candle reversal signal.

Entry Trigger: Enter long on the close of the third candle or at the open of the candle following the three-candle sequence. The third candle must close at least 50% into the body of the first bearish candle. A recovery of only 20-30% does not qualify as a valid Morning Star.

Stop Loss: Place the stop below the low of the second (middle) candle. That is the pivot point where the reversal actually began. If price falls below it, the reversal signal has failed.

6. Evening Star

What It Looks Like: The bearish counterpart of the Morning Star. A large bullish candle opens the sequence. A small-bodied second candle follows, possibly gapping away from the first, showing indecision. Then a large bearish third candle closes at least 50% into the body of that first bullish candle.

What It Signals: Buyers drive price strongly in the first candle. The second candle shows buyers losing conviction at a higher price level. The third candle confirms sellers have taken decisive control, erasing a substantial portion of the prior bullish move. The three-session structure confirms both exhaustion and reversal in sequence.

Entry Trigger: Enter short on the close of the third candle. Confirm the third candle closes at least 50% into the first bullish candle's body. A partial reversal that only clips the top portion of the first candle does not qualify.

Stop Loss: Place the stop above the high of the middle (second) candle. A break above that level means buyers have reasserted control and the reversal case has collapsed.

The middle candle is the tell — it marks the exact session where momentum stalled before the reversal confirmed.

7. Three White Soldiers

What It Looks Like: Three consecutive large bullish candles, each opening within the body of the previous candle and closing progressively higher. Minimal upper wicks confirm buyers held control through each close without significant pushback from sellers.

What It Signals: Sustained, organized buying pressure across three consecutive sessions. This is not a single spike of enthusiasm but systematic accumulation showing institutional conviction across multiple periods. The pattern carries the most weight after a downtrend or following a consolidation breakout.

Entry Trigger: Enter long at the open of the candle following the third soldier. Be aware that entering after three large bullish candles means buying into momentum at an elevated price. Confirm the pattern does not appear directly under a major resistance zone that could cap the move.

Stop Loss: Place the stop below the low of the first soldier candle. A return below that level suggests the multi-session buying push has lost its structural foundation.

8. Three Black Crows

What It Looks Like: Three consecutive large bearish candles, each opening within the body of the previous candle and closing progressively lower. Minimal lower wicks confirm sellers held control through each close without meaningful buyer recovery.

What It Signals: Organized, sustained selling pressure across three sessions. This confirms sellers are not reacting to a single event but pressing their advantage systematically. When this pattern appears after an uptrend or at a resistance area, it signals that sellers have decisively reasserted control.

Entry Trigger: Enter short at the open of the candle following the third crow. Be cautious if the pattern forms after the market has already dropped significantly. Entering too late into an extended move reduces the available reward.

Stop Loss: Place the stop above the high of the first crow candle. A return above that level means sellers have lost control of the move and the pattern has failed.

Three sessions in a row, same direction, no meaningful pushback — that's organized pressure, not a single spike.

9. Tweezer Bottom

What It Looks Like: Two consecutive candles with identical or near-identical lows. The first candle is bearish and the second candle is bullish. Both candles reach the same price level at the low before reversing. The matching lows are the defining feature of this pattern.

What It Signals: The market tested a specific price level twice on consecutive candles and rejected it both times. This double rejection shows sellers cannot sustain downward momentum through that price and that buyers are actively defending it. It is more reliable than a single reversal candle because the same support level was tested and held twice in a row.

Entry Trigger: Enter long at the open of the candle following the second (bullish) candle. The matching lows must align with a known support level or structural zone for the pattern to carry sufficient weight.

Stop Loss: Place the stop below the matching lows with a small buffer. If price breaks below the double low, the support level has failed and the pattern is invalid.

10. Tweezer Top

What It Looks Like: Two consecutive candles with identical or near-identical highs. The first candle is bullish and the second candle is bearish. Both reach the same high before reversing. This is the exact mirror image of the Tweezer Bottom.

What It Signals: The market attempted to push through a resistance level twice and was rejected on both occasions. Buyers could not sustain price above that level across two consecutive attempts. This double failure is more convincing evidence of resistance strength than a single failed breakout.

Entry Trigger: Enter short at the open of the candle following the second (bearish) candle. Confirm the matching highs align with a recognized resistance level or a prior tested swing high.

Stop Loss: Place the stop above the matching highs with a small buffer. A break above the double high means the resistance has been absorbed and the pattern logic has been invalidated.

One rejection could be noise. The same level holding or failing twice in a row is a much harder thing to fake.

11. Bullish Harami

What It Looks Like: A large bearish candle followed by a small bullish candle whose entire body sits within the range of the prior bearish candle's body. The name translates to "pregnant" in Japanese, describing the visual of a small candle nested inside the larger one.

What It Signals: After a strong bearish move, momentum is slowing. The small bullish candle shows sellers can no longer produce a large bearish close. This signals hesitation rather than a completed reversal. Buyers have not overpowered sellers yet. They have simply stalled them. This is why the Harami ranks lower than engulfing patterns and requires careful confirmation before entry.

Entry Trigger: Enter long on a breakout above the high of the small inner candle. That breakout confirms buyers are taking initiative rather than just pausing the sell-off. Entering before the breakout is premature and increases the risk of a failed setup.

Stop Loss: Place the stop below the low of the inner (small bullish) candle. Using the low of the large bearish candle produces a stop that is too wide for the risk-reward to make sense on most setups.

12. Doji

What It Looks Like: A candle where the open and close are at the same or nearly the same price, producing a very small or invisible body. Wicks can extend in either direction. Common variations include the standard Doji with balanced wicks, the Gravestone Doji with a long upper wick and no lower wick, and the Dragonfly Doji with a long lower wick and no upper wick.

What It Signals: Complete indecision. Neither buyers nor sellers won the session. Taken alone, a Doji provides no directional edge. Its value comes entirely from context. A Gravestone Doji at a tested resistance level after a prolonged uptrend signals potential bearish reversal. The same candle in the middle of a ranging market signals nothing actionable.

Entry Trigger: Never enter a trade based on a Doji alone. Wait for the following candle to close in the expected direction before committing. A Gravestone Doji at resistance followed by a bearish candle close is a valid short entry. A Dragonfly Doji at support followed by a bullish candle close is a valid long entry.

Stop Loss: Place the stop beyond the extreme wick of the Doji. For a Gravestone Doji short, the stop goes above the top of the upper wick. For a Dragonfly Doji long, the stop goes below the tip of the lower wick.

How to Build a High-Probability Candlestick Trade

A candlestick pattern tells you what buyers and sellers did during a specific period of time. What it cannot tell you on its own is whether the environment supports a sustained move in that direction. Trading any pattern in isolation, without supporting context, drops the probability profile significantly.

Treat candlestick patterns as the final confirmation in a structured process, not the first reason to enter. Bias comes from the higher timeframe. The level comes from market structure analysis. The candlestick pattern is the trigger that initiates the trade. Every high-probability setup runs through those three steps in that order, which is why this approach produces high-probability setups rather than random pattern chasing.

Bollinger Bands are a practical volatility tool for gauging whether the current market environment supports a candlestick-based entry or signals conditions that are too erratic to trade.

The Three-Layer Confluence Framework

Use these three layers to assess whether any candlestick pattern is genuinely worth trading.

Here is how each layer filters setups:

  • Key level alignment: The pattern must form at a recognized structural level such as a prior swing high or low, a tested support or resistance zone, a significant round number like 1.2000 on EURUSD or 150.00 on USDJPY, or a major moving average confluence. A bearish engulfing at a clean Daily resistance level with multiple prior touches is a fundamentally different trade from the same pattern appearing at a random mid-range location.
  • Higher-timeframe trend direction: Trading reversal patterns in the direction of the higher-timeframe trend produces consistently better results than counter-trend trades. A bullish hammer on H4 is far more reliable when the Daily chart shows a clear uptrend with higher highs and higher lows. That hammer represents a pullback within an established trend that has found support, which is a structurally sound scenario.
  • Volatility and event context: Patterns forming just before major economic events such as Non-Farm Payrolls, Federal Reserve decisions, or CPI releases carry unreliable signals. The data release can completely override any technical signal. Wait for the event to print, then re-assess the pattern in the post-data environment.

Candle Close Discipline

One rule applies to all 12 patterns: enter on the confirmed close of the signal candle or the open of the following candle, never mid-candle. A pattern is only valid when the candle has fully closed. A candle that looks like a strong bullish engulfing at 95% completion might close as a small-bodied candle with a large upper wick if sellers push back in the final moments of the period.

Waiting for the close costs a few pips on the entry price. It prevents entering patterns that fail to complete. That is a far more expensive error than a slightly worse fill.

Four Mistakes That Destroy Candlestick Trading Results

Understanding the patterns is the first half of the equation. Avoiding the systematic errors most traders make around them determines whether the patterns produce consistent results over time.

Here are the four most common mistakes that destroy candlestick trading performance:

  • Trading patterns without a key level: A bullish engulfing without structural context is a directional guess, not a trade. Every pattern in the ranking above performs substantially better when it forms at a recognized price level. Without a key level, the pattern is a shape without a reason.
  • Using low timeframes as the primary signal: Patterns on M5, M15, and M30 are heavily influenced by session transitions, liquidity sweeps, and news spikes. They are useful for refining an entry already justified on H4 or Daily analysis. Building a complete strategy around low-timeframe patterns alone leads to overtrading and unpredictable results.
  • Accepting ambiguous patterns: The best setups are immediately obvious. If justification is needed for why a candle qualifies as an engulfing pattern, it probably does not qualify. Clean patterns at clean levels are the only ones worth putting capital behind.
  • Skipping the validation process: EURUSD behaves very differently from GBPJPY. The reliability of any specific pattern on any specific pair depends on historical data for that pair, not general rules from a textbook. Run at least 100 historical examples of each pattern on each pair before trusting it in live markets.

A proper back testing process is how traders validate which candlestick indicators actually perform on their specific pairs and timeframes.

Also Read: How to Read Forex Charts Before You Lose Another Trade

Conclusion

Candlestick indicators are not a trading strategy on their own. They are a language for reading what buyers and sellers did during a specific window of market activity. Learning to read that language with precision, placing every pattern in its proper context, and acting only when the broader market environment confirms the signal separates traders who compound consistently from those who chase shapes and wonder why identical setups sometimes work and sometimes fail.

Reliable candlestick traders are not the ones who know the most patterns. They are the ones who understand the market narrative behind each pattern, trade only at levels where the logic holds, and enter with a defined stop and a clear invalidation point. That discipline is what makes candlestick indicators ruthlessly effective instead of just interesting shapes on a chart.

Frequently Asked Questions

What Are the Most Reliable Candlestick Indicators for Forex Trading?

The most reliable candlestick indicators in forex are the Bullish and Bearish Engulfing patterns, the Hammer and Shooting Star (also called Pin Bars), and the Morning and Evening Star three-candle reversals. These patterns rank highest because they show a decisive and measurable shift in buyer or seller control. Reliability increases significantly when the pattern forms at a tested key level on the H4 or Daily timeframe during the London or New York trading session.

Why Do Candlestick Patterns Perform Differently in Forex Than in Stocks?

In stocks, candlestick patterns can be confirmed with centralized exchange volume data that reflects genuine institutional participation. In forex, there is no single exchange and no consolidated volume feed, so patterns must be confirmed through price structure and context rather than volume. The 24-hour forex market also creates session-based liquidity shifts that cause identical patterns to carry very different weight depending on when they form. Patterns during the London and New York sessions reflect real institutional activity, while patterns in the quiet Asian session hours on major pairs are often low-reliability noise.

What Is the Correct Stop Loss Placement for Candlestick Patterns?

Stop loss placement should be based on the structural extreme that would invalidate each pattern's logic, not on a fixed pip amount or account percentage. Engulfing patterns need the stop placed beyond the extreme of the engulfing candle. Pin Bars call for the stop beyond the tip of the wick. Three-candle reversals like Morning and Evening Stars need the stop beyond the low or high of the middle indecision candle. Placing stops based on arbitrary distances rather than pattern structure is one of the most common and costly errors in candlestick trading.

How Many Confirmation Factors Are Needed Before Entering a Candlestick Trade?

Look for at least two confirming factors beyond the pattern itself before entering. The pattern must form at a key structural level such as a tested support or resistance zone, and it must align with the direction of the higher-timeframe trend. Adding a third factor, such as high-liquidity session timing or the absence of a nearby major economic event, further improves the probability profile. Trading a candlestick pattern in complete isolation treats the shape as the signal rather than the environment around it.

What Timeframe Works Best for Candlestick Indicators in Forex?

The H4 and Daily timeframes produce the most reliable candlestick signals in forex. These timeframes filter out the session-based noise that creates false signals on M5, M15, and M30 charts. Lower timeframes are useful for refining an entry after the setup has been identified on H4 or Daily, but they should not serve as the primary basis for the trade decision. The Daily timeframe is particularly reliable for three-candle patterns like Morning Star, Evening Star, Three White Soldiers, and Three Black Crows.
ezekiel chew asiaforexmentor

About Ezekiel Chew

Ezekiel Chew, founder and head of training at Asia Forex Mentor, is a renowned forex expert, frequently invited to speak at major industry events. Known for his deep market insights, Ezekiel is one of the top traders committed to supporting the trading community. Making six figures per trade, he also trains traders working in banks, fund management, and prop trading firms.

RELATED ARTICLES

Join the Live Event
Get Your Free Ticket Now

I consent to receiving emails and/or text message reminders for this event.

REGISTER FOR THE MASTERCLASS!