Learn To Trade Forex • Best Forex Trading Course • AsiaForexMentor

How To Trade Triangle Chart Patterns Without Getting Burned

Written by

Ezekiel Chew

Updated on

August 7, 2026

i
Its a default text

How To Trade Triangle Chart Patterns Without Getting Burned

Written by:

Last updated on:

August 7, 2026
Most traders lose money on a triangle chart pattern the same way. They watch price coil into a point, wait for the break, and enter the moment price pops through the line. Then the market reverses and stops them out instantly. It happens so consistently that traders give up on the pattern entirely, when the pattern was never the problem.
The entry was.

ABOUT THIS GUIDE

This article covers all three types of triangle chart patterns and how to identify each one, why triangle breakouts fail so often and the false breakout trap most guides skip entirely, how to apply multi-timeframe confirmation before taking the break, where to place your entry trigger and stop loss, and how to calculate the correct price target. 


QUICK ANSWER

A triangle chart pattern forms when price compresses into converging highs and lows, building toward a breakout. Three types exist: the ascending triangle (bullish bias), the descending triangle (bearish bias), and the symmetrical triangle (neutral, direction depends on prior trend). A valid breakout requires a candle close beyond the boundary on above-average volume, alignment with the higher timeframe trend, and correct entry placement. The target equals the triangle height projected from the breakout point.

What a Triangle Chart Pattern Actually Tells You

A triangle chart pattern represents compression. Price makes progressively tighter swings as buyers and sellers run out of room. Volume contracts through the pattern. Both sides are positioning for a decisive move that neither can delay much longer.
Understanding this compression is what separates traders who profit from these patterns from those who repeatedly get stopped out. The pattern is not just a shape on a chart. It reflects a genuine standoff between participants with real capital at stake. One side will eventually capitulate. Their stop orders become the fuel that powers the breakout.
Your job is to identify which side is more likely to lose. Confirm the breakout direction. Position before the cascade accelerates.
This is where price action trading gives you a structural edge that indicator-based systems cannot match. You read the compression in real time and understand the context. You act on what the market actually shows, not on what a lagging signal guesses.

The Three Triangle Chart Pattern Types

Every triangle chart pattern falls into one of three structures. Each has a different logic, a different directional bias, and a different set of trading rules, and knowing which type you're looking at changes your approach before the breakout even forms.

Here is what separates each type:

  • Ascending triangle pattern: flat resistance at the top, rising support at the bottom, bullish bias
  • Descending triangle pattern: flat support at the bottom, falling resistance at the top, bearish bias
  • Symmetrical triangle pattern: converging trendlines with no flat side, directional bias depends on prior trend
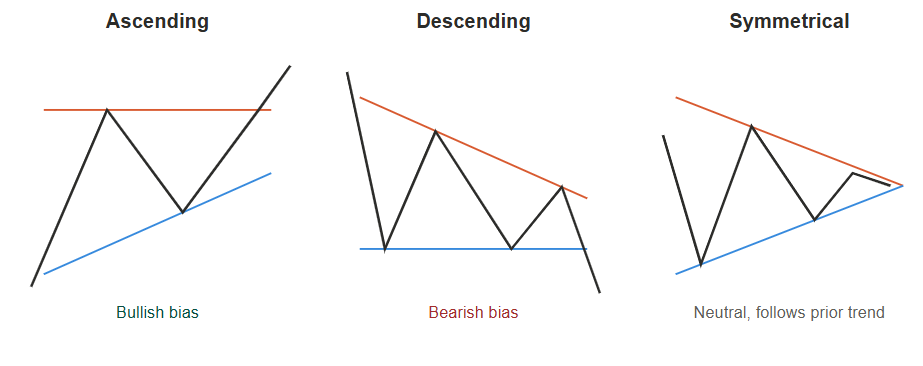
Same compression logic, three different shapes, three different biases.

Ascending Triangle Pattern

The ascending triangle pattern forms when buyers repeatedly push price up to a fixed resistance level while each pullback is shallower than the last. Every new low is higher than the previous one. Sellers defend the same ceiling, but buyers show up earlier on every dip.

That structural shift tells a clear story. Buyers are gaining strength relative to sellers inside the pattern, and when the resistance finally breaks, the ones who positioned at every higher low have no reason to hold back. The breakout tends to be decisive.

To identify a valid ascending triangle pattern, you need at least two clear touches on the flat resistance and at least two rising lows connecting to an upward trendline. One touch on either side is not enough to confirm the pattern. Repetition is what creates reliability.
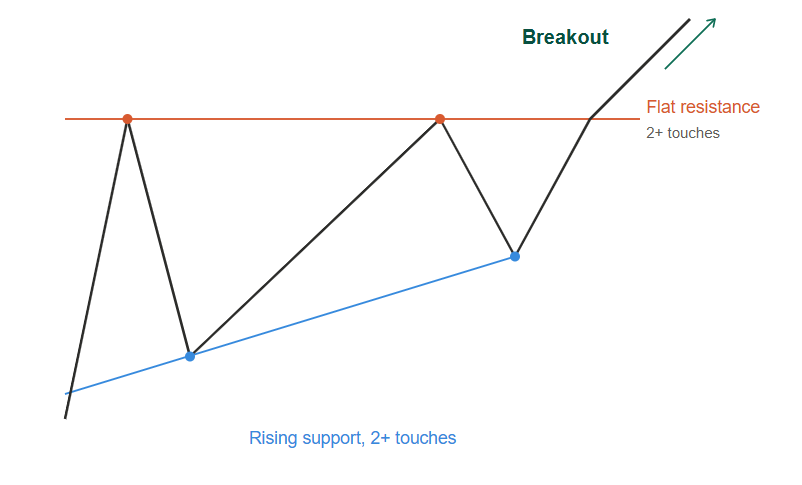
Two touches minimum on each line, then a decisive break once buyers stop giving sellers room.

The ascending triangle is most reliable as a continuation pattern in an established uptrend, with the default bias pointing to a breakout on the upside.

Descending Triangle Pattern

The descending triangle pattern is the mirror of the ascending. Sellers push price down to a flat support level repeatedly while each bounce is weaker than the last. Every high is lower than the previous one. Buyers defend the same floor, but sellers dominate every rally.
The story here is bearish. When flat support finally breaks, trapped buyers stop out simultaneously. Their orders fuel the move lower. The break tends to be sharp and fast.
Identify the descending triangle with the same minimum criteria: at least two touches on the flat support and at least two falling highs forming a descending upper trendline. More touches on either side increase the pattern's reliability. This type is most effective as a bearish continuation pattern in a downtrend.

Symmetrical Triangle Pattern

The symmetrical triangle pattern has no flat side. Price makes lower highs and higher lows simultaneously as both trendlines converge toward an apex. Neither buyers nor sellers are winning. Volatility contracts hard.
This type has no structural directional bias. The breakout can go either way. Your bias must come from the broader trend context. A symmetrical triangle forming during a sustained uptrend has an upside bias. One forming after a sharp selloff has a downside bias.
The symmetrical triangle is the most prone to false breakouts of all three types. Neither side dominates going into the compression. The eventual break is more likely to spike through the boundary and reverse before real momentum develops. Handle this pattern with more caution than the other two.

Why Triangle Pattern Breakouts Fail So Often

The breakout looks clean. Price closes above the trendline. You enter. The market immediately reverses, pushes back inside the triangle, and stops you out. Many traders assume they read the pattern incorrectly. In most cases, they read it correctly but entered without understanding what drives false breakouts.
Large participants know where retail orders cluster. Retail stop orders and breakout entries concentrate at the most obvious levels in any triangle. Above the flat resistance and below the flat support are the most predictable spots on any chart. A push through either level triggers those orders and creates a brief surge of activity. When that fuel is exhausted, price reverses.

The False Breakout Trap Most Guides Skip

Four specific conditions make a false breakout significantly more likely. Check all four before entering any triangle pattern breakout:

  • Low volume on the break: a genuine breakout needs a clear expansion in volume relative to the bars inside the triangle. A break on thin volume has no institutional backing and frequently reverses within one or two candles.
  • Breakout occurs near the apex: the closer price gets to the apex before breaking out, the less reliable the move. The ideal breakout happens between 50% and 75% of the way from the base to the apex, not right at the tip where the two trendlines nearly converge.
  • Break during a low-liquidity session: noise moves during thin market hours carry no institutional weight. The London and New York sessions are where breakouts have the most follow-through potential.
  • No prior trend to continue: a triangle that forms after prolonged sideways chop has no directional momentum to extend. Without a trend behind the pattern, the breakout has no fuel source.
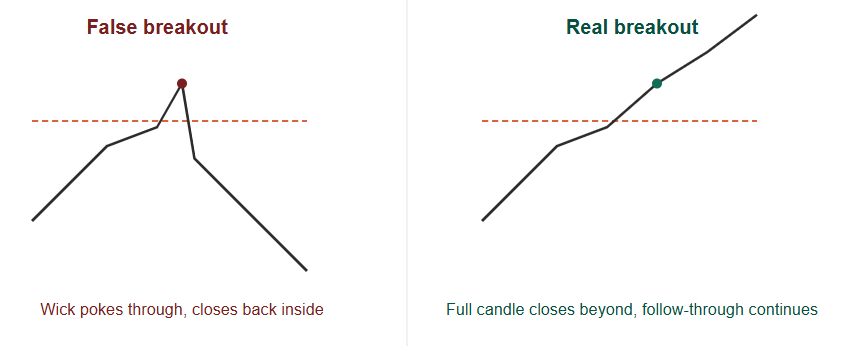
The wick that pokes through and snaps back is the pattern behind most triangle losses.

When one of these conditions shows up, the odds of a false breakout climb meaningfully. Two or more, and the setup doesn't meet the standard for a high-probability trade. I wait for the next one.

Multi-Timeframe Confirmation Before Taking the Break

Trading a triangle chart pattern on a single timeframe is one of the most reliable ways to take consistent losses. A clean-looking ascending triangle on the 1-hour chart is a trap if the 4-hour chart is in a clear downtrend. The higher timeframe always governs the trade direction.
Here is the four-step confirmation process for every triangle breakout:
Step 1: Establish the higher timeframe trend.
Open the 4-hour or daily chart and identify the dominant direction. Is price in a clear uptrend, downtrend, or extended sideways range? A triangle breakout on the lower timeframe only qualifies if it aligns with the dominant higher timeframe trend.
Step 2: Find the triangle on your trading timeframe.
Drop to your preferred chart and locate the triangle. An ascending triangle inside a higher timeframe uptrend is a valid long setup. An ascending triangle inside a higher timeframe downtrend is a false breakout waiting to happen. Trend alignment is not optional.
Step 3: Check for nearby higher timeframe key levels.
Identify the nearest major support or resistance zone on the higher timeframe chart. A triangle approaching a strong higher timeframe resistance from below has a high probability of producing a false upside break. The level acts as a ceiling the breakout cannot clear cleanly.
Step 4: Wait for a confirmed candle close beyond the boundary.
Never enter while the breakout candle is still open. A wick that pokes through the trendline and closes back inside is a rejection, not a breakout. The full candle body must close convincingly beyond the trendline before you act.
This four-step check takes two minutes before any trade. It eliminates a large share of the false breakouts that cost retail traders money every session.

How To Trade Triangle Patterns With Precision

Once the confirmation process is satisfied and a valid breakout candle has closed, you have two entry options. Each has a different risk profile. Choosing between them depends on the strength of the overall setup and how much confirmation you need before committing capital.

Here is how the two approaches compare:

Entry Method Timing Risk Level Best Conditions
Immediate breakout entry At close of breakout candle Higher Strong trend, clear volume expansion, full higher timeframe alignment
Retest entry On pullback to broken trendline Lower All conditions, especially when false breakout risk is elevated

The Entry Trigger

For the immediate entry, enter at the close of the first candle that closes convincingly beyond the triangle boundary. Convincing means the candle body is beyond the trendline, not just the wick. A small-bodied candle that barely crosses the line is not a signal. Wait for the next candle or look for the retest.
For the retest entry, let the initial breakout happen and hold off on entering. Price frequently pulls back to test the broken trendline shortly after the initial surge. An upside breakout will pull back to test the former resistance as new support. A downside break will pull back to test the former support as new resistance. Enter on the first candle that shows clear rejection at that retested level.

Stop Loss Placement

Place the stop loss  inside the triangle, beyond the most recent swing point before the breakout. Never place the stop at the apex. The apex is the narrowest point of the pattern, and normal market volatility will frequently spike through it without actually invalidating the trade setup.
For an ascending triangle long, the stop goes below the last higher low that formed inside the triangle. A descending triangle short puts the stop above the last lower high inside the pattern. On a symmetrical triangle, the stop goes just beyond the opposite trendline at the price level of your entry.
The retest entry naturally tightens the stop. You enter on the bounce from the retested trendline, and your stop goes just below the bounce candle low (for a long trade) or above the bounce candle high (for a short trade). This placement is typically much tighter than the swing point inside the triangle.
Our One Core Programme covers stop placement mechanics for every major chart pattern in full detail, including how to size positions correctly relative to where the stop sits.

How To Calculate the Triangle Pattern Target

The measured move method applies to all three triangle types, and it's objective and consistent. The process has three steps:

  1. Measure the triangle height. Locate the widest point of the pattern, always on the left side at the base. Measure the vertical distance from the highest point to the lowest point at that base. Record this value in pips.
  2. Identify the exact breakout point. This is the price level where the breakout candle fully closed beyond the trendline boundary.
  3. Project the height from the breakout point. For an upside break, add the height to the breakout price. For a downside break, subtract the height from the breakout price.

Here is a worked example with EUR/USD:

  • Ascending triangle resistance holds at 1.0800, rising support starts at 1.0720 at the base
  • Triangle height at the base: 80 pips (1.0800 minus 1.0720)
  • Breakout candle closes at 1.0812
  • Measured move target: 1.0812 plus 80 pips = 1.0892

I take partial profit at 50% of the measured move, which in this example is 40 pips above the breakout at 1.0852. At that point, the stop moves to breakeven. This locks in a guaranteed gain and removes all downside risk while the trade keeps running toward the full target.

One essential check before entering: scan for any major support or resistance zone between your entry and your target. If a significant higher timeframe level sits at 60% of the measured move, that level may cap the move, so take full profit there instead of holding for the complete measured distance.

Also Read: How To Build a High-Probability Forex Trading System

Conclusion

The triangle chart pattern is one of the most reliable setups in technical analysis when traded with the right framework. Most traders fail on these patterns not because the pattern is flawed, but because they enter too early, skip the multi-timeframe filter, and ignore the four conditions that signal a false breakout.
Apply the four-step confirmation process before every breakout trade. Use the retest entry when conditions are not clearly in your favor. Calculate the measured move target before you enter so you know the reward before you risk a single pip.
The traders who compound accounts consistently treat every pattern as a repeatable process. Triangle patterns give you exactly that: clean structure, clear invalidation, and a measurable target.

Frequently Asked Questions

What are the three types of triangle chart patterns?

The three types of triangle chart patterns are the ascending triangle, the descending triangle, and the symmetrical triangle. The ascending triangle has a flat resistance level at the top and rising lows, indicating that buyers are gaining strength relative to sellers. The descending triangle has a flat support level at the bottom and falling highs, indicating seller dominance. The symmetrical triangle has converging trendlines with no flat side and a neutral structural bias that depends on the prior trend context.

How do you confirm a triangle pattern breakout?

Triangle pattern confirmation requires a full candle close beyond the trendline boundary on above-average volume. The breakout must also align with the dominant trend on the higher timeframe chart. Many experienced traders additionally wait for the broken trendline to be retested and hold as new support or resistance before entering, which provides stronger confirmation and reduces exposure to false breakouts.

What causes false breakouts in triangle patterns?

False breakouts occur when price briefly crosses the triangle boundary and then reverses back inside. The four main causes are a break on low volume with no institutional backing, a breakout that occurs too close to the apex of the triangle, a break during a low-liquidity trading session, and the absence of a prior trend to sustain the momentum. Large participants deliberately target the most obvious breakout levels to trigger retail orders before reversing direction.

How do you calculate the target for a triangle pattern?

The triangle pattern target uses the measured move method. Measure the height of the triangle at its widest point on the left side, the base. Project that exact distance from the breakout price in the direction of the break. For a triangle with an 80-pip base that breaks out at 1.0812, the upside target is 1.0892. Always check for major support or resistance levels between your entry and the calculated target, as they may cap the move before the full measured distance is reached.

Is the symmetrical triangle bullish or bearish?

A symmetrical triangle is directionally neutral on its own. The bias comes from the surrounding market context. A symmetrical triangle forming during a sustained uptrend leans bullish and is more likely to break to the upside. One forming after a sharp decline leans bearish. The symmetrical triangle also carries the highest false breakout rate of the three types because neither buyers nor sellers are clearly dominant going into the compression phase.


About Ezekiel Chew​

Ezekiel Chew, founder and head of training at Asia Forex Mentor, is a renowned forex expert, frequently invited to speak at major industry events. Known for his deep market insights, Ezekiel is one of the top traders committed to supporting the trading community. Making six figures per trade, he also trains traders working in banks, fund management, and prop trading firms.

Average True Range Most Traders Use It Wrong

Most traders treat the average true range as a background indicator and use it the same way beginners do: glance at the number and guess at a stop loss. ABOUT THIS GUIDE This guide covers how professional forex traders actually apply the average true range. It goes from ATR stop

Read More

8 Best Day Trading Books That Actually Works

The best day trading books on most recommended lists were written for markets that no longer exist the way they once did. Traders buy the top-rated titles, work through them, and find that the strategies fail in a live account. The problem is rarely the trader. Most lists recommend books

Read More

Position Size Calculator Every Forex Trader Needs

Most traders lose their accounts not because of a bad entry call but because they put too much on the line. The position size calculator is what stops that from happening before an order is ever placed. ABOUT THIS GUIDE This guide covers what a position size calculator actually does,

Read More

How to Draw Trend Lines in Trading the Right Way 2026

Most traders drawing trend lines in trading are connecting random price points and calling it technical analysis, which is why their supposed support turns into thin air the moment price actually touches it. ABOUT THIS GUIDE This guide covers the institutional method for drawing valid trend lines in forex. It

Read More

Head and Shoulders Pattern Forex Guide 2026

Recognizing the head and shoulders pattern and trading it correctly are two entirely different skills. Most forex traders who spot the formation still end up stopped out before the move begins. The pattern appears in virtually every technical analysis curriculum and across all forex pairs and timeframes, yet the entry

Read More

Traders Dynamic Index 2026 Complete Forex Guide

Most traders carry three separate indicators on their chart to do what the Traders Dynamic Index accomplishes in a single window. The TDI combines a 13-period RSI, two signal line moving averages, and a 34-period Bollinger Band applied directly to the RSI oscillator. The result is one panel that shows

Read More

AFM Trading Summit Live

Date: Coming Soon

Join us at the AFM Trading Summit Live and learn from top industry experts through live trading sessions, market insights, and actionable strategies.

How To Trade Triangle Chart Patterns Without Getting Burned

4.0
Overall Trust Index

Written by:

Updated:

August 7, 2026
Most traders lose money on a triangle chart pattern the same way. They watch price coil into a point, wait for the break, and enter the moment price pops through the line. Then the market reverses and stops them out instantly. It happens so consistently that traders give up on the pattern entirely, when the pattern was never the problem.
The entry was.

ABOUT THIS GUIDE

This article covers all three types of triangle chart patterns and how to identify each one, why triangle breakouts fail so often and the false breakout trap most guides skip entirely, how to apply multi-timeframe confirmation before taking the break, where to place your entry trigger and stop loss, and how to calculate the correct price target. 
 

QUICK ANSWER

A triangle chart pattern forms when price compresses into converging highs and lows, building toward a breakout. Three types exist: the ascending triangle (bullish bias), the descending triangle (bearish bias), and the symmetrical triangle (neutral, direction depends on prior trend). A valid breakout requires a candle close beyond the boundary on above-average volume, alignment with the higher timeframe trend, and correct entry placement. The target equals the triangle height projected from the breakout point.

What a Triangle Chart Pattern Actually Tells You

A triangle chart pattern represents compression. Price makes progressively tighter swings as buyers and sellers run out of room. Volume contracts through the pattern. Both sides are positioning for a decisive move that neither can delay much longer.
Understanding this compression is what separates traders who profit from these patterns from those who repeatedly get stopped out. The pattern is not just a shape on a chart. It reflects a genuine standoff between participants with real capital at stake. One side will eventually capitulate. Their stop orders become the fuel that powers the breakout.
Your job is to identify which side is more likely to lose. Confirm the breakout direction. Position before the cascade accelerates.
This is where price action trading gives you a structural edge that indicator-based systems cannot match. You read the compression in real time and understand the context. You act on what the market actually shows, not on what a lagging signal guesses.

The Three Triangle Chart Pattern Types

Every triangle chart pattern falls into one of three structures. Each has a different logic, a different directional bias, and a different set of trading rules, and knowing which type you're looking at changes your approach before the breakout even forms.

Here is what separates each type:

  • Ascending triangle pattern: flat resistance at the top, rising support at the bottom, bullish bias
  • Descending triangle pattern: flat support at the bottom, falling resistance at the top, bearish bias
  • Symmetrical triangle pattern: converging trendlines with no flat side, directional bias depends on prior trend

Same compression logic, three different shapes, three different biases.

Ascending Triangle Pattern

The ascending triangle pattern forms when buyers repeatedly push price up to a fixed resistance level while each pullback is shallower than the last. Every new low is higher than the previous one. Sellers defend the same ceiling, but buyers show up earlier on every dip.

That structural shift tells a clear story. Buyers are gaining strength relative to sellers inside the pattern, and when the resistance finally breaks, the ones who positioned at every higher low have no reason to hold back. The breakout tends to be decisive.

To identify a valid ascending triangle pattern, you need at least two clear touches on the flat resistance and at least two rising lows connecting to an upward trendline. One touch on either side is not enough to confirm the pattern. Repetition is what creates reliability.

Two touches minimum on each line, then a decisive break once buyers stop giving sellers room.

The ascending triangle is most reliable as a continuation pattern in an established uptrend, with the default bias pointing to a breakout on the upside.

Descending Triangle Pattern

The descending triangle pattern is the mirror of the ascending. Sellers push price down to a flat support level repeatedly while each bounce is weaker than the last. Every high is lower than the previous one. Buyers defend the same floor, but sellers dominate every rally.
The story here is bearish. When flat support finally breaks, trapped buyers stop out simultaneously. Their orders fuel the move lower. The break tends to be sharp and fast.
Identify the descending triangle with the same minimum criteria: at least two touches on the flat support and at least two falling highs forming a descending upper trendline. More touches on either side increase the pattern's reliability. This type is most effective as a bearish continuation pattern in a downtrend.

Symmetrical Triangle Pattern

The symmetrical triangle pattern has no flat side. Price makes lower highs and higher lows simultaneously as both trendlines converge toward an apex. Neither buyers nor sellers are winning. Volatility contracts hard.
This type has no structural directional bias. The breakout can go either way. Your bias must come from the broader trend context. A symmetrical triangle forming during a sustained uptrend has an upside bias. One forming after a sharp selloff has a downside bias.
The symmetrical triangle is the most prone to false breakouts of all three types. Neither side dominates going into the compression. The eventual break is more likely to spike through the boundary and reverse before real momentum develops. Handle this pattern with more caution than the other two.

Why Triangle Pattern Breakouts Fail So Often

The breakout looks clean. Price closes above the trendline. You enter. The market immediately reverses, pushes back inside the triangle, and stops you out. Many traders assume they read the pattern incorrectly. In most cases, they read it correctly but entered without understanding what drives false breakouts.
Large participants know where retail orders cluster. Retail stop orders and breakout entries concentrate at the most obvious levels in any triangle. Above the flat resistance and below the flat support are the most predictable spots on any chart. A push through either level triggers those orders and creates a brief surge of activity. When that fuel is exhausted, price reverses.

The False Breakout Trap Most Guides Skip

Four specific conditions make a false breakout significantly more likely. Check all four before entering any triangle pattern breakout:

  • Low volume on the break: a genuine breakout needs a clear expansion in volume relative to the bars inside the triangle. A break on thin volume has no institutional backing and frequently reverses within one or two candles.
  • Breakout occurs near the apex: the closer price gets to the apex before breaking out, the less reliable the move. The ideal breakout happens between 50% and 75% of the way from the base to the apex, not right at the tip where the two trendlines nearly converge.
  • Break during a low-liquidity session: noise moves during thin market hours carry no institutional weight. The London and New York sessions are where breakouts have the most follow-through potential.
  • No prior trend to continue: a triangle that forms after prolonged sideways chop has no directional momentum to extend. Without a trend behind the pattern, the breakout has no fuel source.

The wick that pokes through and snaps back is the pattern behind most triangle losses.

When one of these conditions shows up, the odds of a false breakout climb meaningfully. Two or more, and the setup doesn't meet the standard for a high-probability trade. I wait for the next one.

Multi-Timeframe Confirmation Before Taking the Break

Trading a triangle chart pattern on a single timeframe is one of the most reliable ways to take consistent losses. A clean-looking ascending triangle on the 1-hour chart is a trap if the 4-hour chart is in a clear downtrend. The higher timeframe always governs the trade direction.
Here is the four-step confirmation process for every triangle breakout:
Step 1: Establish the higher timeframe trend.
Open the 4-hour or daily chart and identify the dominant direction. Is price in a clear uptrend, downtrend, or extended sideways range? A triangle breakout on the lower timeframe only qualifies if it aligns with the dominant higher timeframe trend.
Step 2: Find the triangle on your trading timeframe.
Drop to your preferred chart and locate the triangle. An ascending triangle inside a higher timeframe uptrend is a valid long setup. An ascending triangle inside a higher timeframe downtrend is a false breakout waiting to happen. Trend alignment is not optional.
Step 3: Check for nearby higher timeframe key levels.
Identify the nearest major support or resistance zone on the higher timeframe chart. A triangle approaching a strong higher timeframe resistance from below has a high probability of producing a false upside break. The level acts as a ceiling the breakout cannot clear cleanly.
Step 4: Wait for a confirmed candle close beyond the boundary.
Never enter while the breakout candle is still open. A wick that pokes through the trendline and closes back inside is a rejection, not a breakout. The full candle body must close convincingly beyond the trendline before you act.
This four-step check takes two minutes before any trade. It eliminates a large share of the false breakouts that cost retail traders money every session.

How To Trade Triangle Patterns With Precision

Once the confirmation process is satisfied and a valid breakout candle has closed, you have two entry options. Each has a different risk profile. Choosing between them depends on the strength of the overall setup and how much confirmation you need before committing capital.

Here is how the two approaches compare:

Entry Method Timing Risk Level Best Conditions
Immediate breakout entry At close of breakout candle Higher Strong trend, clear volume expansion, full higher timeframe alignment
Retest entry On pullback to broken trendline Lower All conditions, especially when false breakout risk is elevated

The Entry Trigger

For the immediate entry, enter at the close of the first candle that closes convincingly beyond the triangle boundary. Convincing means the candle body is beyond the trendline, not just the wick. A small-bodied candle that barely crosses the line is not a signal. Wait for the next candle or look for the retest.
For the retest entry, let the initial breakout happen and hold off on entering. Price frequently pulls back to test the broken trendline shortly after the initial surge. An upside breakout will pull back to test the former resistance as new support. A downside break will pull back to test the former support as new resistance. Enter on the first candle that shows clear rejection at that retested level.

Stop Loss Placement

Place the stop loss inside the triangle, beyond the most recent swing point before the breakout. Never place the stop at the apex. The apex is the narrowest point of the pattern, and normal market volatility will frequently spike through it without actually invalidating the trade setup.
For an ascending triangle long, the stop goes below the last higher low that formed inside the triangle. A descending triangle short puts the stop above the last lower high inside the pattern. On a symmetrical triangle, the stop goes just beyond the opposite trendline at the price level of your entry.
The retest entry naturally tightens the stop. You enter on the bounce from the retested trendline, and your stop goes just below the bounce candle low (for a long trade) or above the bounce candle high (for a short trade). This placement is typically much tighter than the swing point inside the triangle.
Our One Core Programme covers stop placement mechanics for every major chart pattern in full detail, including how to size positions correctly relative to where the stop sits.

How To Calculate the Triangle Pattern Target

The measured move method applies to all three triangle types, and it's objective and consistent. The process has three steps:

  1. Measure the triangle height. Locate the widest point of the pattern, always on the left side at the base. Measure the vertical distance from the highest point to the lowest point at that base. Record this value in pips.
  2. Identify the exact breakout point. This is the price level where the breakout candle fully closed beyond the trendline boundary.
  3. Project the height from the breakout point. For an upside break, add the height to the breakout price. For a downside break, subtract the height from the breakout price.

Here is a worked example with EUR/USD:

  • Ascending triangle resistance holds at 1.0800, rising support starts at 1.0720 at the base
  • Triangle height at the base: 80 pips (1.0800 minus 1.0720)
  • Breakout candle closes at 1.0812
  • Measured move target: 1.0812 plus 80 pips = 1.0892

I take partial profit at 50% of the measured move, which in this example is 40 pips above the breakout at 1.0852. At that point, the stop moves to breakeven. This locks in a guaranteed gain and removes all downside risk while the trade keeps running toward the full target.

One essential check before entering: scan for any major support or resistance zone between your entry and your target. If a significant higher timeframe level sits at 60% of the measured move, that level may cap the move, so take full profit there instead of holding for the complete measured distance.

Also Read: How To Build a High-Probability Forex Trading System

Conclusion

The triangle chart pattern is one of the most reliable setups in technical analysis when traded with the right framework. Most traders fail on these patterns not because the pattern is flawed, but because they enter too early, skip the multi-timeframe filter, and ignore the four conditions that signal a false breakout.
Apply the four-step confirmation process before every breakout trade. Use the retest entry when conditions are not clearly in your favor. Calculate the measured move target before you enter so you know the reward before you risk a single pip.
The traders who compound accounts consistently treat every pattern as a repeatable process. Triangle patterns give you exactly that: clean structure, clear invalidation, and a measurable target.

Frequently Asked Questions

What are the three types of triangle chart patterns?

The three types of triangle chart patterns are the ascending triangle, the descending triangle, and the symmetrical triangle. The ascending triangle has a flat resistance level at the top and rising lows, indicating that buyers are gaining strength relative to sellers. The descending triangle has a flat support level at the bottom and falling highs, indicating seller dominance. The symmetrical triangle has converging trendlines with no flat side and a neutral structural bias that depends on the prior trend context.

How do you confirm a triangle pattern breakout?

Triangle pattern confirmation requires a full candle close beyond the trendline boundary on above-average volume. The breakout must also align with the dominant trend on the higher timeframe chart. Many experienced traders additionally wait for the broken trendline to be retested and hold as new support or resistance before entering, which provides stronger confirmation and reduces exposure to false breakouts.

What causes false breakouts in triangle patterns?

False breakouts occur when price briefly crosses the triangle boundary and then reverses back inside. The four main causes are a break on low volume with no institutional backing, a breakout that occurs too close to the apex of the triangle, a break during a low-liquidity trading session, and the absence of a prior trend to sustain the momentum. Large participants deliberately target the most obvious breakout levels to trigger retail orders before reversing direction.

How do you calculate the target for a triangle pattern?

The triangle pattern target uses the measured move method. Measure the height of the triangle at its widest point on the left side, the base. Project that exact distance from the breakout price in the direction of the break. For a triangle with an 80-pip base that breaks out at 1.0812, the upside target is 1.0892. Always check for major support or resistance levels between your entry and the calculated target, as they may cap the move before the full measured distance is reached.

Is the symmetrical triangle bullish or bearish?

A symmetrical triangle is directionally neutral on its own. The bias comes from the surrounding market context. A symmetrical triangle forming during a sustained uptrend leans bullish and is more likely to break to the upside. One forming after a sharp decline leans bearish. The symmetrical triangle also carries the highest false breakout rate of the three types because neither buyers nor sellers are clearly dominant going into the compression phase.

ezekiel chew asiaforexmentor

About Ezekiel Chew

Ezekiel Chew, founder and head of training at Asia Forex Mentor, is a renowned forex expert, frequently invited to speak at major industry events. Known for his deep market insights, Ezekiel is one of the top traders committed to supporting the trading community. Making six figures per trade, he also trains traders working in banks, fund management, and prop trading firms.

RELATED ARTICLES

How To Trade Triangle Chart Patterns Without Getting Burned

4.0
Overall Trust Index

Written by:

Updated:

August 7, 2026
Most traders lose money on a triangle chart pattern the same way. They watch price coil into a point, wait for the break, and enter the moment price pops through the line. Then the market reverses and stops them out instantly. It happens so consistently that traders give up on the pattern entirely, when the pattern was never the problem.
The entry was.

ABOUT THIS GUIDE

This article covers all three types of triangle chart patterns and how to identify each one, why triangle breakouts fail so often and the false breakout trap most guides skip entirely, how to apply multi-timeframe confirmation before taking the break, where to place your entry trigger and stop loss, and how to calculate the correct price target. 
 

QUICK ANSWER

A triangle chart pattern forms when price compresses into converging highs and lows, building toward a breakout. Three types exist: the ascending triangle (bullish bias), the descending triangle (bearish bias), and the symmetrical triangle (neutral, direction depends on prior trend). A valid breakout requires a candle close beyond the boundary on above-average volume, alignment with the higher timeframe trend, and correct entry placement. The target equals the triangle height projected from the breakout point.

What a Triangle Chart Pattern Actually Tells You

A triangle chart pattern represents compression. Price makes progressively tighter swings as buyers and sellers run out of room. Volume contracts through the pattern. Both sides are positioning for a decisive move that neither can delay much longer.
Understanding this compression is what separates traders who profit from these patterns from those who repeatedly get stopped out. The pattern is not just a shape on a chart. It reflects a genuine standoff between participants with real capital at stake. One side will eventually capitulate. Their stop orders become the fuel that powers the breakout.
Your job is to identify which side is more likely to lose. Confirm the breakout direction. Position before the cascade accelerates.
This is where price action trading gives you a structural edge that indicator-based systems cannot match. You read the compression in real time and understand the context. You act on what the market actually shows, not on what a lagging signal guesses.

The Three Triangle Chart Pattern Types

Every triangle chart pattern falls into one of three structures. Each has a different logic, a different directional bias, and a different set of trading rules, and knowing which type you're looking at changes your approach before the breakout even forms.

Here is what separates each type:

  • Ascending triangle pattern: flat resistance at the top, rising support at the bottom, bullish bias
  • Descending triangle pattern: flat support at the bottom, falling resistance at the top, bearish bias
  • Symmetrical triangle pattern: converging trendlines with no flat side, directional bias depends on prior trend

Same compression logic, three different shapes, three different biases.

Ascending Triangle Pattern

The ascending triangle pattern forms when buyers repeatedly push price up to a fixed resistance level while each pullback is shallower than the last. Every new low is higher than the previous one. Sellers defend the same ceiling, but buyers show up earlier on every dip.

That structural shift tells a clear story. Buyers are gaining strength relative to sellers inside the pattern, and when the resistance finally breaks, the ones who positioned at every higher low have no reason to hold back. The breakout tends to be decisive.

To identify a valid ascending triangle pattern, you need at least two clear touches on the flat resistance and at least two rising lows connecting to an upward trendline. One touch on either side is not enough to confirm the pattern. Repetition is what creates reliability.

Two touches minimum on each line, then a decisive break once buyers stop giving sellers room.

The ascending triangle is most reliable as a continuation pattern in an established uptrend, with the default bias pointing to a breakout on the upside.

Descending Triangle Pattern

The descending triangle pattern is the mirror of the ascending. Sellers push price down to a flat support level repeatedly while each bounce is weaker than the last. Every high is lower than the previous one. Buyers defend the same floor, but sellers dominate every rally.
The story here is bearish. When flat support finally breaks, trapped buyers stop out simultaneously. Their orders fuel the move lower. The break tends to be sharp and fast.
Identify the descending triangle with the same minimum criteria: at least two touches on the flat support and at least two falling highs forming a descending upper trendline. More touches on either side increase the pattern's reliability. This type is most effective as a bearish continuation pattern in a downtrend.

Symmetrical Triangle Pattern

The symmetrical triangle pattern has no flat side. Price makes lower highs and higher lows simultaneously as both trendlines converge toward an apex. Neither buyers nor sellers are winning. Volatility contracts hard.
This type has no structural directional bias. The breakout can go either way. Your bias must come from the broader trend context. A symmetrical triangle forming during a sustained uptrend has an upside bias. One forming after a sharp selloff has a downside bias.
The symmetrical triangle is the most prone to false breakouts of all three types. Neither side dominates going into the compression. The eventual break is more likely to spike through the boundary and reverse before real momentum develops. Handle this pattern with more caution than the other two.

Why Triangle Pattern Breakouts Fail So Often

The breakout looks clean. Price closes above the trendline. You enter. The market immediately reverses, pushes back inside the triangle, and stops you out. Many traders assume they read the pattern incorrectly. In most cases, they read it correctly but entered without understanding what drives false breakouts.
Large participants know where retail orders cluster. Retail stop orders and breakout entries concentrate at the most obvious levels in any triangle. Above the flat resistance and below the flat support are the most predictable spots on any chart. A push through either level triggers those orders and creates a brief surge of activity. When that fuel is exhausted, price reverses.

The False Breakout Trap Most Guides Skip

Four specific conditions make a false breakout significantly more likely. Check all four before entering any triangle pattern breakout:

  • Low volume on the break: a genuine breakout needs a clear expansion in volume relative to the bars inside the triangle. A break on thin volume has no institutional backing and frequently reverses within one or two candles.
  • Breakout occurs near the apex: the closer price gets to the apex before breaking out, the less reliable the move. The ideal breakout happens between 50% and 75% of the way from the base to the apex, not right at the tip where the two trendlines nearly converge.
  • Break during a low-liquidity session: noise moves during thin market hours carry no institutional weight. The London and New York sessions are where breakouts have the most follow-through potential.
  • No prior trend to continue: a triangle that forms after prolonged sideways chop has no directional momentum to extend. Without a trend behind the pattern, the breakout has no fuel source.

The wick that pokes through and snaps back is the pattern behind most triangle losses.

When one of these conditions shows up, the odds of a false breakout climb meaningfully. Two or more, and the setup doesn't meet the standard for a high-probability trade. I wait for the next one.

Multi-Timeframe Confirmation Before Taking the Break

Trading a triangle chart pattern on a single timeframe is one of the most reliable ways to take consistent losses. A clean-looking ascending triangle on the 1-hour chart is a trap if the 4-hour chart is in a clear downtrend. The higher timeframe always governs the trade direction.
Here is the four-step confirmation process for every triangle breakout:
Step 1: Establish the higher timeframe trend.
Open the 4-hour or daily chart and identify the dominant direction. Is price in a clear uptrend, downtrend, or extended sideways range? A triangle breakout on the lower timeframe only qualifies if it aligns with the dominant higher timeframe trend.
Step 2: Find the triangle on your trading timeframe.
Drop to your preferred chart and locate the triangle. An ascending triangle inside a higher timeframe uptrend is a valid long setup. An ascending triangle inside a higher timeframe downtrend is a false breakout waiting to happen. Trend alignment is not optional.
Step 3: Check for nearby higher timeframe key levels.
Identify the nearest major support or resistance zone on the higher timeframe chart. A triangle approaching a strong higher timeframe resistance from below has a high probability of producing a false upside break. The level acts as a ceiling the breakout cannot clear cleanly.
Step 4: Wait for a confirmed candle close beyond the boundary.
Never enter while the breakout candle is still open. A wick that pokes through the trendline and closes back inside is a rejection, not a breakout. The full candle body must close convincingly beyond the trendline before you act.
This four-step check takes two minutes before any trade. It eliminates a large share of the false breakouts that cost retail traders money every session.

How To Trade Triangle Patterns With Precision

Once the confirmation process is satisfied and a valid breakout candle has closed, you have two entry options. Each has a different risk profile. Choosing between them depends on the strength of the overall setup and how much confirmation you need before committing capital.

Here is how the two approaches compare:

Entry Method Timing Risk Level Best Conditions
Immediate breakout entry At close of breakout candle Higher Strong trend, clear volume expansion, full higher timeframe alignment
Retest entry On pullback to broken trendline Lower All conditions, especially when false breakout risk is elevated

The Entry Trigger

For the immediate entry, enter at the close of the first candle that closes convincingly beyond the triangle boundary. Convincing means the candle body is beyond the trendline, not just the wick. A small-bodied candle that barely crosses the line is not a signal. Wait for the next candle or look for the retest.
For the retest entry, let the initial breakout happen and hold off on entering. Price frequently pulls back to test the broken trendline shortly after the initial surge. An upside breakout will pull back to test the former resistance as new support. A downside break will pull back to test the former support as new resistance. Enter on the first candle that shows clear rejection at that retested level.

Stop Loss Placement

Place the stop loss inside the triangle, beyond the most recent swing point before the breakout. Never place the stop at the apex. The apex is the narrowest point of the pattern, and normal market volatility will frequently spike through it without actually invalidating the trade setup.
For an ascending triangle long, the stop goes below the last higher low that formed inside the triangle. A descending triangle short puts the stop above the last lower high inside the pattern. On a symmetrical triangle, the stop goes just beyond the opposite trendline at the price level of your entry.
The retest entry naturally tightens the stop. You enter on the bounce from the retested trendline, and your stop goes just below the bounce candle low (for a long trade) or above the bounce candle high (for a short trade). This placement is typically much tighter than the swing point inside the triangle.
Our One Core Programme covers stop placement mechanics for every major chart pattern in full detail, including how to size positions correctly relative to where the stop sits.

How To Calculate the Triangle Pattern Target

The measured move method applies to all three triangle types, and it's objective and consistent. The process has three steps:

  1. Measure the triangle height. Locate the widest point of the pattern, always on the left side at the base. Measure the vertical distance from the highest point to the lowest point at that base. Record this value in pips.
  2. Identify the exact breakout point. This is the price level where the breakout candle fully closed beyond the trendline boundary.
  3. Project the height from the breakout point. For an upside break, add the height to the breakout price. For a downside break, subtract the height from the breakout price.

Here is a worked example with EUR/USD:

  • Ascending triangle resistance holds at 1.0800, rising support starts at 1.0720 at the base
  • Triangle height at the base: 80 pips (1.0800 minus 1.0720)
  • Breakout candle closes at 1.0812
  • Measured move target: 1.0812 plus 80 pips = 1.0892

I take partial profit at 50% of the measured move, which in this example is 40 pips above the breakout at 1.0852. At that point, the stop moves to breakeven. This locks in a guaranteed gain and removes all downside risk while the trade keeps running toward the full target.

One essential check before entering: scan for any major support or resistance zone between your entry and your target. If a significant higher timeframe level sits at 60% of the measured move, that level may cap the move, so take full profit there instead of holding for the complete measured distance.

Also Read: How To Build a High-Probability Forex Trading System

Conclusion

The triangle chart pattern is one of the most reliable setups in technical analysis when traded with the right framework. Most traders fail on these patterns not because the pattern is flawed, but because they enter too early, skip the multi-timeframe filter, and ignore the four conditions that signal a false breakout.
Apply the four-step confirmation process before every breakout trade. Use the retest entry when conditions are not clearly in your favor. Calculate the measured move target before you enter so you know the reward before you risk a single pip.
The traders who compound accounts consistently treat every pattern as a repeatable process. Triangle patterns give you exactly that: clean structure, clear invalidation, and a measurable target.

Frequently Asked Questions

What are the three types of triangle chart patterns?

The three types of triangle chart patterns are the ascending triangle, the descending triangle, and the symmetrical triangle. The ascending triangle has a flat resistance level at the top and rising lows, indicating that buyers are gaining strength relative to sellers. The descending triangle has a flat support level at the bottom and falling highs, indicating seller dominance. The symmetrical triangle has converging trendlines with no flat side and a neutral structural bias that depends on the prior trend context.

How do you confirm a triangle pattern breakout?

Triangle pattern confirmation requires a full candle close beyond the trendline boundary on above-average volume. The breakout must also align with the dominant trend on the higher timeframe chart. Many experienced traders additionally wait for the broken trendline to be retested and hold as new support or resistance before entering, which provides stronger confirmation and reduces exposure to false breakouts.

What causes false breakouts in triangle patterns?

False breakouts occur when price briefly crosses the triangle boundary and then reverses back inside. The four main causes are a break on low volume with no institutional backing, a breakout that occurs too close to the apex of the triangle, a break during a low-liquidity trading session, and the absence of a prior trend to sustain the momentum. Large participants deliberately target the most obvious breakout levels to trigger retail orders before reversing direction.

How do you calculate the target for a triangle pattern?

The triangle pattern target uses the measured move method. Measure the height of the triangle at its widest point on the left side, the base. Project that exact distance from the breakout price in the direction of the break. For a triangle with an 80-pip base that breaks out at 1.0812, the upside target is 1.0892. Always check for major support or resistance levels between your entry and the calculated target, as they may cap the move before the full measured distance is reached.

Is the symmetrical triangle bullish or bearish?

A symmetrical triangle is directionally neutral on its own. The bias comes from the surrounding market context. A symmetrical triangle forming during a sustained uptrend leans bullish and is more likely to break to the upside. One forming after a sharp decline leans bearish. The symmetrical triangle also carries the highest false breakout rate of the three types because neither buyers nor sellers are clearly dominant going into the compression phase.

ezekiel chew asiaforexmentor

About Ezekiel Chew

Ezekiel Chew, founder and head of training at Asia Forex Mentor, is a renowned forex expert, frequently invited to speak at major industry events. Known for his deep market insights, Ezekiel is one of the top traders committed to supporting the trading community. Making six figures per trade, he also trains traders working in banks, fund management, and prop trading firms.

RELATED ARTICLES

Join the Live Event
Get Your Free Ticket Now

I consent to receiving emails and/or text message reminders for this event.

REGISTER FOR THE MASTERCLASS!