

Learn To Trade Forex • Best Forex Trading Course • AsiaForexMentor

Traders Dynamic Index 2026 Complete Forex Guide

Written by

Ezekiel Chew

Updated on

August 6, 2026

i
Its a default text

Traders Dynamic Index 2026 Complete Forex Guide

Written by:

Last updated on:

August 6, 2026

Most traders carry three separate indicators on their chart to do what the Traders Dynamic Index accomplishes in a single window. The TDI combines a 13-period RSI, two signal line moving averages, and a 34-period Bollinger Band applied directly to the RSI oscillator. The result is one panel that shows trend direction, entry timing, and volatility context simultaneously.

ABOUT THIS GUIDE

This guide breaks down each TDI component and explains what it measures, covers the recommended settings for H1 and H4 charts, walks through the exact entry and exit signals the indicator produces, and shows how to read divergence correctly. It also covers the common mistakes that produce false signals and how to place the TDI inside a complete trade plan.


QUICK ANSWER

The Traders Dynamic Index is an oscillator that combines a 13-period RSI (the price line), a 2-period fast signal line, a 7-period slow signal line, and 34-period Bollinger Bands into one panel. Traders enter on signal line crossovers inside defined momentum zones (above 68 for bullish, below 32 for bearish), with the 50 midline acting as the primary trend filter.

What Is the Traders Dynamic Index

The Traders Dynamic Index is a custom forex oscillator for the MetaTrader platform. It takes a standard RSI and enhances it by adding two moving average signal lines and a Bollinger Band volatility envelope, all displayed inside the same indicator panel. The indicator is available free on MT4 and MT5.

The standard RSI reading tells you who controls the market. The Bollinger Bands applied to the RSI show how far momentum has extended relative to recent price history. The two moving average signal lines create an entry crossover trigger so traders have a defined moment to act rather than reading a single oscillator line and guessing.

No single component in the TDI is new. The value is in the combination. All three layers feed into one clean oscillator panel so traders can assess trend direction, signal timing, and volatility state without flipping between multiple indicator windows.

How the Three TDI Components Work Together
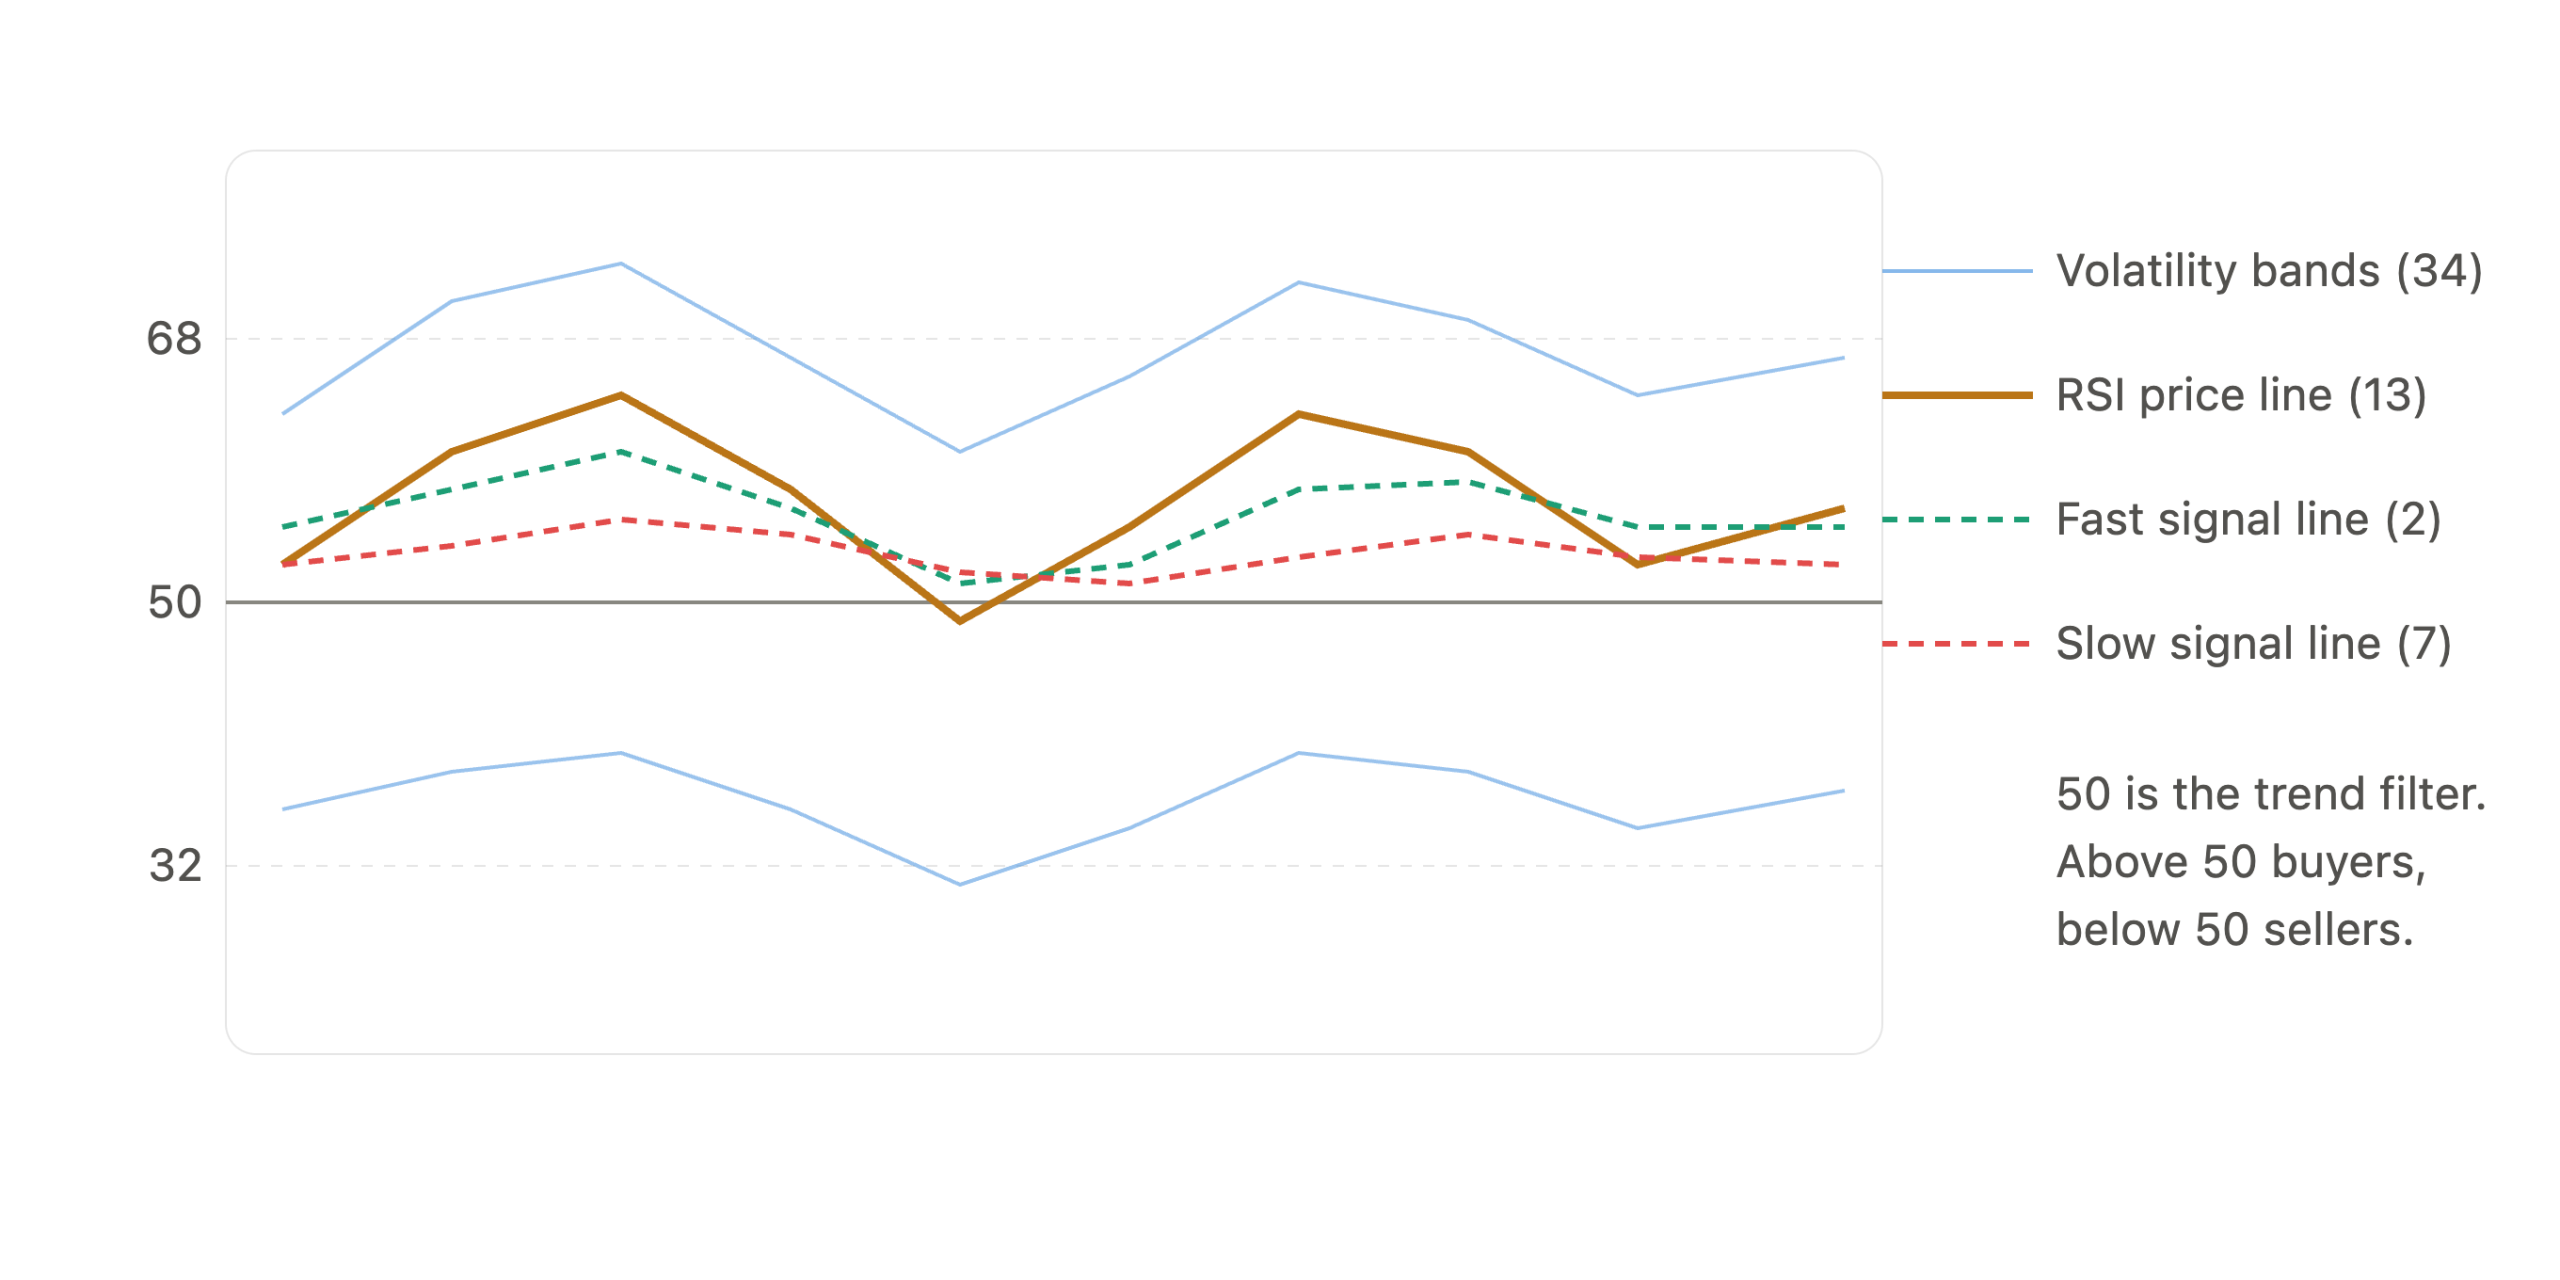
The TDI displays four lines inside one indicator panel. Each line does a specific job. Understanding what each one measures before looking at entry signals prevents a large portion of the confusion traders have with this indicator.

Here is what each component does and why it matters:

  • RSI Price Line (yellow or green depending on platform): The 13-period RSI of the closing price. This is the core momentum reading. Above 50 means buyers have control. Below 50 means sellers do.
  • Fast Signal Line (green dashed): A 2-period moving average applied to the RSI. This line reacts quickly to short-term momentum shifts and acts as the trigger line for crossover entries.
  • Slow Signal Line (red dashed): A 7-period moving average applied to the RSI. This line is smoother and represents the intermediate trend. It is the baseline the fast line crosses against.
  • Volatility Bands (upper and lower blue lines): A 34-period Bollinger Band applied to the RSI using a 1.6185 standard deviation. Wide, expanding bands signal building momentum. Narrow, flat bands signal low-energy consolidation.

The four components work as a system rather than as four independent signals. A crossover on its own is a weak trigger. A crossover happening above 68 while the RSI price line rides the upper volatility band is a much higher-probability signal. Reading the TDI correctly means evaluating all four lines together, not isolating the crossover.

TDI Settings for H1 and H4 Timeframes

The default TDI inputs work across most timeframes, but H1 and H4 each benefit from knowing exactly what each setting controls. The table below shows the default settings and the H1 adjustment most traders use.

Input Default (H4) H1 Adjustment What It Controls
RSI Period 13 8 Core momentum sensitivity
Volatility Band Period 34 21 Smoothness of the BB envelope
Band Deviation 1.6185 1.6185 Width of the volatility bands
Fast Signal MA Period 2 2 Reaction speed of the entry trigger line
Slow Signal MA Period 7 7 Smoothness of the trend direction line

H4 Timeframe Settings

Use the default settings without adjustment on H4. Each H4 candle carries enough price data that the 13-period RSI captures meaningful swing momentum. Reducing the RSI period on H4 produces more frequent crossovers but with less momentum behind each one, which means more false entries rather than better signals.

H1 Timeframe Settings

Reducing the RSI period from 13 to 8 and the band period from 34 to 21 makes the indicator more responsive to the faster price cycles on H1. The fast and slow signal line periods remain at 2 and 7. The tradeoff is a slightly higher crossover frequency, which is why H4 confirmation becomes more important before acting on any H1 TDI signal.

Leave the 1.6185 deviation setting unchanged unless you have a specific backtested reason. That figure approximates the golden ratio and is calibrated to contain the majority of RSI swings within the bands without making the envelope so wide that signals lose their meaning.

Core TDI Entry Signals

The TDI produces three layered signal types. The highest-probability entries form when all three point in the same direction at the same time. Here is how each one works.

Signal Line Crossovers

Signal line crossovers are the primary TDI entry trigger. When the fast line (green) crosses above the slow line (red), the indicator points to a long setup. When the fast line crosses below the slow line, it points to a short.

The location of the crossover inside the panel determines how much weight the signal carries. Here is how to interpret crossovers by zone:

  • Above 68: Strong bullish zone. A green-above-red crossover here signals high continuation momentum. This is not an overbought warning as it would be in traditional RSI logic.
  • Between 50 and 68: Moderate bullish zone. The crossover is valid but carries less momentum than one occurring above 68.
  • At or near 50: Neutral zone. Crossovers near the midline are low-probability without additional confirmation from market structure.
  • Between 32 and 50: Moderate bearish zone. A green-below-red crossover confirms that selling pressure is building.
  • Below 32: Strong bearish zone. Crossovers below 32 signal continuation to the downside, not exhaustion.

RSI Position Relative to the Volatility Band

The Bollinger Bands on the TDI panel act as a momentum quality filter. The position of the RSI price line relative to those bands tells you whether momentum is expanding or fading, which changes how much conviction you apply to a crossover signal.

Here is what each band position signals for an active trade:

  • RSI riding or touching the upper band means the uptrend has strong momentum. Long positions remain valid.
  • RSI pulling away from the upper band back toward center signals fading bullish momentum. Monitor for an exit trigger.
  • RSI touching or riding the lower band means the downtrend has strong momentum. Short positions remain valid.
  • RSI expanding beyond a band during a crossover signals an unusually strong directional move worth noting on the higher timeframe as well.

For a complete breakdown of how to read momentum context across different chart types before applying indicator overlays, see how to read forex charts before going live with the TDI.

Key Zone Levels and Trend Direction
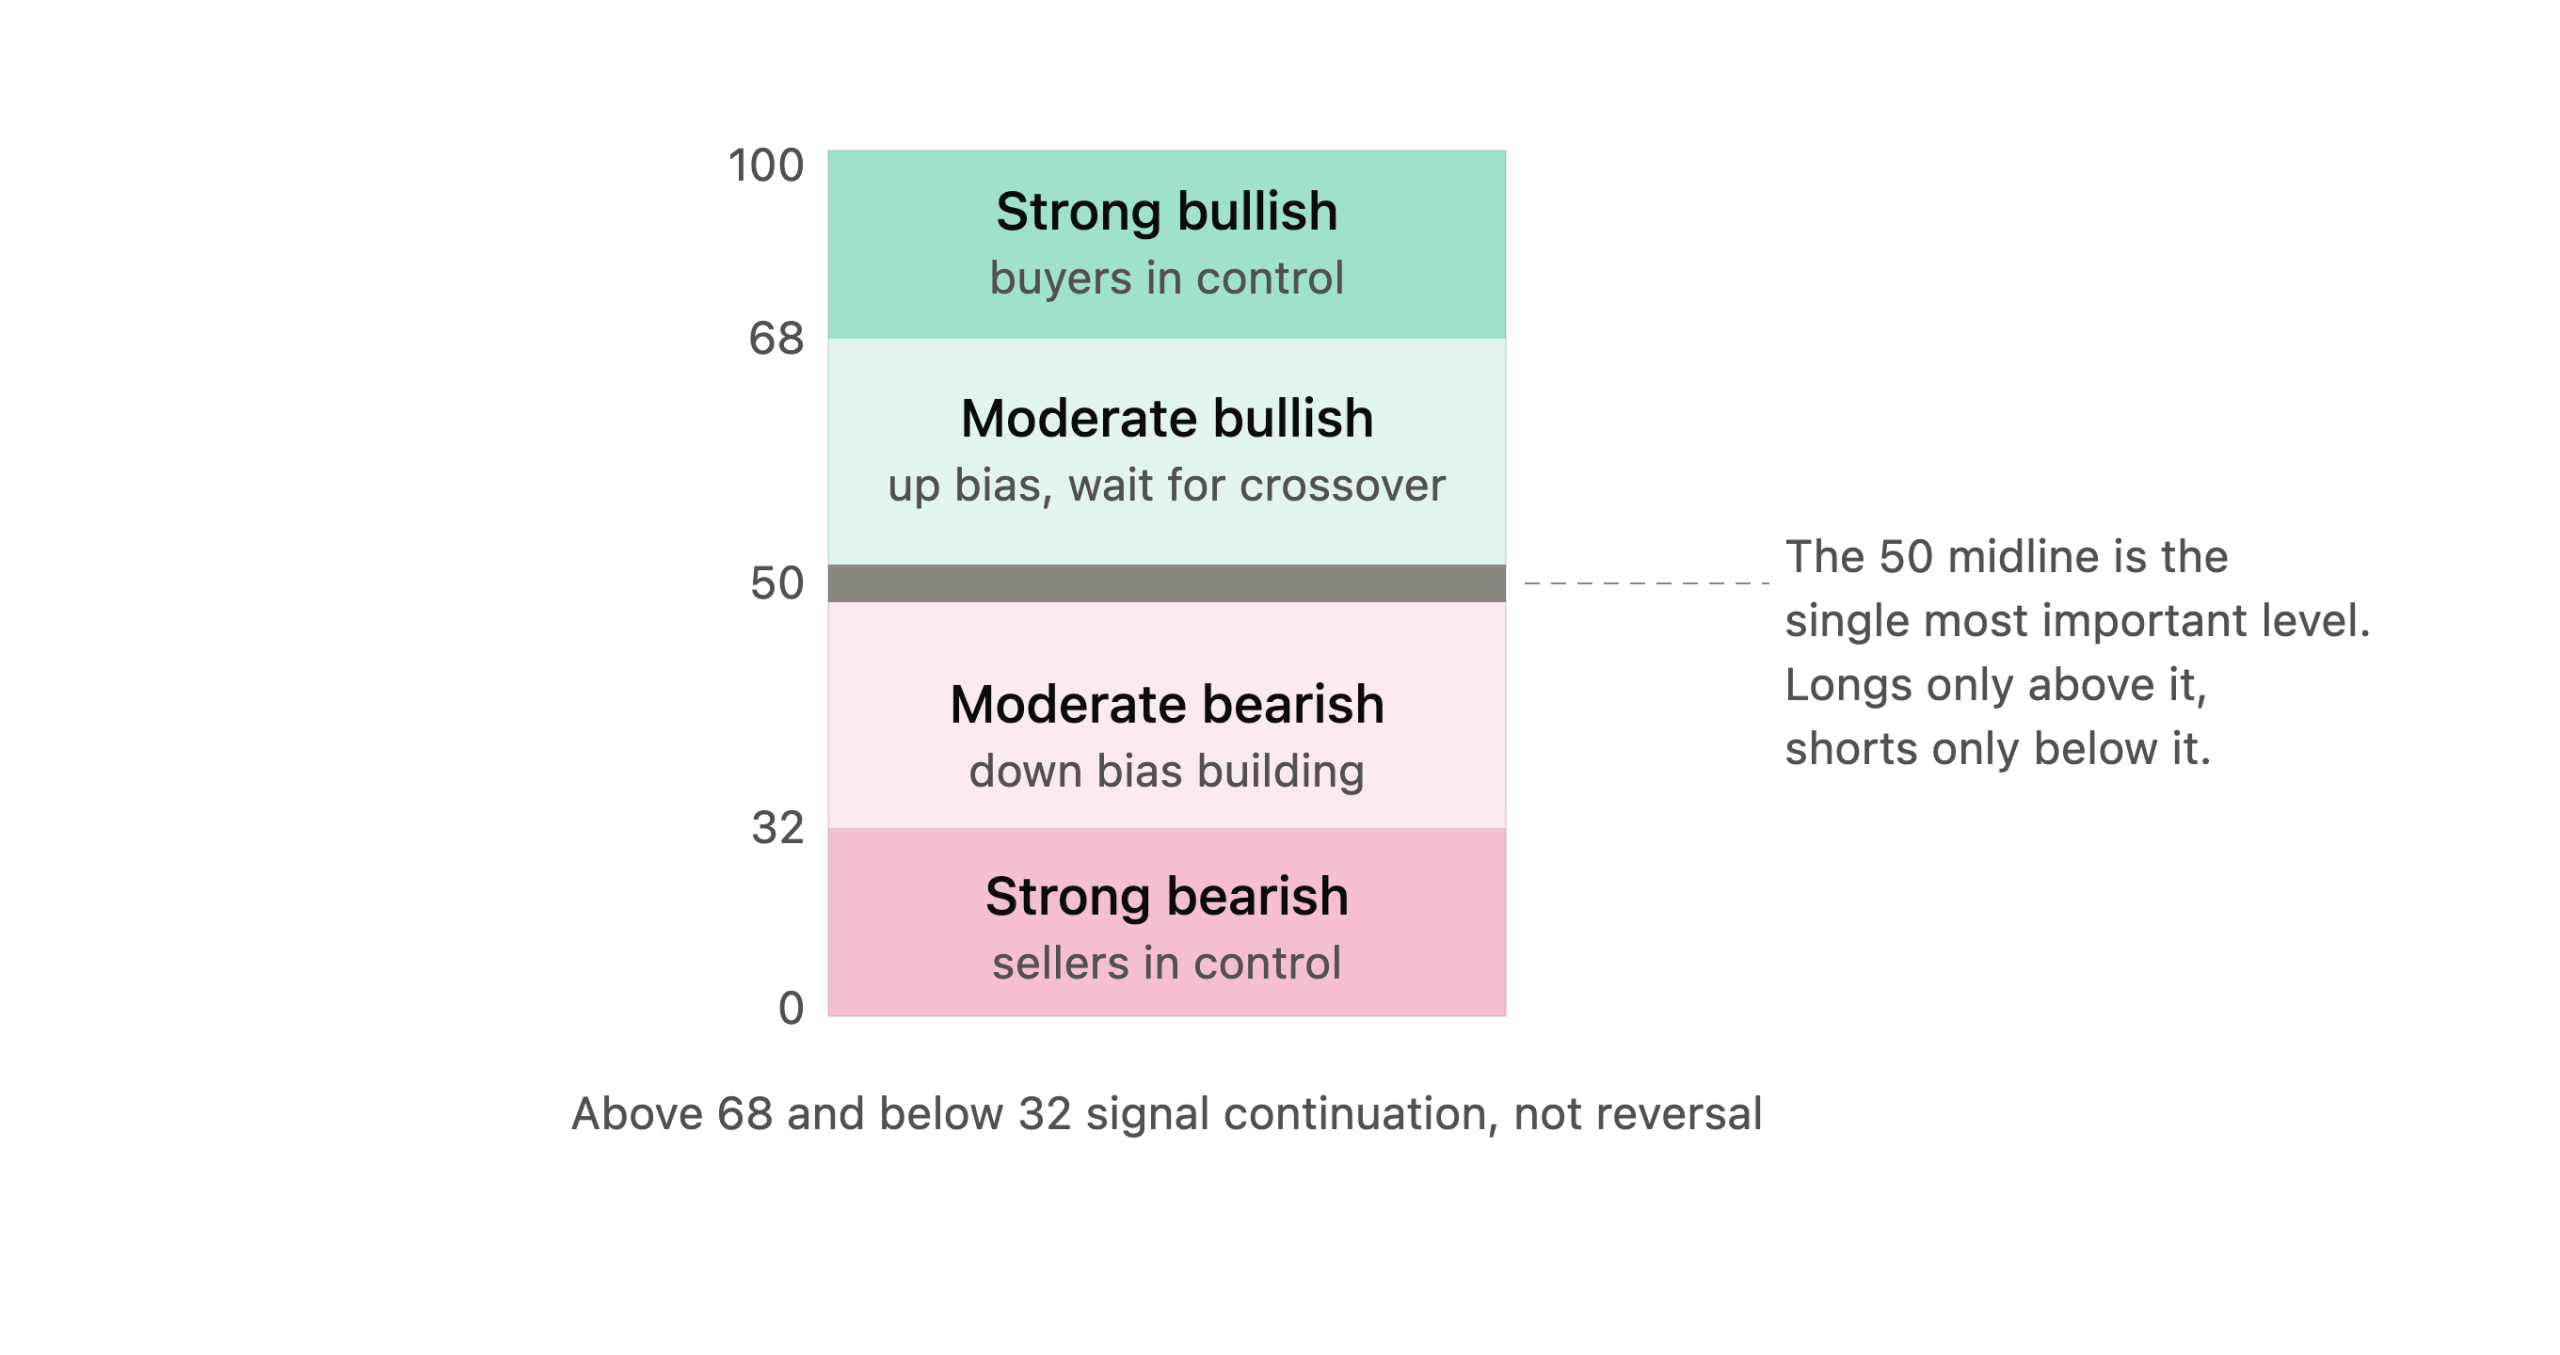
The TDI uses three threshold levels instead of the standard RSI overbought (70) and oversold (30) readings. These zones define momentum strength and direction. Understanding them changes how you interpret the entire indicator.

Here is what each zone means for trade direction:

  • 68 and above: Strong bullish momentum zone. Buyers are firmly in control. Positions stay long while the RSI holds this zone.
  • 50 to 68: Moderate bullish zone. Upward bias is confirmed but not at peak strength. Wait for a crossover before entering a long.
  • 50 (midline): The most critical TDI level. RSI price line above 50 confirms a bullish trend. Below 50 confirms a bearish trend. Never take a buy signal when the RSI is below the midline.
  • 32 to 50: Moderate bearish zone. Downward bias is confirmed. Look for crossovers pointing down for short entries.
  • 32 and below: Strong bearish momentum zone. Sellers are firmly in control. Positions stay short while the RSI holds this zone.

How to Read Divergence on the TDI

TDI divergence is read between the RSI price line inside the indicator panel and the actual price action on the main chart. The 13-period RSI default catches divergence slightly earlier than a standard 14-period RSI, which gives a small advantage in identifying momentum shifts ahead of the crowd.

Bearish divergence forms when price makes a higher high but the RSI price line inside the TDI panel makes a lower high at the same time. Upside momentum is weakening even as price continues higher. A reversal or a significant pullback is more likely to follow.

Bullish divergence forms when price makes a lower low but the RSI price line makes a higher low. Selling momentum is fading. The market may be preparing to reverse higher.

To identify divergence on the TDI correctly, follow these steps:

  1. Identify two consecutive swing highs on the price chart (for bearish divergence) or two consecutive swing lows (for bullish divergence).
  2. Look at the corresponding swing points on the RSI price line inside the TDI panel.
  3. Compare whether the RSI is confirming the price move or moving in the opposite direction.
  4. If price and the RSI price line move in opposite directions, divergence is present.
  5. Wait for the fast signal line to cross the slow signal line before entering the divergence trade.

Divergence alone does not confirm an entry. Price can continue pushing against a divergence signal for several candles before reversing. The crossover trigger confirms that momentum has actually shifted before you commit to a position.

Common Mistakes That Produce False Signals

The TDI generates reliable signals in trending markets and noisy signals in low-momentum consolidation. Most false entries do not come from a flaw in the indicator. They come from applying it in the wrong market context or with the wrong expectations.

Here are the most common TDI mistakes and how to correct each one:

  • Trading crossovers in a flat market: When the volatility bands are narrow and running nearly parallel, the market is in low-energy consolidation. Crossovers in this condition are frequent and carry no momentum behind them. Wait for the bands to widen before re-entering.
  • Ignoring the higher timeframe: An H1 buy signal during a dominant H4 downtrend will fail more often than it succeeds. Always check market structure on the higher timeframe first. The higher timeframe sets the directional bias. The lower timeframe refines the exact entry.
  • Applying traditional RSI overbought rules to the TDI: Most retail traders learn RSI as an overbought and oversold tool and carry that conditioning into the TDI. A TDI reading above 68 is a trend continuation signal, not a reversal warning. Traders who close longs at 68 or reverse at 68 consistently exit winning trades too early.
  • Entering on a midline crossover without zone confirmation: A crossover near 50 with no clear directional momentum behind it is a low-probability setup. The RSI price line needs to be above 50 for a long or below 50 for a short before the crossover carries real weight.
  • Chasing the signal after several candles: A TDI signal should be acted on at or near the close of the trigger candle. Entering multiple candles after the crossover usually means accepting a worse entry price and a risk-to-reward ratio that no longer justifies the trade.

How to Add the TDI to a Complete Trade Plan

The TDI works best as a confirmation tool layered onto a directional bias, not as a standalone system. Its role is to confirm momentum is building on the lower timeframe after the higher timeframe direction is already established.

A practical TDI trade plan runs in this sequence. First, identify the dominant trend direction on the H4 chart using market structure (higher highs and higher lows for an uptrend, lower highs and lower lows for a downtrend). Second, wait for a pullback to a meaningful level on the H1 chart such as a previous support or resistance zone. Third, watch for the fast signal line to cross the slow signal line in the appropriate zone (above 50 for a long, below 50 for a short). Fourth, hold the trade while the RSI price line stays on the correct side of the 50 midline and the volatility bands remain expanded.

This approach works cleanly alongside price action trading principles. Price action and market structure handle the directional bias and level identification. The TDI handles the momentum confirmation. Combining the two filters removes the low-probability midline crossovers and focuses entries on setups that have multi-timeframe agreement behind them.

For traders building a broader indicator toolkit, understanding where momentum oscillators fit alongside trend and entry tools is worth examining across the best trading strategies for forex. The TDI is one of several composite oscillators that compress multiple signals into a cleaner, more readable format without losing the underlying data.

Also Read: 7 Best Trading Strategies That Actually Work in 2026

Conclusion

The Traders Dynamic Index earns its place on the chart because it compresses three layers of information into one panel without hiding any of the underlying data. The 13-period RSI provides the momentum read. The signal lines provide the entry trigger. The volatility bands provide the market context that tells you whether a signal is worth acting on.

The highest-probability TDI setups form when a signal line crossover happens in the 68 and above or 32 and below zones on a chart where the higher timeframe trend is already clear and aligned. Divergence between the RSI price line and actual price adds a forward-looking layer that pure trend-following signals miss entirely. Narrow volatility bands are the clearest instruction to step aside and wait.

Asia Forex Mentor has trained more than 100,000 traders across 50+ countries to build systematic, rules-based approaches to reading the market. For traders who want to see how the TDI fits inside a complete, structured trading framework, the free webinar covers how to combine momentum indicators, market structure, and key levels into high-probability setups built to hold up across changing market conditions.

Frequently Asked Questions

What Is the Traders Dynamic Index

The Traders Dynamic Index is a forex oscillator that combines a 13-period RSI (the RSI price line), a 2-period fast signal line, a 7-period slow signal line, and a 34-period Bollinger Band applied to the RSI, all displayed inside one panel. Traders use the signal line crossovers, the RSI's position within defined momentum zones, and the width of the volatility bands to read trend direction, time entries, and filter out low-probability signals. The indicator is available free as a custom download for MT4 and MT5.

What Are the Best TDI Settings

The standard TDI settings use an RSI period of 13, a volatility band period of 34, a band deviation of 1.6185, a fast MA period of 2, and a slow MA period of 7. These settings work without adjustment on H4. For H1 charts, reducing the RSI period to 8 and the band period to 21 makes the indicator more responsive to faster intraday price cycles. The fast and slow MA periods remain at 2 and 7 on both timeframes. Changing the 1.6185 deviation is rarely necessary and usually makes the bands less effective as a volatility filter.

How Do You Get a TDI Buy Signal

A TDI buy signal forms when the fast signal line (green) crosses above the slow signal line (red) while the RSI price line is above 50. The signal carries more weight when the crossover happens in the 50 to 68 zone or above 68. The strongest long setups occur when the RSI pulls back toward 50 during an established uptrend and a green-above-red crossover forms as it resumes upward, with the RSI price line pushing back toward the upper volatility band.

What Does TDI Divergence Mean

TDI divergence forms when the RSI price line inside the panel moves in the opposite direction to actual price. Bearish divergence occurs when price makes a higher high but the RSI makes a lower high, signaling that upside momentum is weakening. Bullish divergence occurs when price makes a lower low but the RSI makes a higher low, signaling that downside momentum is fading. Divergence is a warning about a weakening trend, not a standalone entry signal. Wait for the fast signal line to cross the slow signal line before entering to confirm the actual momentum shift.

Why Does the TDI Produce False Signals

The most common cause of false TDI signals is entering on signal line crossovers when the volatility bands are narrow and running flat. Narrow bands mean low momentum and a ranging market where crossovers occur frequently but produce no follow-through. The second most common cause is entering an H1 TDI signal that runs against the dominant H4 trend direction. When the higher timeframe trend is clearly bearish, H1 buy signals from the TDI will fail the majority of the time. Aligning TDI entries with the higher timeframe direction eliminates most false signal scenarios.


About Ezekiel Chew​

Ezekiel Chew, founder and head of training at Asia Forex Mentor, is a renowned forex expert, frequently invited to speak at major industry events. Known for his deep market insights, Ezekiel is one of the top traders committed to supporting the trading community. Making six figures per trade, he also trains traders working in banks, fund management, and prop trading firms.

How to Draw Trend Lines in Trading the Right Way 2026

Most traders drawing trend lines in trading are connecting random price points and calling it technical analysis, which is why their supposed support turns into thin air the moment price actually touches it. ABOUT THIS GUIDE This guide covers the institutional method for drawing valid trend lines in forex. It

Read More

Head and Shoulders Pattern Forex Guide 2026

Recognizing the head and shoulders pattern and trading it correctly are two entirely different skills. Most forex traders who spot the formation still end up stopped out before the move begins. The pattern appears in virtually every technical analysis curriculum and across all forex pairs and timeframes, yet the entry

Read More

Rising Wedge Pattern Forex Breakout Guide 2026

The rising wedge pattern is built to look bullish. Price grinds out higher highs and higher lows the whole time it’s forming, and that’s exactly why so many traders buy into the rally. Then they get trapped on the wrong side the moment it finally breaks. ABOUT THIS GUIDE This

Read More

Currency Strength Meter Trading Strategy 2026

A lot of traders install a currency strength meter and still never trade it well. The problem is they treat what is really just a directional filter like a full entry signal, and it shows up in their results. ABOUT THIS GUIDE This guide covers what a currency strength meter

Read More

Fibonacci Retracement Forex Trading Guide 2026

Most traders who use fibonacci retracement anchor the tool to the wrong swing points, then treat every level the chart produces as a valid trade signal. ABOUT THIS GUIDE This guide covers how to draw fibonacci retracement correctly on a real forex chart, which levels carry genuine weight, and the

Read More

Multiple Timeframe Analysis How Institutions Trade Forex

Most forex traders who get stopped out consistently are missing the same thing: multiple timeframe analysis. They always blindly enter trades based from the the larger market structure is doing. ABOUT THIS GUIDE This guide explains the complete multiple timeframe analysis process used by institutional forex traders. It covers why

Read More

AFM Trading Summit Live

Date: Coming Soon

Join us at the AFM Trading Summit Live and learn from top industry experts through live trading sessions, market insights, and actionable strategies.

Traders Dynamic Index 2026 Complete Forex Guide

4.0
Overall Trust Index

Written by:

Updated:

August 6, 2026
Most traders carry three separate indicators on their chart to do what the Traders Dynamic Index accomplishes in a single window. The TDI combines a 13-period RSI, two signal line moving averages, and a 34-period Bollinger Band applied directly to the RSI oscillator. The result is one panel that shows trend direction, entry timing, and volatility context simultaneously.

ABOUT THIS GUIDE

This guide breaks down each TDI component and explains what it measures, covers the recommended settings for H1 and H4 charts, walks through the exact entry and exit signals the indicator produces, and shows how to read divergence correctly. It also covers the common mistakes that produce false signals and how to place the TDI inside a complete trade plan.
 

QUICK ANSWER

The Traders Dynamic Index is an oscillator that combines a 13-period RSI (the price line), a 2-period fast signal line, a 7-period slow signal line, and 34-period Bollinger Bands into one panel. Traders enter on signal line crossovers inside defined momentum zones (above 68 for bullish, below 32 for bearish), with the 50 midline acting as the primary trend filter.

What Is the Traders Dynamic Index

The Traders Dynamic Index is a custom forex oscillator for the MetaTrader platform. It takes a standard RSI and enhances it by adding two moving average signal lines and a Bollinger Band volatility envelope, all displayed inside the same indicator panel. The indicator is available free on MT4 and MT5. The standard RSI reading tells you who controls the market. The Bollinger Bands applied to the RSI show how far momentum has extended relative to recent price history. The two moving average signal lines create an entry crossover trigger so traders have a defined moment to act rather than reading a single oscillator line and guessing. No single component in the TDI is new. The value is in the combination. All three layers feed into one clean oscillator panel so traders can assess trend direction, signal timing, and volatility state without flipping between multiple indicator windows.

How the Three TDI Components Work Together

The TDI displays four lines inside one indicator panel. Each line does a specific job. Understanding what each one measures before looking at entry signals prevents a large portion of the confusion traders have with this indicator. Here is what each component does and why it matters:
  • RSI Price Line (yellow or green depending on platform): The 13-period RSI of the closing price. This is the core momentum reading. Above 50 means buyers have control. Below 50 means sellers do.
  • Fast Signal Line (green dashed): A 2-period moving average applied to the RSI. This line reacts quickly to short-term momentum shifts and acts as the trigger line for crossover entries.
  • Slow Signal Line (red dashed): A 7-period moving average applied to the RSI. This line is smoother and represents the intermediate trend. It is the baseline the fast line crosses against.
  • Volatility Bands (upper and lower blue lines): A 34-period Bollinger Band applied to the RSI using a 1.6185 standard deviation. Wide, expanding bands signal building momentum. Narrow, flat bands signal low-energy consolidation.
The four components work as a system rather than as four independent signals. A crossover on its own is a weak trigger. A crossover happening above 68 while the RSI price line rides the upper volatility band is a much higher-probability signal. Reading the TDI correctly means evaluating all four lines together, not isolating the crossover.

TDI Settings for H1 and H4 Timeframes

The default TDI inputs work across most timeframes, but H1 and H4 each benefit from knowing exactly what each setting controls. The table below shows the default settings and the H1 adjustment most traders use.
Input Default (H4) H1 Adjustment What It Controls
RSI Period 13 8 Core momentum sensitivity
Volatility Band Period 34 21 Smoothness of the BB envelope
Band Deviation 1.6185 1.6185 Width of the volatility bands
Fast Signal MA Period 2 2 Reaction speed of the entry trigger line
Slow Signal MA Period 7 7 Smoothness of the trend direction line

H4 Timeframe Settings

Use the default settings without adjustment on H4. Each H4 candle carries enough price data that the 13-period RSI captures meaningful swing momentum. Reducing the RSI period on H4 produces more frequent crossovers but with less momentum behind each one, which means more false entries rather than better signals.

H1 Timeframe Settings

Reducing the RSI period from 13 to 8 and the band period from 34 to 21 makes the indicator more responsive to the faster price cycles on H1. The fast and slow signal line periods remain at 2 and 7. The tradeoff is a slightly higher crossover frequency, which is why H4 confirmation becomes more important before acting on any H1 TDI signal. Leave the 1.6185 deviation setting unchanged unless you have a specific backtested reason. That figure approximates the golden ratio and is calibrated to contain the majority of RSI swings within the bands without making the envelope so wide that signals lose their meaning.

Core TDI Entry Signals

The TDI produces three layered signal types. The highest-probability entries form when all three point in the same direction at the same time. Here is how each one works.

Signal Line Crossovers

Signal line crossovers are the primary TDI entry trigger. When the fast line (green) crosses above the slow line (red), the indicator points to a long setup. When the fast line crosses below the slow line, it points to a short. The location of the crossover inside the panel determines how much weight the signal carries. Here is how to interpret crossovers by zone:
  • Above 68: Strong bullish zone. A green-above-red crossover here signals high continuation momentum. This is not an overbought warning as it would be in traditional RSI logic.
  • Between 50 and 68: Moderate bullish zone. The crossover is valid but carries less momentum than one occurring above 68.
  • At or near 50: Neutral zone. Crossovers near the midline are low-probability without additional confirmation from market structure.
  • Between 32 and 50: Moderate bearish zone. A green-below-red crossover confirms that selling pressure is building.
  • Below 32: Strong bearish zone. Crossovers below 32 signal continuation to the downside, not exhaustion.

RSI Position Relative to the Volatility Band

The Bollinger Bands on the TDI panel act as a momentum quality filter. The position of the RSI price line relative to those bands tells you whether momentum is expanding or fading, which changes how much conviction you apply to a crossover signal. Here is what each band position signals for an active trade:
  • RSI riding or touching the upper band means the uptrend has strong momentum. Long positions remain valid.
  • RSI pulling away from the upper band back toward center signals fading bullish momentum. Monitor for an exit trigger.
  • RSI touching or riding the lower band means the downtrend has strong momentum. Short positions remain valid.
  • RSI expanding beyond a band during a crossover signals an unusually strong directional move worth noting on the higher timeframe as well.
For a complete breakdown of how to read momentum context across different chart types before applying indicator overlays, see how to read forex charts before going live with the TDI.

Key Zone Levels and Trend Direction

The TDI uses three threshold levels instead of the standard RSI overbought (70) and oversold (30) readings. These zones define momentum strength and direction. Understanding them changes how you interpret the entire indicator. Here is what each zone means for trade direction:
  • 68 and above: Strong bullish momentum zone. Buyers are firmly in control. Positions stay long while the RSI holds this zone.
  • 50 to 68: Moderate bullish zone. Upward bias is confirmed but not at peak strength. Wait for a crossover before entering a long.
  • 50 (midline): The most critical TDI level. RSI price line above 50 confirms a bullish trend. Below 50 confirms a bearish trend. Never take a buy signal when the RSI is below the midline.
  • 32 to 50: Moderate bearish zone. Downward bias is confirmed. Look for crossovers pointing down for short entries.
  • 32 and below: Strong bearish momentum zone. Sellers are firmly in control. Positions stay short while the RSI holds this zone.

How to Read Divergence on the TDI

TDI divergence is read between the RSI price line inside the indicator panel and the actual price action on the main chart. The 13-period RSI default catches divergence slightly earlier than a standard 14-period RSI, which gives a small advantage in identifying momentum shifts ahead of the crowd. Bearish divergence forms when price makes a higher high but the RSI price line inside the TDI panel makes a lower high at the same time. Upside momentum is weakening even as price continues higher. A reversal or a significant pullback is more likely to follow. Bullish divergence forms when price makes a lower low but the RSI price line makes a higher low. Selling momentum is fading. The market may be preparing to reverse higher. To identify divergence on the TDI correctly, follow these steps:
  1. Identify two consecutive swing highs on the price chart (for bearish divergence) or two consecutive swing lows (for bullish divergence).
  2. Look at the corresponding swing points on the RSI price line inside the TDI panel.
  3. Compare whether the RSI is confirming the price move or moving in the opposite direction.
  4. If price and the RSI price line move in opposite directions, divergence is present.
  5. Wait for the fast signal line to cross the slow signal line before entering the divergence trade.
Divergence alone does not confirm an entry. Price can continue pushing against a divergence signal for several candles before reversing. The crossover trigger confirms that momentum has actually shifted before you commit to a position.

Common Mistakes That Produce False Signals

The TDI generates reliable signals in trending markets and noisy signals in low-momentum consolidation. Most false entries do not come from a flaw in the indicator. They come from applying it in the wrong market context or with the wrong expectations. Here are the most common TDI mistakes and how to correct each one:
  • Trading crossovers in a flat market: When the volatility bands are narrow and running nearly parallel, the market is in low-energy consolidation. Crossovers in this condition are frequent and carry no momentum behind them. Wait for the bands to widen before re-entering.
  • Ignoring the higher timeframe: An H1 buy signal during a dominant H4 downtrend will fail more often than it succeeds. Always check market structure on the higher timeframe first. The higher timeframe sets the directional bias. The lower timeframe refines the exact entry.
  • Applying traditional RSI overbought rules to the TDI: Most retail traders learn RSI as an overbought and oversold tool and carry that conditioning into the TDI. A TDI reading above 68 is a trend continuation signal, not a reversal warning. Traders who close longs at 68 or reverse at 68 consistently exit winning trades too early.
  • Entering on a midline crossover without zone confirmation: A crossover near 50 with no clear directional momentum behind it is a low-probability setup. The RSI price line needs to be above 50 for a long or below 50 for a short before the crossover carries real weight.
  • Chasing the signal after several candles: A TDI signal should be acted on at or near the close of the trigger candle. Entering multiple candles after the crossover usually means accepting a worse entry price and a risk-to-reward ratio that no longer justifies the trade.

How to Add the TDI to a Complete Trade Plan

The TDI works best as a confirmation tool layered onto a directional bias, not as a standalone system. Its role is to confirm momentum is building on the lower timeframe after the higher timeframe direction is already established. A practical TDI trade plan runs in this sequence. First, identify the dominant trend direction on the H4 chart using market structure (higher highs and higher lows for an uptrend, lower highs and lower lows for a downtrend). Second, wait for a pullback to a meaningful level on the H1 chart such as a previous support or resistance zone. Third, watch for the fast signal line to cross the slow signal line in the appropriate zone (above 50 for a long, below 50 for a short). Fourth, hold the trade while the RSI price line stays on the correct side of the 50 midline and the volatility bands remain expanded. This approach works cleanly alongside price action trading principles. Price action and market structure handle the directional bias and level identification. The TDI handles the momentum confirmation. Combining the two filters removes the low-probability midline crossovers and focuses entries on setups that have multi-timeframe agreement behind them. For traders building a broader indicator toolkit, understanding where momentum oscillators fit alongside trend and entry tools is worth examining across the best trading strategies for forex. The TDI is one of several composite oscillators that compress multiple signals into a cleaner, more readable format without losing the underlying data.

Also Read: 7 Best Trading Strategies That Actually Work in 2026

Conclusion

The Traders Dynamic Index earns its place on the chart because it compresses three layers of information into one panel without hiding any of the underlying data. The 13-period RSI provides the momentum read. The signal lines provide the entry trigger. The volatility bands provide the market context that tells you whether a signal is worth acting on. The highest-probability TDI setups form when a signal line crossover happens in the 68 and above or 32 and below zones on a chart where the higher timeframe trend is already clear and aligned. Divergence between the RSI price line and actual price adds a forward-looking layer that pure trend-following signals miss entirely. Narrow volatility bands are the clearest instruction to step aside and wait. Asia Forex Mentor has trained more than 100,000 traders across 50+ countries to build systematic, rules-based approaches to reading the market. For traders who want to see how the TDI fits inside a complete, structured trading framework, the free webinar covers how to combine momentum indicators, market structure, and key levels into high-probability setups built to hold up across changing market conditions.

Frequently Asked Questions

What Is the Traders Dynamic Index

The Traders Dynamic Index is a forex oscillator that combines a 13-period RSI (the RSI price line), a 2-period fast signal line, a 7-period slow signal line, and a 34-period Bollinger Band applied to the RSI, all displayed inside one panel. Traders use the signal line crossovers, the RSI's position within defined momentum zones, and the width of the volatility bands to read trend direction, time entries, and filter out low-probability signals. The indicator is available free as a custom download for MT4 and MT5.

What Are the Best TDI Settings

The standard TDI settings use an RSI period of 13, a volatility band period of 34, a band deviation of 1.6185, a fast MA period of 2, and a slow MA period of 7. These settings work without adjustment on H4. For H1 charts, reducing the RSI period to 8 and the band period to 21 makes the indicator more responsive to faster intraday price cycles. The fast and slow MA periods remain at 2 and 7 on both timeframes. Changing the 1.6185 deviation is rarely necessary and usually makes the bands less effective as a volatility filter.

How Do You Get a TDI Buy Signal

A TDI buy signal forms when the fast signal line (green) crosses above the slow signal line (red) while the RSI price line is above 50. The signal carries more weight when the crossover happens in the 50 to 68 zone or above 68. The strongest long setups occur when the RSI pulls back toward 50 during an established uptrend and a green-above-red crossover forms as it resumes upward, with the RSI price line pushing back toward the upper volatility band.

What Does TDI Divergence Mean

TDI divergence forms when the RSI price line inside the panel moves in the opposite direction to actual price. Bearish divergence occurs when price makes a higher high but the RSI makes a lower high, signaling that upside momentum is weakening. Bullish divergence occurs when price makes a lower low but the RSI makes a higher low, signaling that downside momentum is fading. Divergence is a warning about a weakening trend, not a standalone entry signal. Wait for the fast signal line to cross the slow signal line before entering to confirm the actual momentum shift.

Why Does the TDI Produce False Signals

The most common cause of false TDI signals is entering on signal line crossovers when the volatility bands are narrow and running flat. Narrow bands mean low momentum and a ranging market where crossovers occur frequently but produce no follow-through. The second most common cause is entering an H1 TDI signal that runs against the dominant H4 trend direction. When the higher timeframe trend is clearly bearish, H1 buy signals from the TDI will fail the majority of the time. Aligning TDI entries with the higher timeframe direction eliminates most false signal scenarios.

ezekiel chew asiaforexmentor

About Ezekiel Chew

Ezekiel Chew, founder and head of training at Asia Forex Mentor, is a renowned forex expert, frequently invited to speak at major industry events. Known for his deep market insights, Ezekiel is one of the top traders committed to supporting the trading community. Making six figures per trade, he also trains traders working in banks, fund management, and prop trading firms.

RELATED ARTICLES

Traders Dynamic Index 2026 Complete Forex Guide

4.0
Overall Trust Index

Written by:

Updated:

August 6, 2026
Most traders carry three separate indicators on their chart to do what the Traders Dynamic Index accomplishes in a single window. The TDI combines a 13-period RSI, two signal line moving averages, and a 34-period Bollinger Band applied directly to the RSI oscillator. The result is one panel that shows trend direction, entry timing, and volatility context simultaneously.

ABOUT THIS GUIDE

This guide breaks down each TDI component and explains what it measures, covers the recommended settings for H1 and H4 charts, walks through the exact entry and exit signals the indicator produces, and shows how to read divergence correctly. It also covers the common mistakes that produce false signals and how to place the TDI inside a complete trade plan.
 

QUICK ANSWER

The Traders Dynamic Index is an oscillator that combines a 13-period RSI (the price line), a 2-period fast signal line, a 7-period slow signal line, and 34-period Bollinger Bands into one panel. Traders enter on signal line crossovers inside defined momentum zones (above 68 for bullish, below 32 for bearish), with the 50 midline acting as the primary trend filter.

What Is the Traders Dynamic Index

The Traders Dynamic Index is a custom forex oscillator for the MetaTrader platform. It takes a standard RSI and enhances it by adding two moving average signal lines and a Bollinger Band volatility envelope, all displayed inside the same indicator panel. The indicator is available free on MT4 and MT5. The standard RSI reading tells you who controls the market. The Bollinger Bands applied to the RSI show how far momentum has extended relative to recent price history. The two moving average signal lines create an entry crossover trigger so traders have a defined moment to act rather than reading a single oscillator line and guessing. No single component in the TDI is new. The value is in the combination. All three layers feed into one clean oscillator panel so traders can assess trend direction, signal timing, and volatility state without flipping between multiple indicator windows.

How the Three TDI Components Work Together

The TDI displays four lines inside one indicator panel. Each line does a specific job. Understanding what each one measures before looking at entry signals prevents a large portion of the confusion traders have with this indicator. Here is what each component does and why it matters:
  • RSI Price Line (yellow or green depending on platform): The 13-period RSI of the closing price. This is the core momentum reading. Above 50 means buyers have control. Below 50 means sellers do.
  • Fast Signal Line (green dashed): A 2-period moving average applied to the RSI. This line reacts quickly to short-term momentum shifts and acts as the trigger line for crossover entries.
  • Slow Signal Line (red dashed): A 7-period moving average applied to the RSI. This line is smoother and represents the intermediate trend. It is the baseline the fast line crosses against.
  • Volatility Bands (upper and lower blue lines): A 34-period Bollinger Band applied to the RSI using a 1.6185 standard deviation. Wide, expanding bands signal building momentum. Narrow, flat bands signal low-energy consolidation.
The four components work as a system rather than as four independent signals. A crossover on its own is a weak trigger. A crossover happening above 68 while the RSI price line rides the upper volatility band is a much higher-probability signal. Reading the TDI correctly means evaluating all four lines together, not isolating the crossover.

TDI Settings for H1 and H4 Timeframes

The default TDI inputs work across most timeframes, but H1 and H4 each benefit from knowing exactly what each setting controls. The table below shows the default settings and the H1 adjustment most traders use.
Input Default (H4) H1 Adjustment What It Controls
RSI Period 13 8 Core momentum sensitivity
Volatility Band Period 34 21 Smoothness of the BB envelope
Band Deviation 1.6185 1.6185 Width of the volatility bands
Fast Signal MA Period 2 2 Reaction speed of the entry trigger line
Slow Signal MA Period 7 7 Smoothness of the trend direction line

H4 Timeframe Settings

Use the default settings without adjustment on H4. Each H4 candle carries enough price data that the 13-period RSI captures meaningful swing momentum. Reducing the RSI period on H4 produces more frequent crossovers but with less momentum behind each one, which means more false entries rather than better signals.

H1 Timeframe Settings

Reducing the RSI period from 13 to 8 and the band period from 34 to 21 makes the indicator more responsive to the faster price cycles on H1. The fast and slow signal line periods remain at 2 and 7. The tradeoff is a slightly higher crossover frequency, which is why H4 confirmation becomes more important before acting on any H1 TDI signal. Leave the 1.6185 deviation setting unchanged unless you have a specific backtested reason. That figure approximates the golden ratio and is calibrated to contain the majority of RSI swings within the bands without making the envelope so wide that signals lose their meaning.

Core TDI Entry Signals

The TDI produces three layered signal types. The highest-probability entries form when all three point in the same direction at the same time. Here is how each one works.

Signal Line Crossovers

Signal line crossovers are the primary TDI entry trigger. When the fast line (green) crosses above the slow line (red), the indicator points to a long setup. When the fast line crosses below the slow line, it points to a short. The location of the crossover inside the panel determines how much weight the signal carries. Here is how to interpret crossovers by zone:
  • Above 68: Strong bullish zone. A green-above-red crossover here signals high continuation momentum. This is not an overbought warning as it would be in traditional RSI logic.
  • Between 50 and 68: Moderate bullish zone. The crossover is valid but carries less momentum than one occurring above 68.
  • At or near 50: Neutral zone. Crossovers near the midline are low-probability without additional confirmation from market structure.
  • Between 32 and 50: Moderate bearish zone. A green-below-red crossover confirms that selling pressure is building.
  • Below 32: Strong bearish zone. Crossovers below 32 signal continuation to the downside, not exhaustion.

RSI Position Relative to the Volatility Band

The Bollinger Bands on the TDI panel act as a momentum quality filter. The position of the RSI price line relative to those bands tells you whether momentum is expanding or fading, which changes how much conviction you apply to a crossover signal. Here is what each band position signals for an active trade:
  • RSI riding or touching the upper band means the uptrend has strong momentum. Long positions remain valid.
  • RSI pulling away from the upper band back toward center signals fading bullish momentum. Monitor for an exit trigger.
  • RSI touching or riding the lower band means the downtrend has strong momentum. Short positions remain valid.
  • RSI expanding beyond a band during a crossover signals an unusually strong directional move worth noting on the higher timeframe as well.
For a complete breakdown of how to read momentum context across different chart types before applying indicator overlays, see how to read forex charts before going live with the TDI.

Key Zone Levels and Trend Direction

The TDI uses three threshold levels instead of the standard RSI overbought (70) and oversold (30) readings. These zones define momentum strength and direction. Understanding them changes how you interpret the entire indicator. Here is what each zone means for trade direction:
  • 68 and above: Strong bullish momentum zone. Buyers are firmly in control. Positions stay long while the RSI holds this zone.
  • 50 to 68: Moderate bullish zone. Upward bias is confirmed but not at peak strength. Wait for a crossover before entering a long.
  • 50 (midline): The most critical TDI level. RSI price line above 50 confirms a bullish trend. Below 50 confirms a bearish trend. Never take a buy signal when the RSI is below the midline.
  • 32 to 50: Moderate bearish zone. Downward bias is confirmed. Look for crossovers pointing down for short entries.
  • 32 and below: Strong bearish momentum zone. Sellers are firmly in control. Positions stay short while the RSI holds this zone.

How to Read Divergence on the TDI

TDI divergence is read between the RSI price line inside the indicator panel and the actual price action on the main chart. The 13-period RSI default catches divergence slightly earlier than a standard 14-period RSI, which gives a small advantage in identifying momentum shifts ahead of the crowd. Bearish divergence forms when price makes a higher high but the RSI price line inside the TDI panel makes a lower high at the same time. Upside momentum is weakening even as price continues higher. A reversal or a significant pullback is more likely to follow. Bullish divergence forms when price makes a lower low but the RSI price line makes a higher low. Selling momentum is fading. The market may be preparing to reverse higher. To identify divergence on the TDI correctly, follow these steps:
  1. Identify two consecutive swing highs on the price chart (for bearish divergence) or two consecutive swing lows (for bullish divergence).
  2. Look at the corresponding swing points on the RSI price line inside the TDI panel.
  3. Compare whether the RSI is confirming the price move or moving in the opposite direction.
  4. If price and the RSI price line move in opposite directions, divergence is present.
  5. Wait for the fast signal line to cross the slow signal line before entering the divergence trade.
Divergence alone does not confirm an entry. Price can continue pushing against a divergence signal for several candles before reversing. The crossover trigger confirms that momentum has actually shifted before you commit to a position.

Common Mistakes That Produce False Signals

The TDI generates reliable signals in trending markets and noisy signals in low-momentum consolidation. Most false entries do not come from a flaw in the indicator. They come from applying it in the wrong market context or with the wrong expectations. Here are the most common TDI mistakes and how to correct each one:
  • Trading crossovers in a flat market: When the volatility bands are narrow and running nearly parallel, the market is in low-energy consolidation. Crossovers in this condition are frequent and carry no momentum behind them. Wait for the bands to widen before re-entering.
  • Ignoring the higher timeframe: An H1 buy signal during a dominant H4 downtrend will fail more often than it succeeds. Always check market structure on the higher timeframe first. The higher timeframe sets the directional bias. The lower timeframe refines the exact entry.
  • Applying traditional RSI overbought rules to the TDI: Most retail traders learn RSI as an overbought and oversold tool and carry that conditioning into the TDI. A TDI reading above 68 is a trend continuation signal, not a reversal warning. Traders who close longs at 68 or reverse at 68 consistently exit winning trades too early.
  • Entering on a midline crossover without zone confirmation: A crossover near 50 with no clear directional momentum behind it is a low-probability setup. The RSI price line needs to be above 50 for a long or below 50 for a short before the crossover carries real weight.
  • Chasing the signal after several candles: A TDI signal should be acted on at or near the close of the trigger candle. Entering multiple candles after the crossover usually means accepting a worse entry price and a risk-to-reward ratio that no longer justifies the trade.

How to Add the TDI to a Complete Trade Plan

The TDI works best as a confirmation tool layered onto a directional bias, not as a standalone system. Its role is to confirm momentum is building on the lower timeframe after the higher timeframe direction is already established. A practical TDI trade plan runs in this sequence. First, identify the dominant trend direction on the H4 chart using market structure (higher highs and higher lows for an uptrend, lower highs and lower lows for a downtrend). Second, wait for a pullback to a meaningful level on the H1 chart such as a previous support or resistance zone. Third, watch for the fast signal line to cross the slow signal line in the appropriate zone (above 50 for a long, below 50 for a short). Fourth, hold the trade while the RSI price line stays on the correct side of the 50 midline and the volatility bands remain expanded. This approach works cleanly alongside price action trading principles. Price action and market structure handle the directional bias and level identification. The TDI handles the momentum confirmation. Combining the two filters removes the low-probability midline crossovers and focuses entries on setups that have multi-timeframe agreement behind them. For traders building a broader indicator toolkit, understanding where momentum oscillators fit alongside trend and entry tools is worth examining across the best trading strategies for forex. The TDI is one of several composite oscillators that compress multiple signals into a cleaner, more readable format without losing the underlying data.

Also Read: 7 Best Trading Strategies That Actually Work in 2026

Conclusion

The Traders Dynamic Index earns its place on the chart because it compresses three layers of information into one panel without hiding any of the underlying data. The 13-period RSI provides the momentum read. The signal lines provide the entry trigger. The volatility bands provide the market context that tells you whether a signal is worth acting on. The highest-probability TDI setups form when a signal line crossover happens in the 68 and above or 32 and below zones on a chart where the higher timeframe trend is already clear and aligned. Divergence between the RSI price line and actual price adds a forward-looking layer that pure trend-following signals miss entirely. Narrow volatility bands are the clearest instruction to step aside and wait. Asia Forex Mentor has trained more than 100,000 traders across 50+ countries to build systematic, rules-based approaches to reading the market. For traders who want to see how the TDI fits inside a complete, structured trading framework, the free webinar covers how to combine momentum indicators, market structure, and key levels into high-probability setups built to hold up across changing market conditions.

Frequently Asked Questions

What Is the Traders Dynamic Index

The Traders Dynamic Index is a forex oscillator that combines a 13-period RSI (the RSI price line), a 2-period fast signal line, a 7-period slow signal line, and a 34-period Bollinger Band applied to the RSI, all displayed inside one panel. Traders use the signal line crossovers, the RSI's position within defined momentum zones, and the width of the volatility bands to read trend direction, time entries, and filter out low-probability signals. The indicator is available free as a custom download for MT4 and MT5.

What Are the Best TDI Settings

The standard TDI settings use an RSI period of 13, a volatility band period of 34, a band deviation of 1.6185, a fast MA period of 2, and a slow MA period of 7. These settings work without adjustment on H4. For H1 charts, reducing the RSI period to 8 and the band period to 21 makes the indicator more responsive to faster intraday price cycles. The fast and slow MA periods remain at 2 and 7 on both timeframes. Changing the 1.6185 deviation is rarely necessary and usually makes the bands less effective as a volatility filter.

How Do You Get a TDI Buy Signal

A TDI buy signal forms when the fast signal line (green) crosses above the slow signal line (red) while the RSI price line is above 50. The signal carries more weight when the crossover happens in the 50 to 68 zone or above 68. The strongest long setups occur when the RSI pulls back toward 50 during an established uptrend and a green-above-red crossover forms as it resumes upward, with the RSI price line pushing back toward the upper volatility band.

What Does TDI Divergence Mean

TDI divergence forms when the RSI price line inside the panel moves in the opposite direction to actual price. Bearish divergence occurs when price makes a higher high but the RSI makes a lower high, signaling that upside momentum is weakening. Bullish divergence occurs when price makes a lower low but the RSI makes a higher low, signaling that downside momentum is fading. Divergence is a warning about a weakening trend, not a standalone entry signal. Wait for the fast signal line to cross the slow signal line before entering to confirm the actual momentum shift.

Why Does the TDI Produce False Signals

The most common cause of false TDI signals is entering on signal line crossovers when the volatility bands are narrow and running flat. Narrow bands mean low momentum and a ranging market where crossovers occur frequently but produce no follow-through. The second most common cause is entering an H1 TDI signal that runs against the dominant H4 trend direction. When the higher timeframe trend is clearly bearish, H1 buy signals from the TDI will fail the majority of the time. Aligning TDI entries with the higher timeframe direction eliminates most false signal scenarios.

ezekiel chew asiaforexmentor

About Ezekiel Chew

Ezekiel Chew, founder and head of training at Asia Forex Mentor, is a renowned forex expert, frequently invited to speak at major industry events. Known for his deep market insights, Ezekiel is one of the top traders committed to supporting the trading community. Making six figures per trade, he also trains traders working in banks, fund management, and prop trading firms.

RELATED ARTICLES

Join the Live Event
Get Your Free Ticket Now

I consent to receiving emails and/or text message reminders for this event.

REGISTER FOR THE MASTERCLASS!