Singapore
 Malaysia
 Indonesia
 Philippines
 Thailand
 Vietnam
 Cambodia
 Myanmar
 Brunei
 China
China Japan
Japan South Korea
 Taiwan
 India
India Australia
  New Zealand
 United Kingdom
 Switzerland
 Italy
Italy Spain
Spain UAE
UAE United States
 Mexico
 Argentina
 South Africa
 IC Markets
 Pepperstone
 AvaTrade
 XM
XM Plus500
 RoboForex
 TMGM
TMGM Exness
 JustMarkets
 Orbex
Orbex Interactive Brokers
 Saxo
Saxo Tiger Brokers
 Binance
 Coinbase
 Gemini Exchange
 Kraken
 iFunds
 IC Funded
 The 5%ers
 TopStep
 IQ Option
 Pocket Option
 RaceOption
 IQCent
Recognizing the head and shoulders pattern and trading it correctly are two entirely different skills. Most forex traders who spot the formation still end up stopped out before the move begins. The pattern appears in virtually every technical analysis curriculum and across all forex pairs and timeframes, yet the entry mistakes traders make are consistent and preventable.
|
ABOUT THIS GUIDE |
This guide covers both the standard bearish head and shoulders and the inverse bullish version in one place. You will learn how to draw the neckline correctly, apply precise entry and retest rules, use volume as a confirmation filter, and calculate your pip target with one formula. |
|
QUICK ANSWER |
The head and shoulders pattern is a three-peak chart formation that signals a trend reversal. The standard version, with the middle peak highest, signals a bearish reversal at the end of an uptrend. The inverse version, with the middle trough deepest, signals a bullish reversal at the end of a downtrend. A confirmed breakout requires a candle close through the neckline, not a wick pierce. |
What Is the Head and Shoulders Pattern
The head and shoulders pattern is a three-peak formation that appears at the end of a trend and signals fading directional momentum. Two smaller peaks (the shoulders) flank one larger peak (the head). The line connecting the two reaction lows between them is the neckline. The neckline is the trigger. Without a confirmed close through it, there is no valid trade setup.
The pattern comes in two versions. Each one tells a different story about which side of the market is losing control.
| Feature | Standard Head and Shoulders | Inverse Head and Shoulders |
|---|---|---|
| Forms During | Uptrend | Downtrend |
| Shape | Three peaks, middle highest | Three troughs, middle deepest |
| Signal | Bearish reversal | Bullish reversal |
| Neckline Connects | Two reaction lows | Two reaction highs |
| Confirmed By | Close below neckline | Close above neckline |
| Stop Loss Reference | Top of right shoulder | Bottom of right shoulder |
Both versions share the same underlying logic. In the standard version, buyers are making progressively weaker highs. Sellers are stepping in earlier each time. In the inverse version, sellers are making progressively shallower lows. Buyers are gaining control from below.
The pattern works across all forex pairs and all timeframes. A formation on the daily chart carries far more weight than the same shape on the 15-minute chart. Daily and weekly versions capture more price history and are watched by a wider pool of market participants. Understanding price action trading gives traders the context to read these formations accurately rather than just recognizing the shape.
The Standard Bearish Head and Shoulders
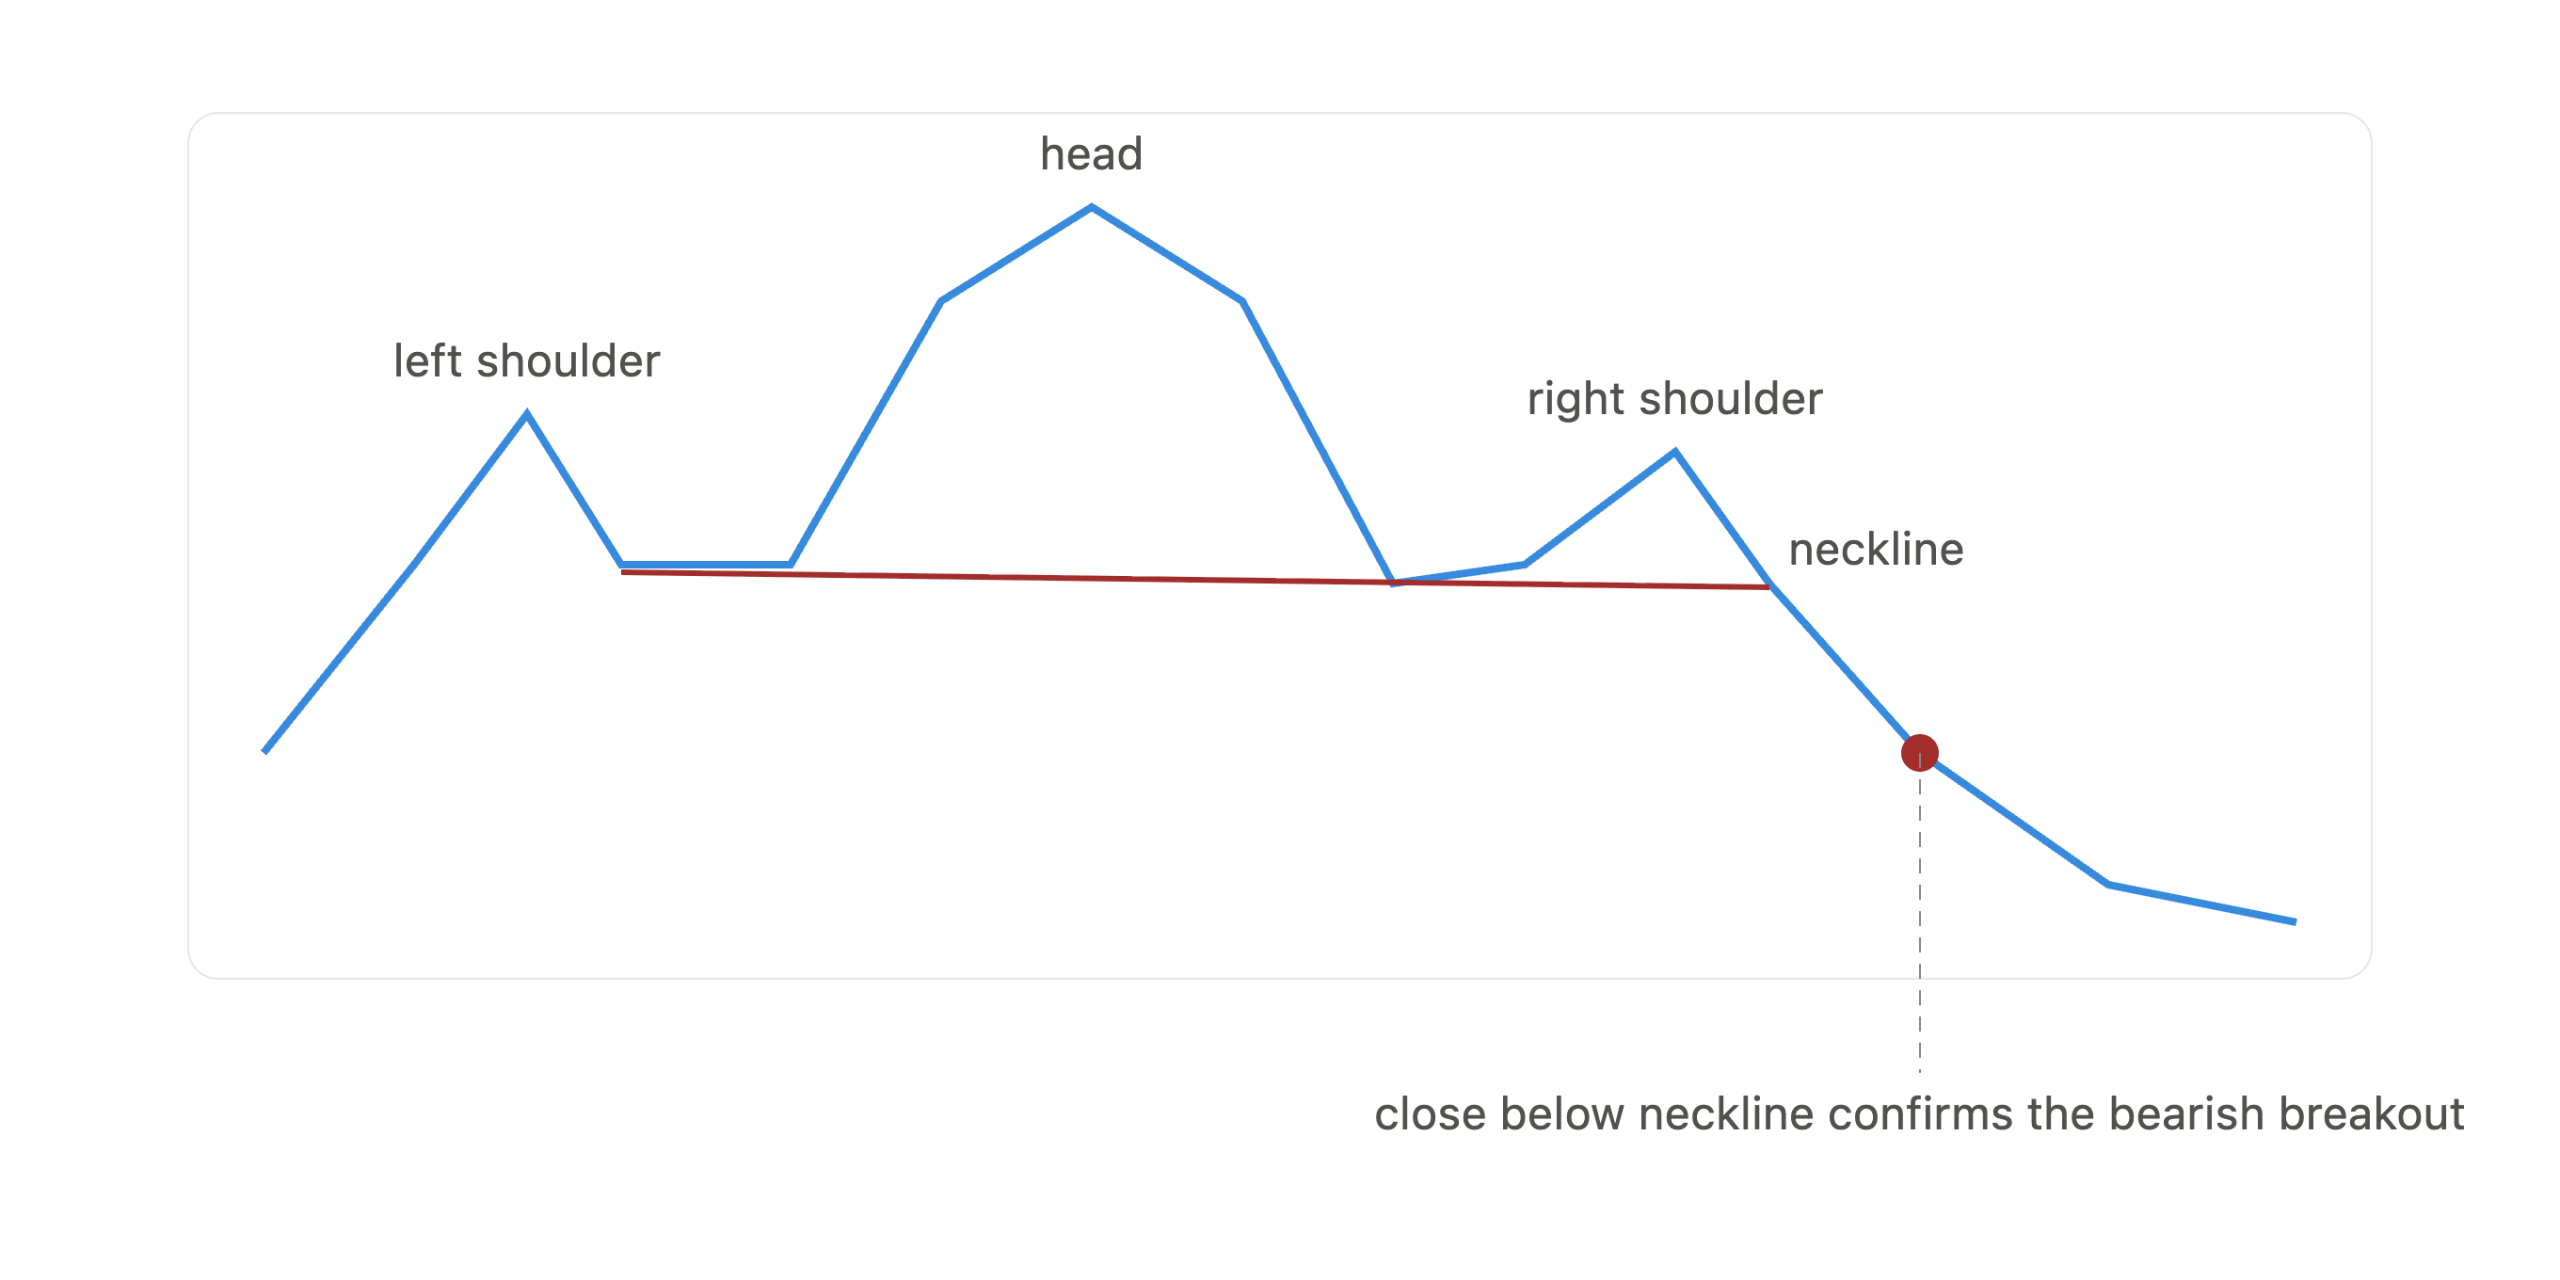
The standard head and shoulders forms during a sustained uptrend. Price makes a high (the left shoulder), pulls back to a swing low, rallies to a higher high (the head), pulls back to a second swing low, then attempts one more rally that fails to reach the head before reversing (the right shoulder). The two swing lows between the three peaks form the neckline.
Here is how the three components appear in practice:
- Left shoulder: Price peaks after a strong rally and retraces to a defined swing low.
- Head: Price rallies above the left shoulder high, makes a new high, then retraces to a second swing low near the first.
- Right shoulder: Price attempts another rally but stalls below the head, then begins to fall.
The psychology behind the standard version is why it works. Buyers push the market to new highs twice (left shoulder and head) but on the third attempt they cannot sustain momentum. Sellers are entering the market at lower and lower points. By the time the right shoulder completes, the balance of power has shifted decisively.
The pattern is confirmed only when price closes a full candle body below the neckline. A wick that crosses the neckline and closes back above it is a failed test, not a signal. Traders who act on wicks consistently get trapped by price reversals before the real breakout materializes.
The Inverse Bullish Head and Shoulders
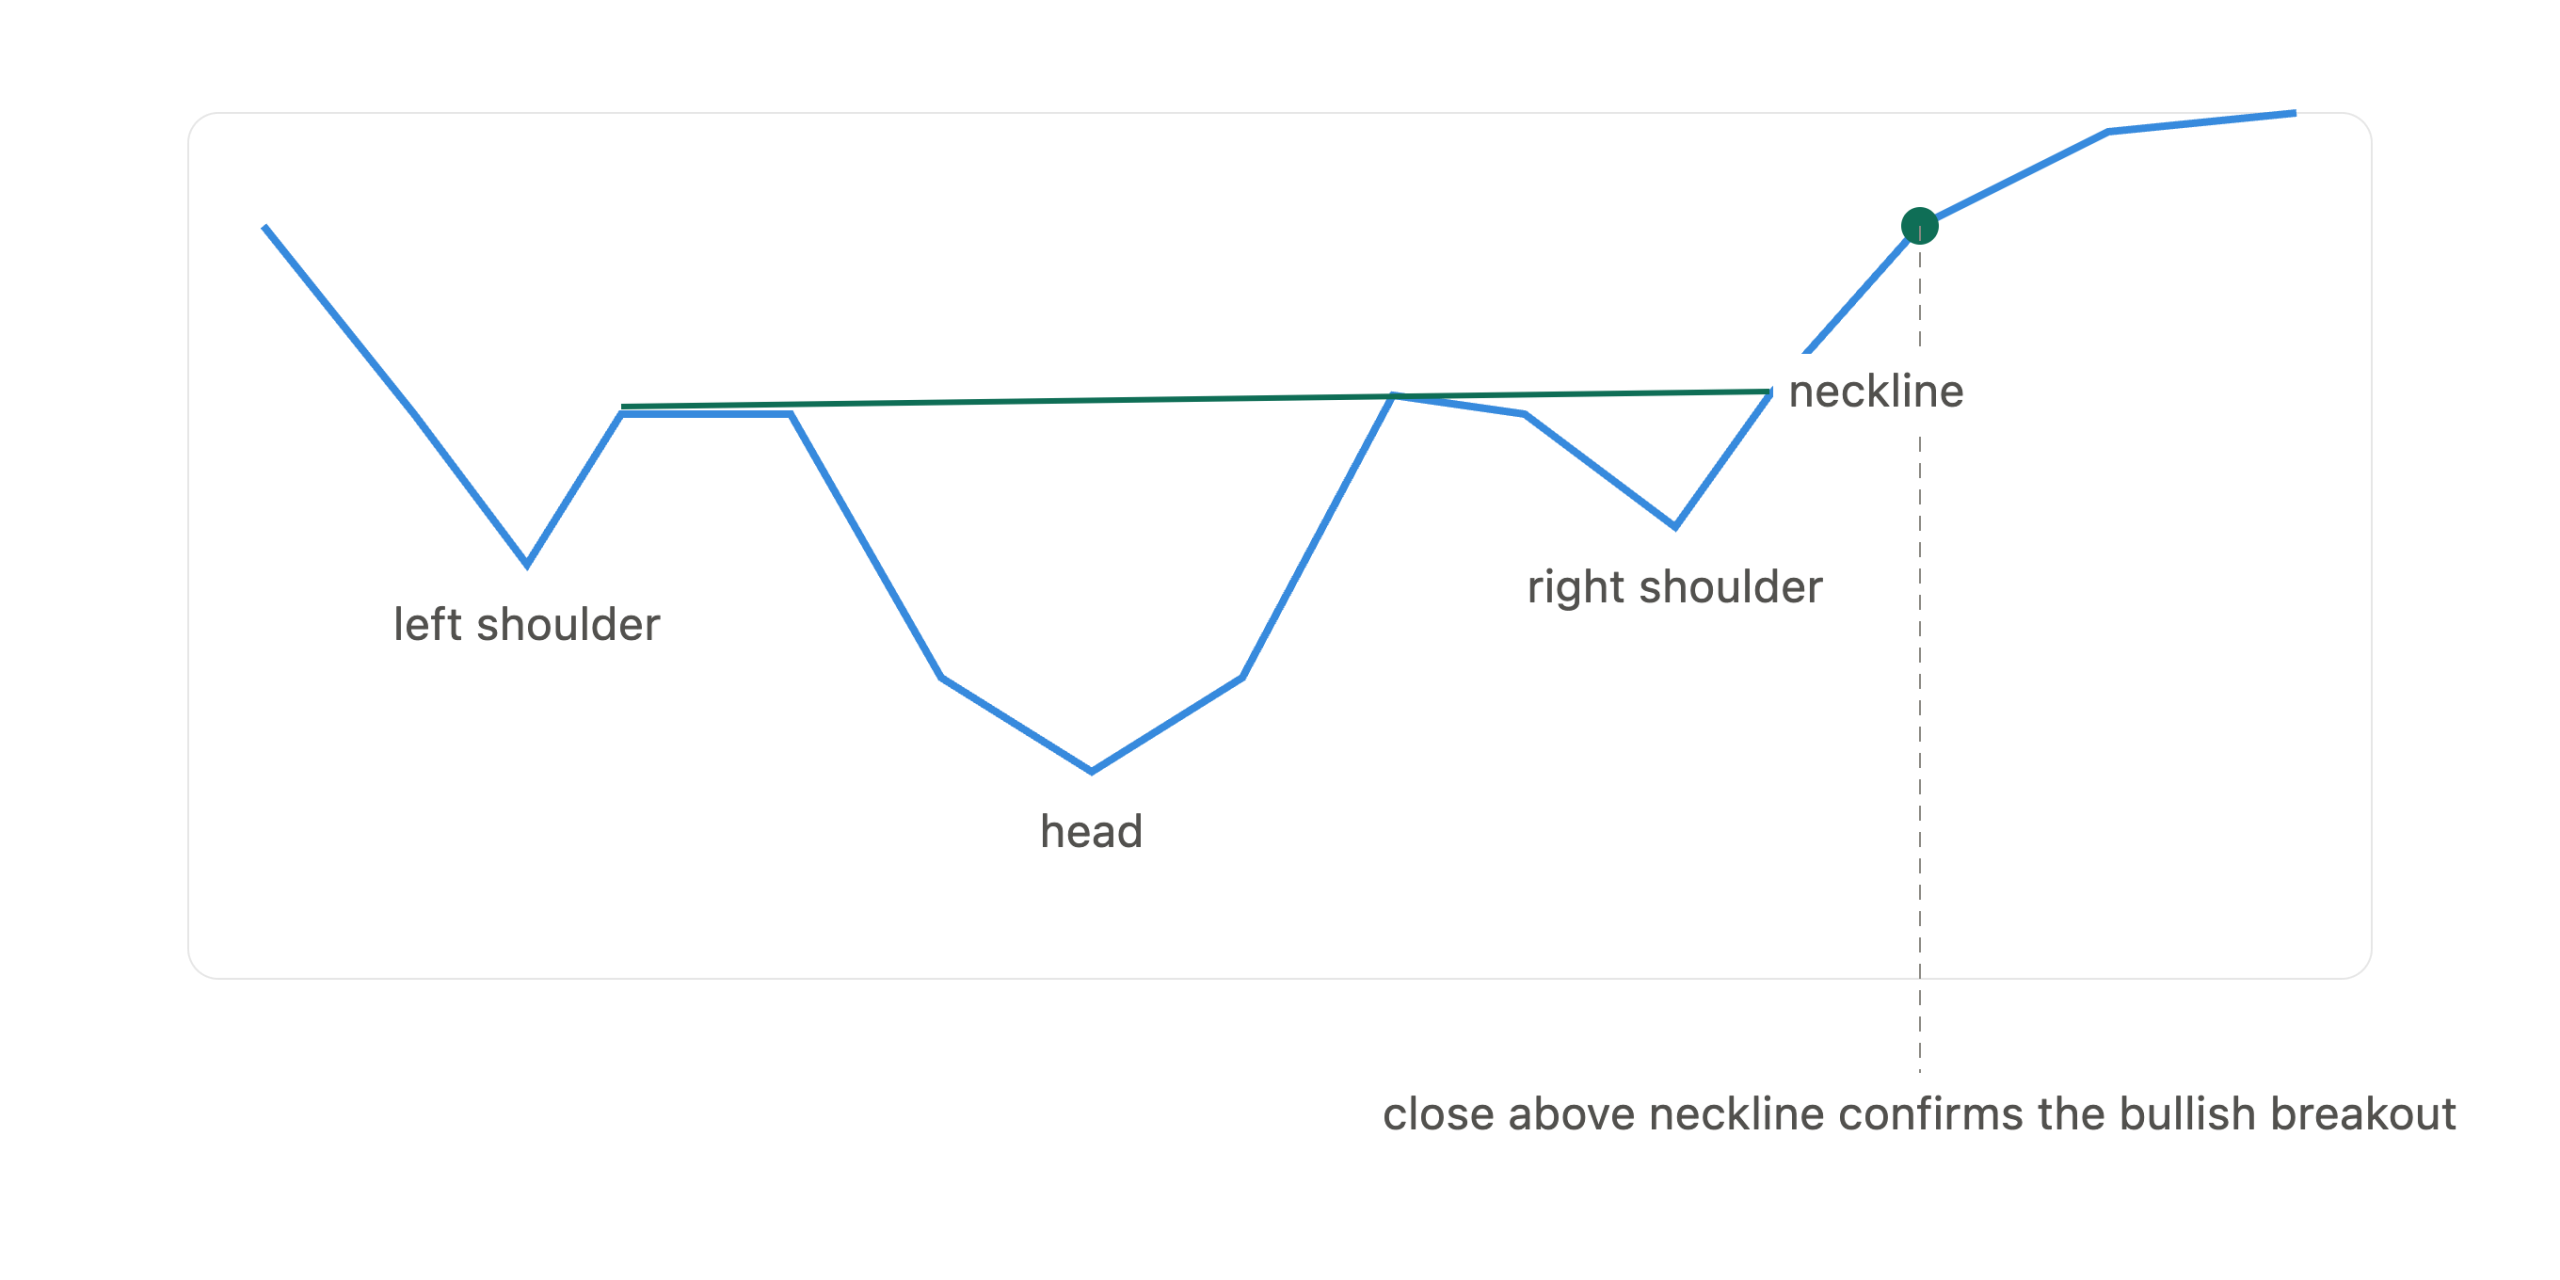
The inverse head and shoulders is the mirror image of the standard version. It forms during a downtrend. Price makes a low (left shoulder), bounces to a swing high, falls to a lower low (the head), bounces again to a second swing high, then makes one more low that holds above the head before reversing upward (the right shoulder).
Here is the structure of the inverse version:
- Left shoulder: Price makes a low during the downtrend and bounces upward.
- Head: Price falls below the left shoulder low to the deepest point of the pattern, then bounces to a swing high.
- Right shoulder: Price drops again but holds above the head’s low, then reverses upward.
The inverse pattern signals that sellers are running out of power. Each successive low fails to push deeper. Each bounce lifts from a higher floor. The two bounce highs between the three troughs define the neckline, and a close above it confirms the bullish reversal.
How to Draw the Neckline Correctly
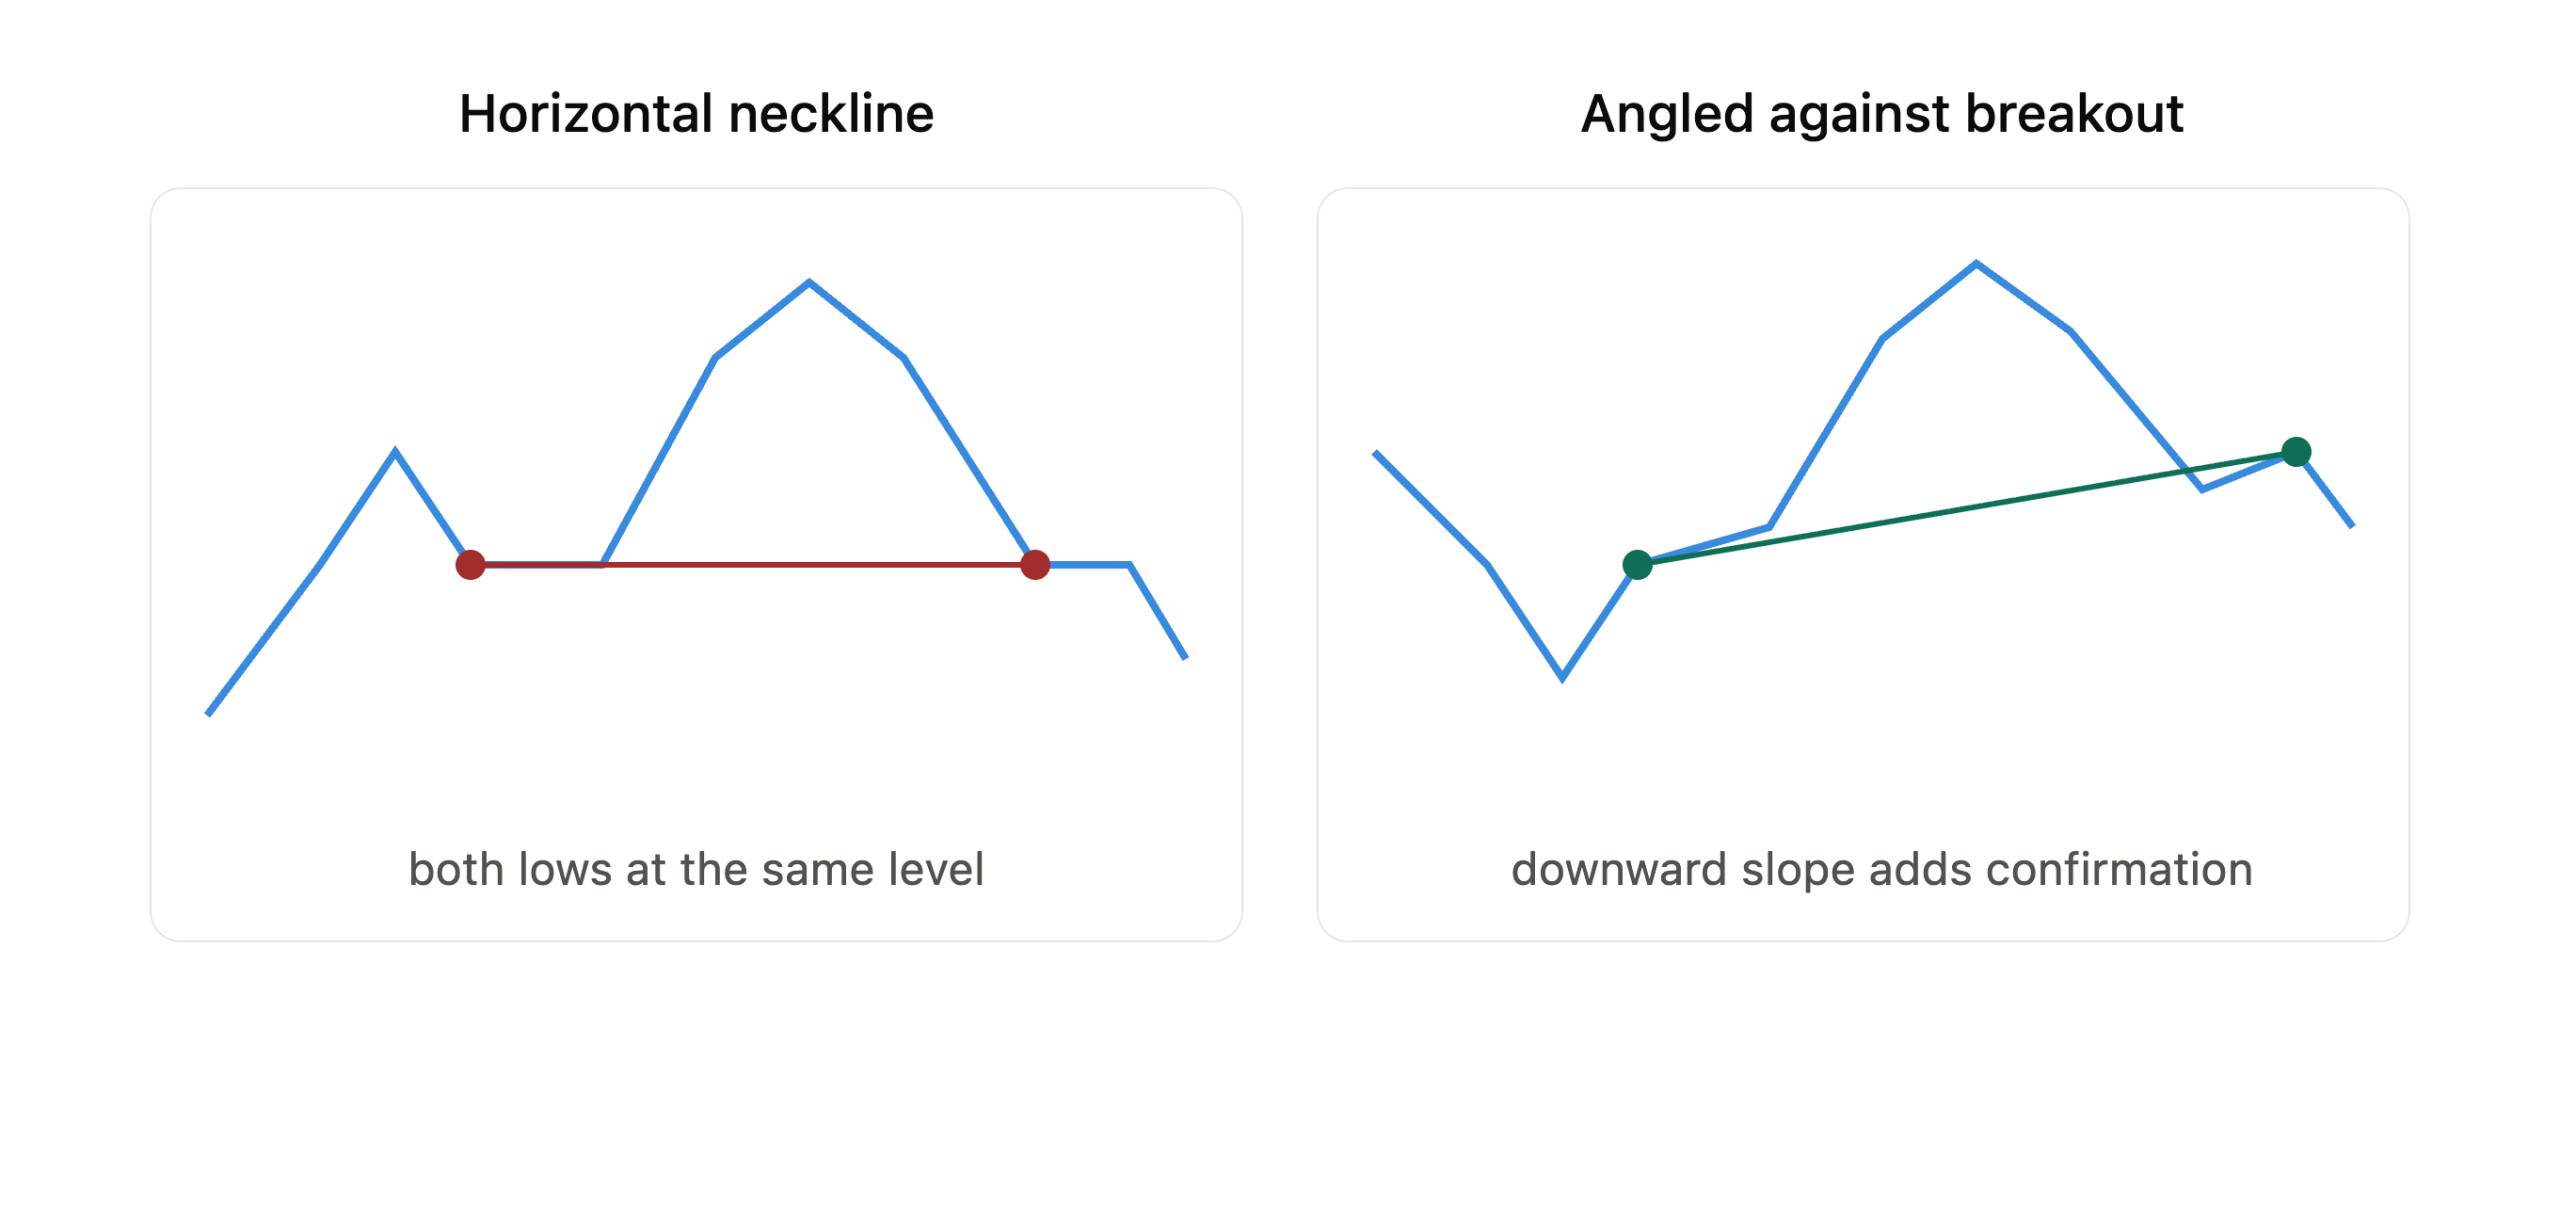
The neckline is the most critical line in the entire pattern. Drawing it incorrectly produces the wrong entry level, the wrong target, and the wrong stop placement. This step is where precision matters most.
- For the standard (bearish) version: Connect the swing low between the left shoulder and the head to the swing low between the head and the right shoulder. Draw a straight line through both points and extend it to the right.
- For the inverse (bullish) version: Connect the swing high between the left shoulder and the head to the swing high between the head and the right shoulder. Draw a straight line through both points and extend it to the right.
Three things to know about the neckline angle:
- Horizontal neckline: The most common version. Both reaction points are at the same price level.
- Slightly angled neckline: Perfectly valid. A small upward or downward slope does not disqualify the pattern.
- Neckline angled against the breakout direction: This actually strengthens the signal. A downward-sloping neckline on an inverse head and shoulders shows sellers in control even during the bounces. Breaking above it carries extra confirmation weight.
The neckline’s significance comes from what it represents. It marks a specific price level where buyers or sellers have twice agreed to reverse direction. When price breaks through that same level on the third approach, previous participants who reversed there are now trapped on the wrong side of the trade.
Entry Rules, Retest, and Stop Loss
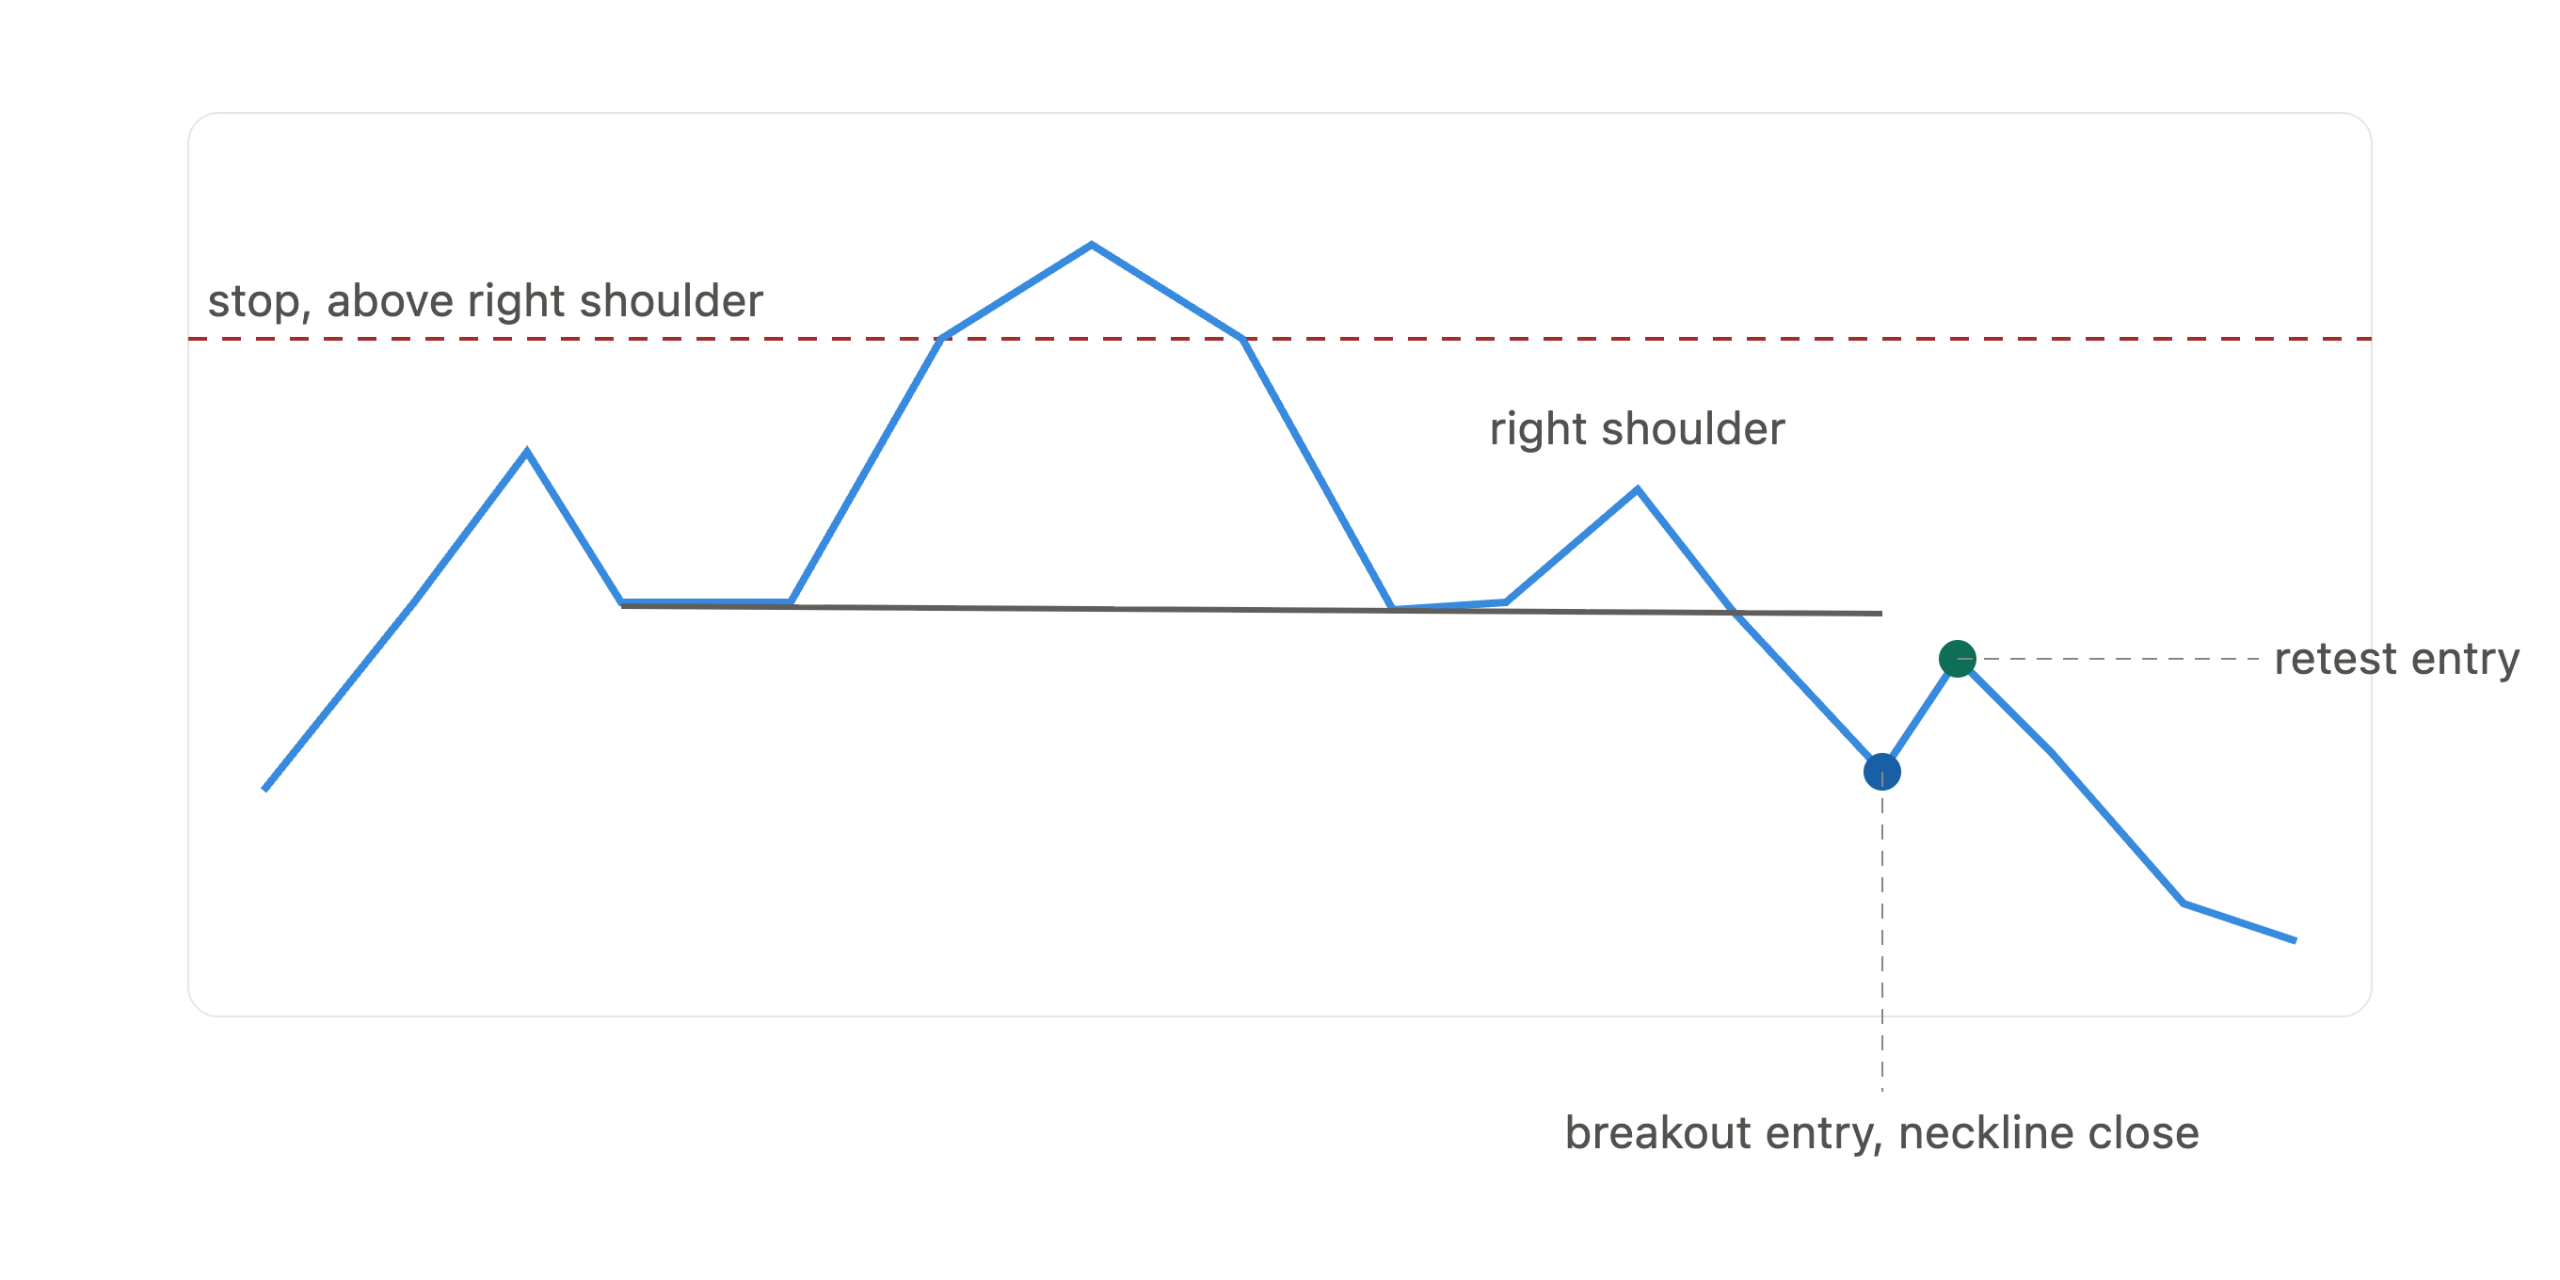
Two entry approaches work for this pattern. The right choice depends on whether you prioritize catching the full move or reducing the risk of a false breakout.
Entry Method 1: Breakout entry
Enter as soon as price closes a full candle body through the neckline. For the standard version, this means a bearish close below the neckline. For the inverse version, this means a bullish close above the neckline. This approach captures the move early but carries higher false-breakout risk.
Entry Method 2: Retest entry
Wait for price to break the neckline, then pull back and test it from the other side. When price rejects the neckline on the retest, enter in the direction of the breakout. This is the higher-probability approach. The neckline has now flipped its role: from support to resistance in the standard version, from resistance to support in the inverse version. The trade-off is giving up part of the initial move.
Stop loss placement follows the same rule for both methods:
- Standard H&S: Stop goes just above the right shoulder high. That is the last level where buyers showed strength before the pattern completed.
- Inverse H&S: Stop goes just below the right shoulder low. That is the last level where sellers showed strength before the pattern completed.
Placing the stop at the neckline is too tight. The neckline is the breakout level, not the invalidation level. Placing the stop at the head’s extreme gives up too much capital relative to the probability of success. The right shoulder is the correct reference every time.
How Volume Confirms a Valid Breakout
Volume is the single best filter for separating a genuine neckline breakout from a false one. The pattern has a predictable volume signature that traders can read before committing to a position.
In a valid standard head and shoulders, volume typically follows this sequence:
- Left shoulder rally: Strong volume accompanies the push to the left shoulder high.
- Head rally: Volume decreases compared to the left shoulder. Price goes higher but buying pressure is already weaker.
- Right shoulder rally: Volume is lower still. Buyers are giving up.
- Neckline breakout: Volume spikes sharply as sellers step in with real conviction.
A neckline break that happens on light or average volume is a warning sign. Without volume expansion on the breakout candle, sellers lack the conviction to sustain the move. These low-volume breaks frequently pull back, trap bearish traders, and then reverse. They are false breakouts.
The same principle applies in reverse for the inverse version. Look for declining volume across the three troughs and then a clear volume surge on the bullish neckline breakout.
In spot forex, exchange volume is not directly available. Traders use tick volume (the count of price changes per bar) as a proxy. Tick volume correlates strongly with institutional activity on liquid major pairs such as EUR/USD, GBP/USD, and USD/JPY, making it a reliable confirmation filter even without centralized exchange data.
The Pip Target Formula
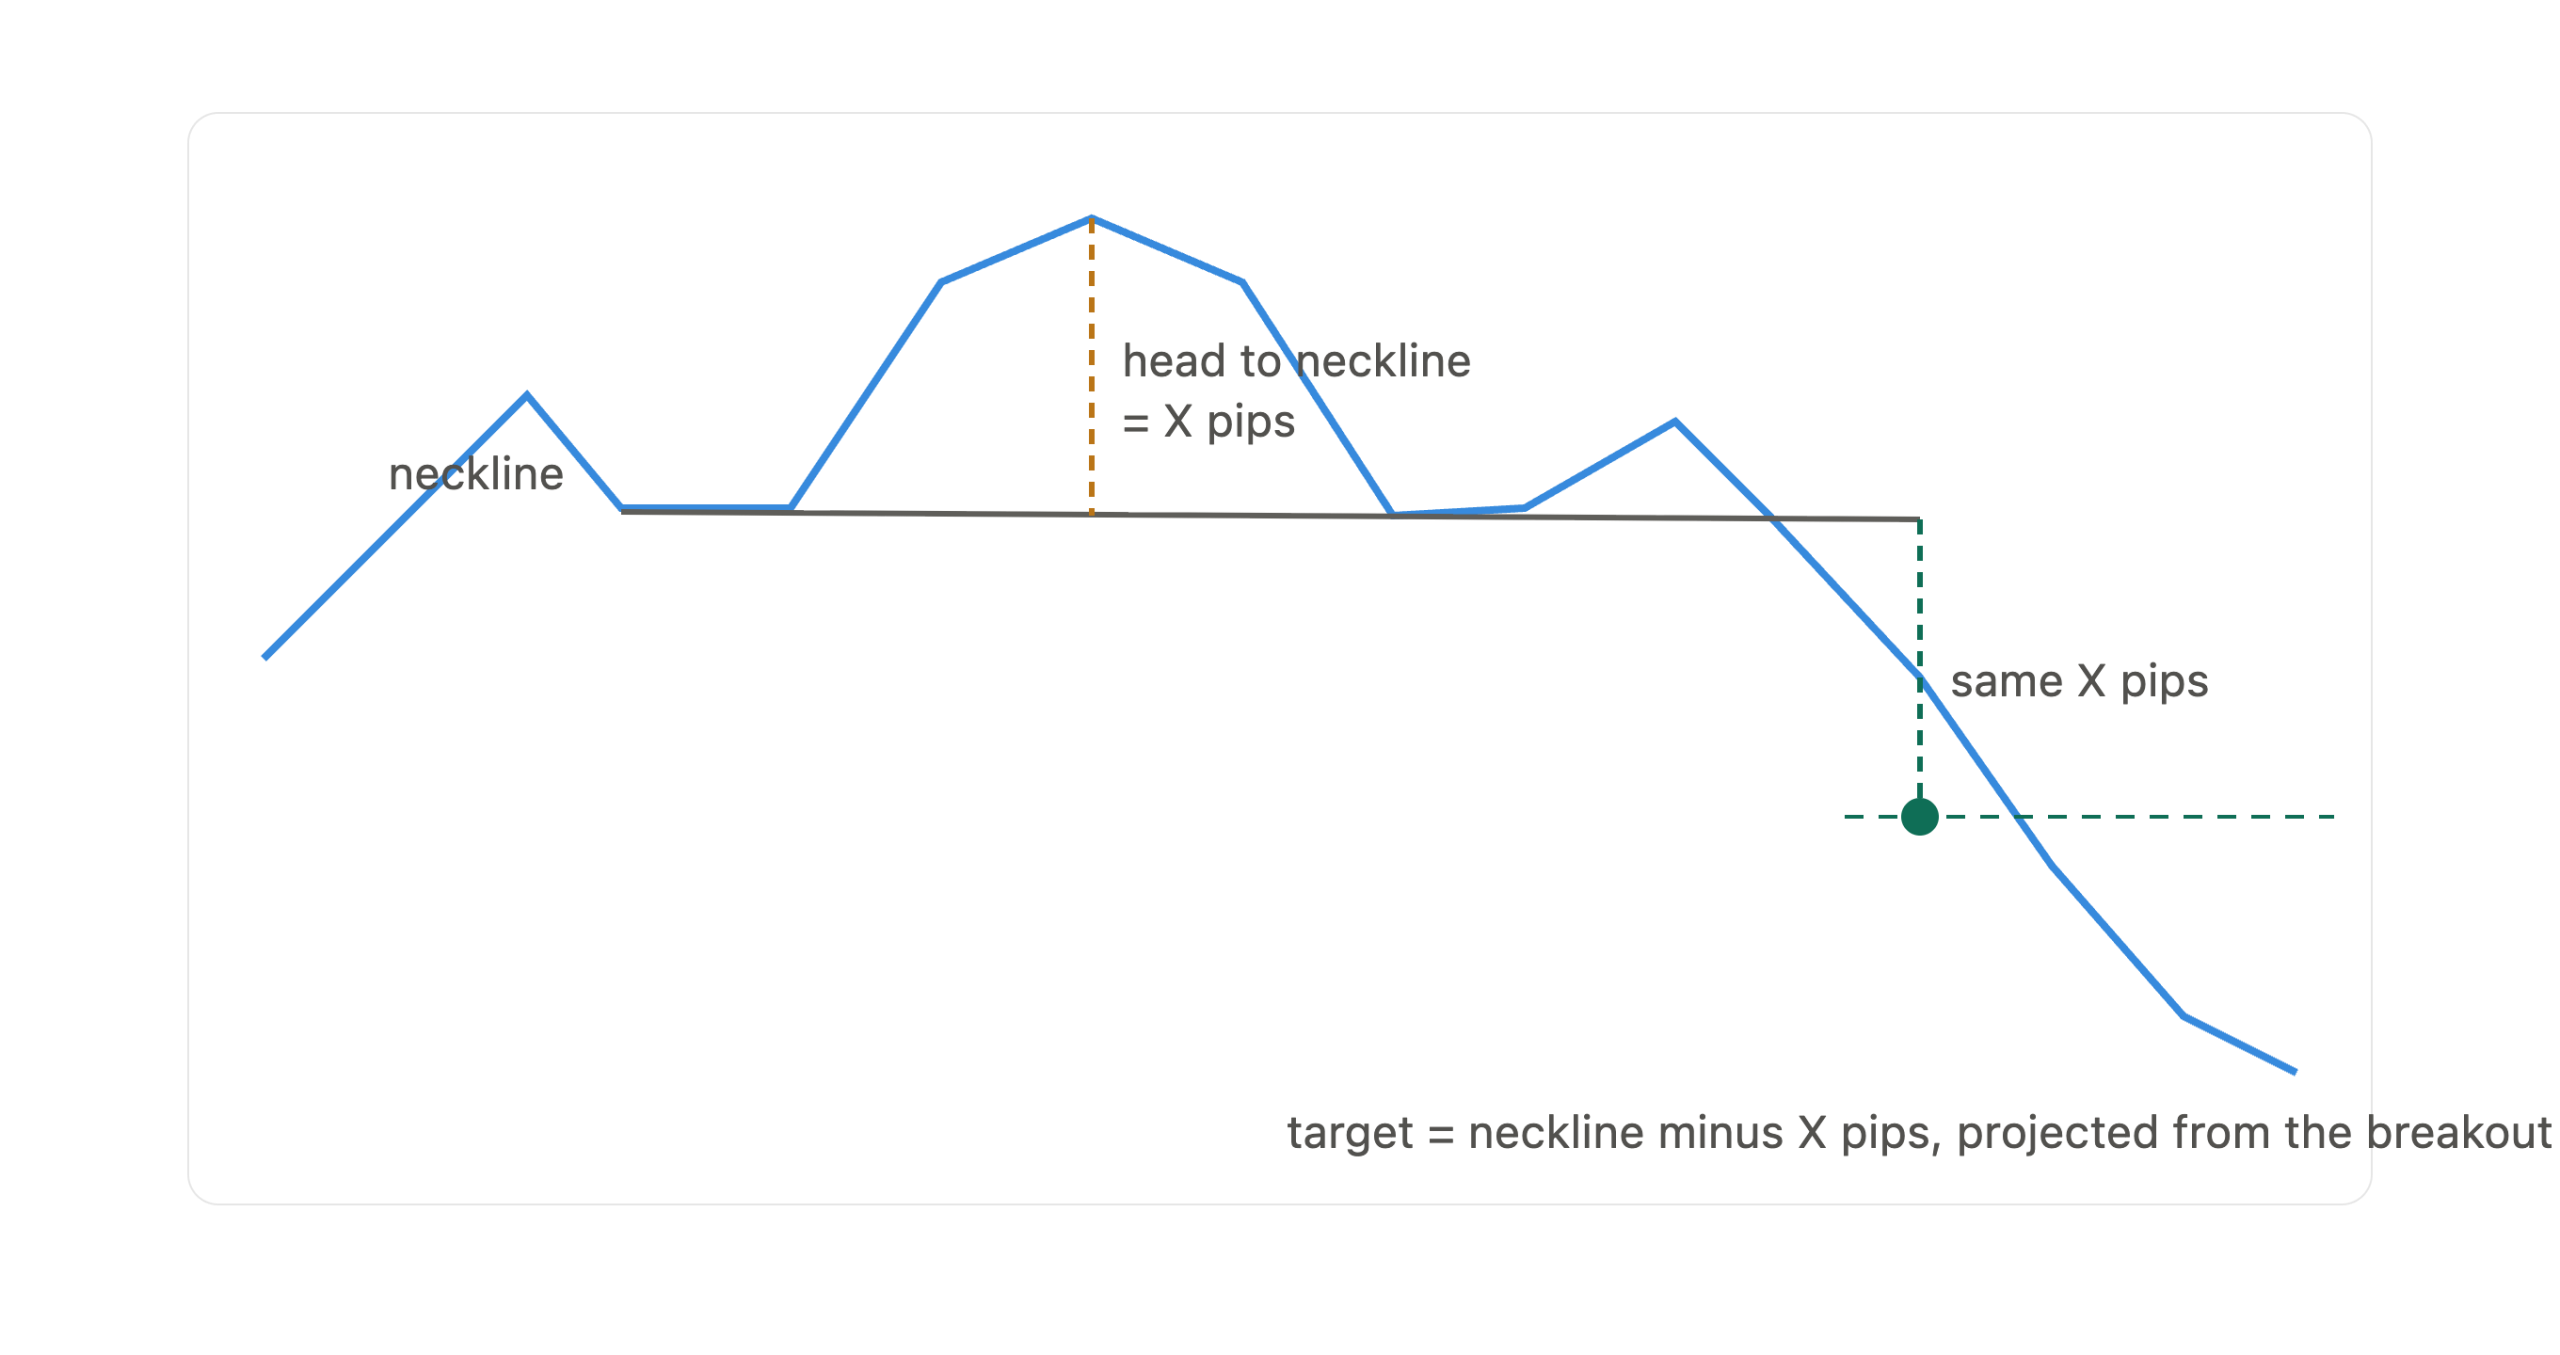
The pip target uses one measurement as the basis for both versions of the pattern.
Standard (bearish) target calculation:
- Find the top of the head, the highest point of the pattern.
- Measure the vertical distance in pips from the head’s peak straight down to the neckline at that horizontal point.
- Subtract that pip distance from the neckline price at the breakout point.
Inverse (bullish) target calculation:
- Find the bottom of the head, the lowest point of the pattern.
- Measure the vertical distance in pips from the head’s trough straight up to the neckline at that horizontal point.
- Add that pip distance to the neckline price at the breakout point.
This distance is a minimum target projection. It gives you a mathematically grounded objective based on the pattern’s own structure, not on guesswork.
Traders apply this target in two practical ways. First, take full profit when price reaches the target level. Second, take partial profit at the target and trail the remaining position using a swing low (for bearish trades) or a trailing moving average. The second approach captures more of an extended move without surrendering all realized gains if price reverses before a secondary target.
Two Chart Examples
Standard Head and Shoulders on EUR/USD 4H Chart
Consider a EUR/USD setup where price has been in a multi-week uptrend. Price forms a left shoulder at 1.0950, retraces to 1.0820, rallies to form the head at 1.1050, retraces to 1.0830, then forms a right shoulder at 1.0960 before rolling over.
The neckline connects the two retracement lows at approximately 1.0820 and 1.0830. The slight upward angle is valid.
Applying the target formula: the head at 1.1050 sits 220 pips above the neckline at 1.0830. When price closes a 4-hour candle below the neckline at 1.0825, the target becomes 1.0825 minus 220 pips, giving a minimum objective of 1.0605.
A retest entry forms if price pulls back toward 1.0825 to 1.0840 before continuing lower. A stop above the right shoulder high at 1.0970 defines the risk. The resulting risk-to-reward ratio is clearly defined before the trade begins.
Inverse Head and Shoulders on GBP/USD Daily Chart
Consider a GBP/USD setup where price has been in a multi-month downtrend. Price forms a left shoulder low at 1.2300, bounces to 1.2500, drops to a head low at 1.2150, bounces again to 1.2490, then forms a right shoulder low at 1.2280 before turning upward.
The neckline connects the two bounce highs at approximately 1.2500 and 1.2490. The very slight downward angle adds strength to the bullish signal, because it shows sellers dominated even during the recovery bounces.
Applying the target formula: the head at 1.2150 sits 340 pips below the neckline at 1.2490. When a daily candle closes above the neckline at 1.2495, the minimum target becomes 1.2495 plus 340 pips, giving 1.2835.
A stop below the right shoulder low at 1.2270 defines the maximum risk on the trade. A retest of the broken neckline near 1.2490 offers a lower-risk second entry before price continues toward the target.
Common Mistakes That Cause False Breakouts
Traders lose money on this pattern for a consistent set of reasons. Knowing them in advance removes the most common sources of failure.
Entering on a wick instead of a close. A candlestick wick piercing the neckline is not a confirmed breakout. Wait for a full candle body to close on the other side. Wicks that cross and close back are failed tests. Traders who act on wicks get trapped by the subsequent reversal.
Skipping volume confirmation. A neckline break on weak or average tick volume is the most reliable early warning of a false move. If tick volume does not expand noticeably on the breakout candle, wait for a retest entry before committing capital. Volume is not optional confirmation. It is the difference between a real breakout and a trap.
Wrong stop placement. Setting the stop at the neckline leaves no room for a retest and produces unnecessary losses on normal price oscillation. Setting the stop at the head’s peak or trough surrenders too much capital. The right shoulder is the correct and only logical stop reference for this pattern.
Trading against the higher timeframe trend. A head and shoulders on the 1-hour chart that runs counter to the daily or 4-hour direction has a substantially lower probability of completing cleanly. Applying a top-down analysis approach filters out low-quality setups by requiring the pattern to align with or mark the confirmed end of the dominant higher timeframe structure.
Misidentifying the neckline. Connecting the wrong swing points produces a neckline that is too steep, too flat, or simply wrong. The neckline must connect exactly the two reaction lows (standard version) or two reaction highs (inverse version) between the three peaks or troughs. Being off by even a few candles shifts the entry and target levels enough to change the trade’s outcome.
Forcing the pattern. Not every three-peak formation qualifies. In the standard version, the right shoulder must peak below the head. In the inverse version, the right shoulder must trough above the head’s low. If either condition is not met, no pattern exists and there is no trade. For a foundational overview of reading forex charts before applying patterns live, that reference builds the chart-reading base this pattern depends on.
Also Read: Top Down Analysis and Why Most Traders Still Get It Wrong
Conclusion
The head and shoulders pattern is one of the most recognizable reversal formations in forex. But recognition is only the starting point. The real edge comes from applying a confirmed neckline close as the trigger, using volume to separate genuine breakouts from false ones, placing the stop at the right shoulder rather than the neckline, and calculating the minimum target with the pip formula before the trade begins.
The retest entry gives traders a second, higher-probability window to enter with a tighter stop. The pip target formula gives every trade a structured minimum objective grounded in the pattern’s own dimensions. Together, these rules turn a familiar chart shape into a repeatable, rules-based process.
Frequently Asked Questions
What is the difference between the standard and inverse head and shoulders?
The standard head and shoulders forms during an uptrend and signals a bearish reversal. The inverse head and shoulders forms during a downtrend and signals a bullish reversal. Both use the same three-peak or three-trough structure and the same neckline breakout logic. The direction of the anticipated move is opposite: the standard version is bearish and the inverse is bullish.
How do you draw the head and shoulders neckline correctly?
For the standard version, connect the swing low between the left shoulder and the head to the swing low between the head and the right shoulder. For the inverse version, connect the swing high between the left shoulder and the head to the swing high between the head and the right shoulder. Extend the line to the right and use it as the breakout trigger for both entry and target calculation.
What is the head and shoulders pip target formula?
Measure the vertical distance in pips from the top of the head straight down to the neckline at that horizontal point. For the standard version, subtract that number from the neckline price at the breakout point. For the inverse version, add that number to the neckline price at the breakout point. The result is the minimum expected price move after the confirmed breakout.
Should you enter at the neckline break or wait for a retest?
Both approaches produce valid entries. Entering at the confirmed neckline close captures the move earlier but accepts a higher false-breakout risk. Waiting for price to retest the broken neckline from the other side gives a higher-probability entry with a tighter stop distance, at the cost of missing part of the initial move. For traders new to this pattern, the retest entry is the lower-risk starting point.
What role does volume play in confirming the head and shoulders breakout?
Valid patterns typically show declining volume from left shoulder to head to right shoulder, followed by a sharp volume spike on the neckline breakout. A breakout on weak or average volume warns that the move may not follow through and frequently precedes a false breakout. In spot forex, tick volume serves as the practical substitute for real exchange volume and is a reliable filter on major pairs.