English
 简体中文
简体中文 繁體中文
繁體中文 日本語
日本語 한국어
한국어 Bahasa Melayu
 Bahasa Indonesia
 Filipino
 ไทย
ไทย Tiếng Việt
 हिन्दी
 العربية
 Italiano
 Português
 Русский
 Español
 Français
 Singapore
 Cambodia
 Myanmar
 Brunei
 Australia
  New Zealand
 Switzerland
 UAE
UAE United States
 Mexico
 Argentina
 South Africa
 IC Markets
 Pepperstone
 AvaTrade
 XM
XM Plus500
 RoboForex
 TMGM
TMGM Exness
 JustMarkets
 Orbex
Orbex Interactive Brokers
 Saxo
Saxo Tiger Brokers
 Binance
 Coinbase
 Gemini Exchange
 Kraken
 iFunds
 IC Funded
 The 5%ers
 TopStep
 IQ Option
 Pocket Option
 RaceOption
 IQCent
Most traders drawing trend lines in trading are connecting random price points and calling it technical analysis, which is why their supposed support turns into thin air the moment price actually touches it.
|
ABOUT THIS GUIDE |
This guide covers the institutional method for drawing valid trend lines in forex. It explains how to identify genuine swing points, confirm a line through repeated touches, judge whether a line’s angle is sustainable, and use candlestick behavior to tell a real break from a false one. |
|
QUICK ANSWER |
A valid trend line in trading connects at least two confirmed swing highs or swing lows, with a third touch confirming real structural strength. The angle should sit between 30 and 60 degrees to remain sustainable over time. Breakout confirmation requires a full candlestick close beyond the line, not just a wick breach. . |
What Makes a Trend Line Valid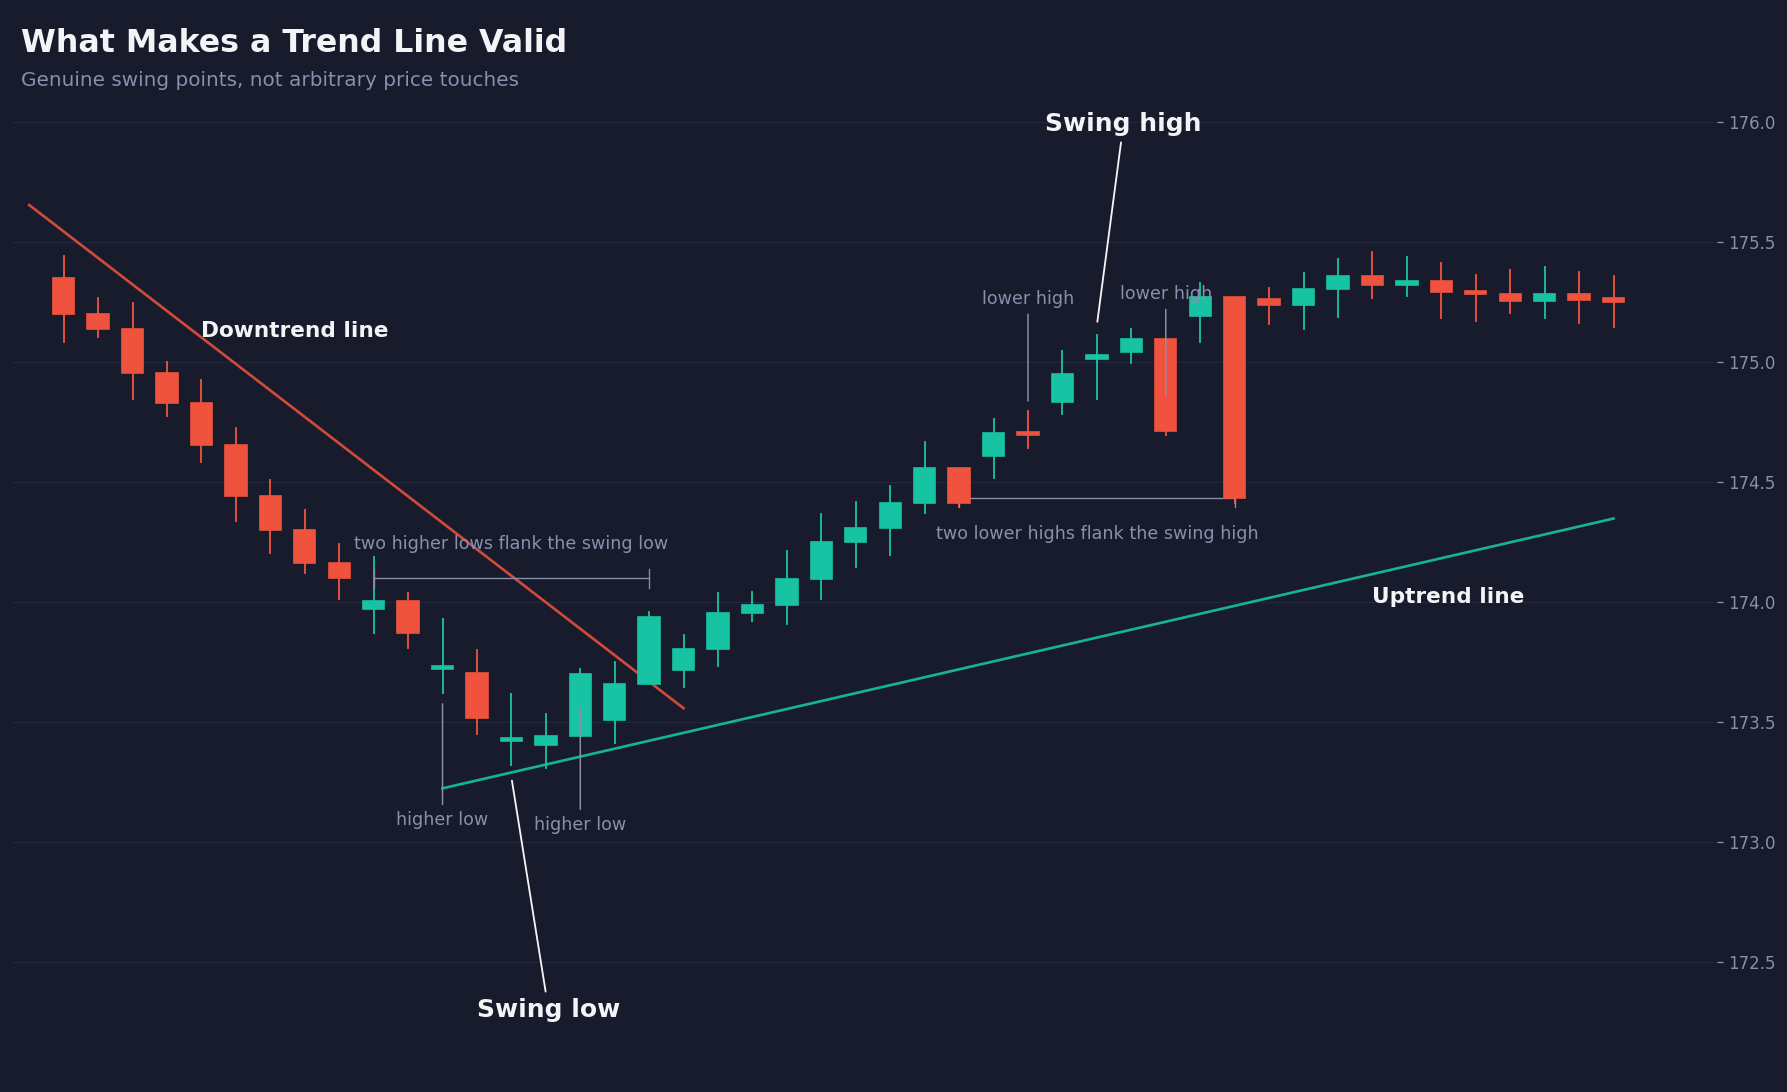
A trend line is only as reliable as the swing points it connects. Most retail traders draw a line between any two price points that look clean on a chart, but that is not how institutional traders work. Genuine swing points are the foundation. Without them, the line carries no structural meaning and will not hold when price returns to it.
Swing highs and swing lows are the turning points where price reversed with clear purpose. A valid swing high shows at least two lower highs on either side of the peak. A valid swing low shows at least two higher lows on either side of the trough. These are not arbitrary wicks inside a noisy consolidation zone. They are confirmed structural pivots where buyers or sellers took decisive control and pushed price in the opposite direction.
Minimum Touches and Why They Matter
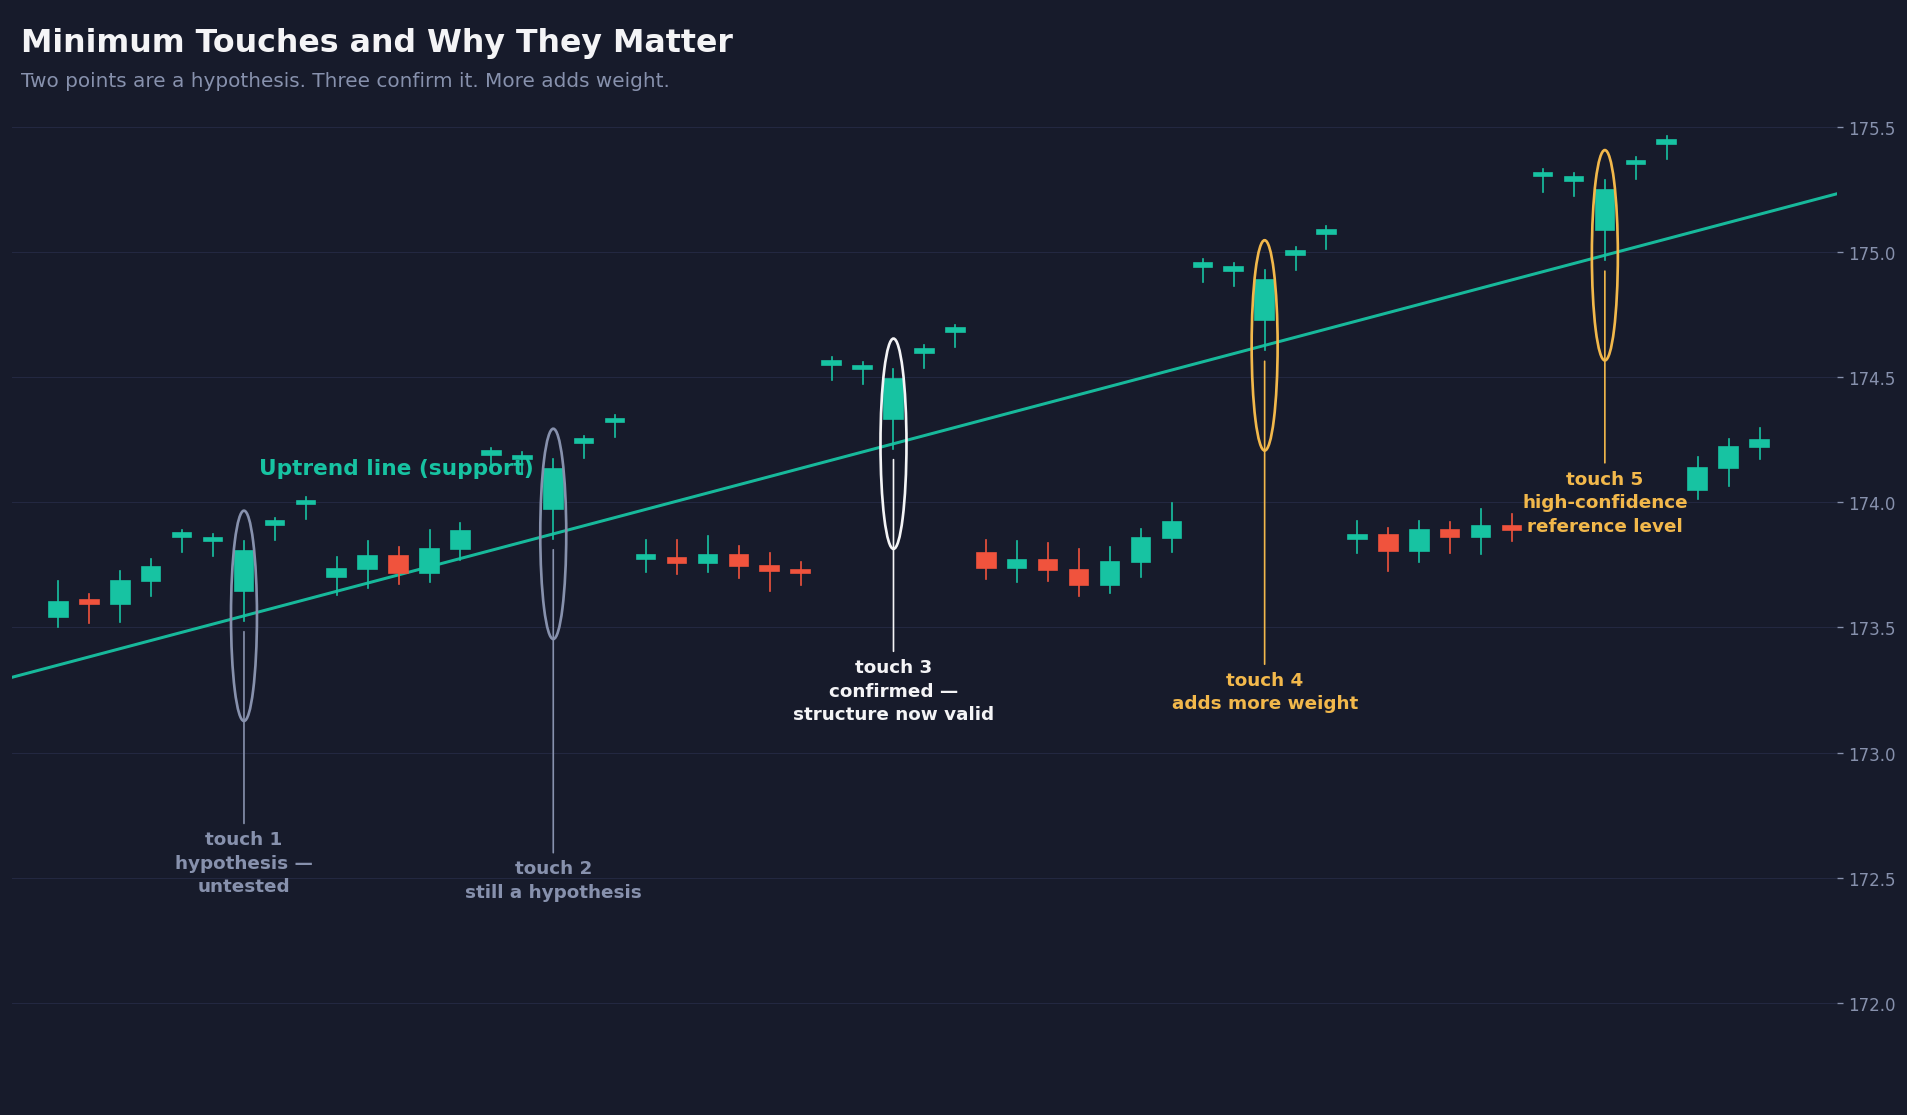
Two points define a line. Three points confirm it. With two touches alone, traders have a hypothesis that has never been tested under real market conditions. A third touch, where price returns to the line and reacts with clear rejection or a bounce, transforms that hypothesis into a structure worth trading. Asia Forex Mentor has trained more than 100,000 traders across 50+ countries, and the most consistent feedback from students who struggled with trend lines is the same: they acted on two-touch lines that had never earned a third confirmation.
The more times price touches and respects a trend line, the more valid it becomes as a trading reference. A line with five confirmed touches over several weeks carries far more weight than a two-touch line drawn over three days. Market participants accumulate orders around these levels across multiple sessions, which is exactly what makes the line hold under pressure.
Wicks vs Closes on the Trend Line
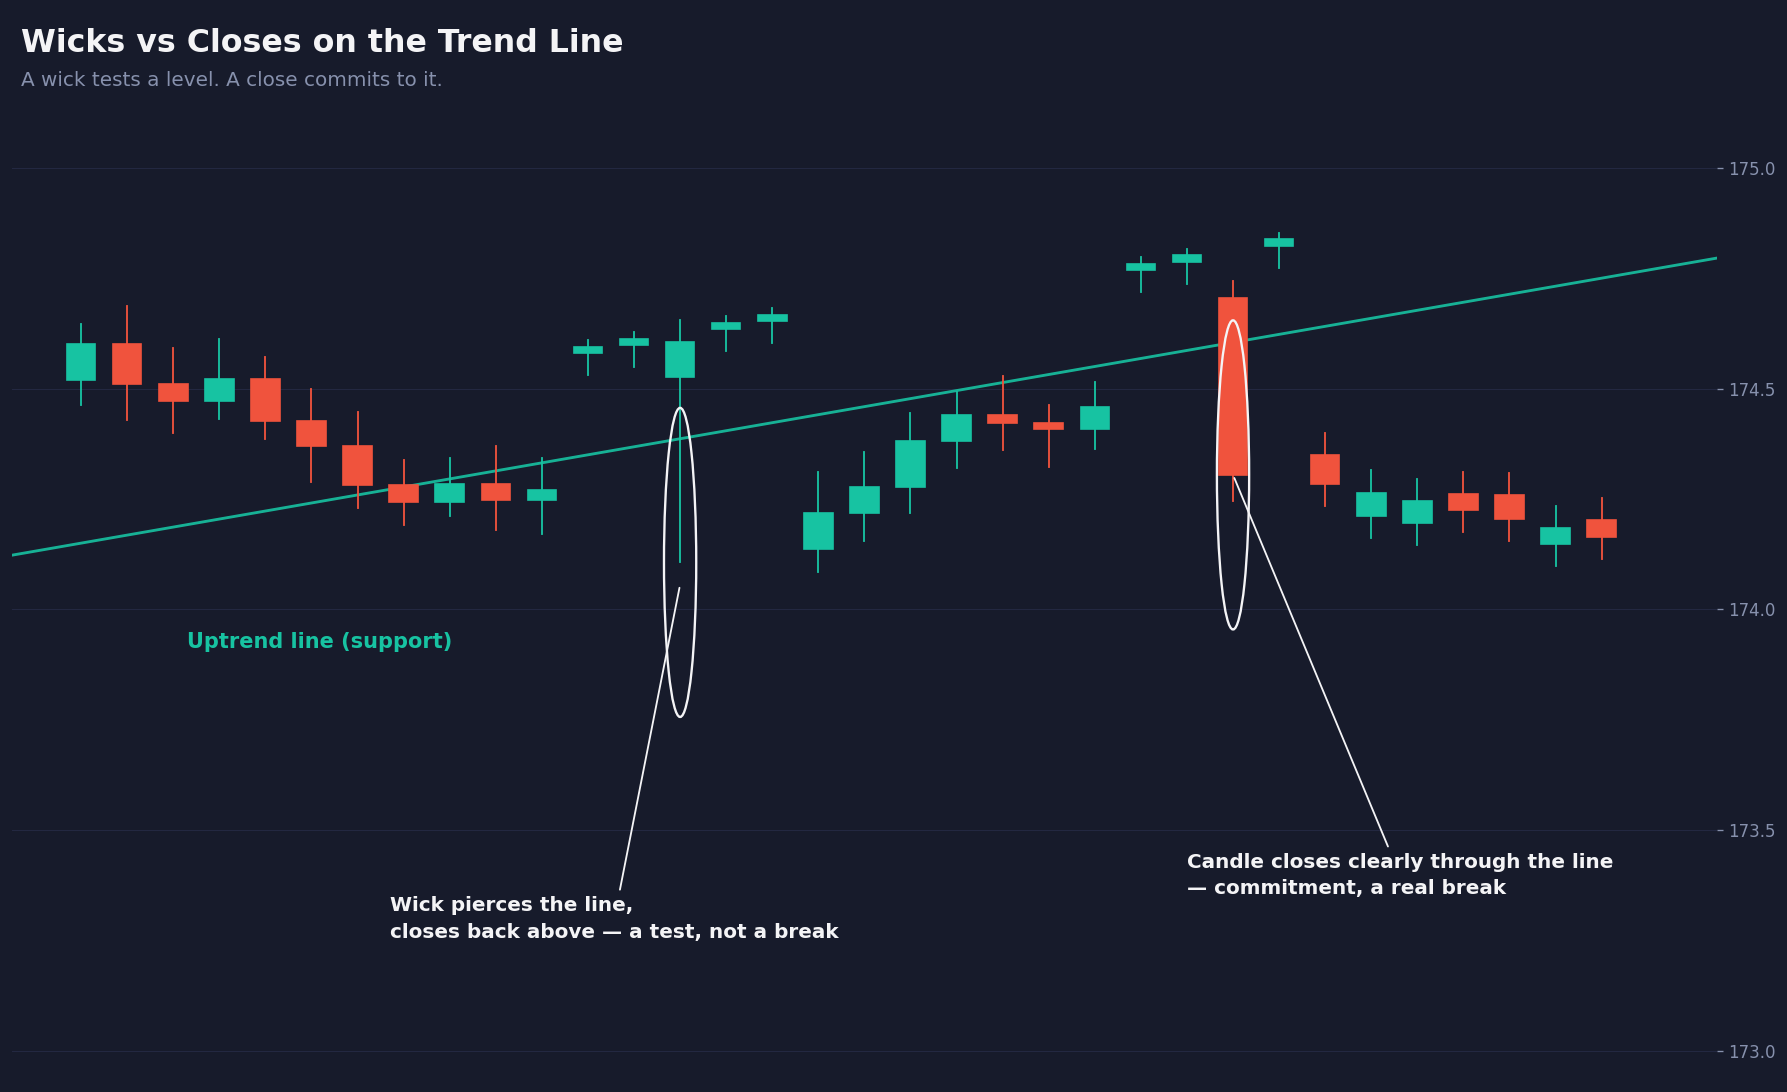
The wick-versus-close debate matters more than most traders assume. When price wicks through a trend line but the candle closes on the original side, that is a test, not a break. The market probed beyond the line, found no follow-through, and closed back inside the structure. That behavior often precedes the strongest bounces off trend lines because stop hunters have already cleared out the obvious orders beyond the line.
A close through the trend line is the level that carries real information. Wicks represent rejection. Closes represent commitment. Treating a wick breach as confirmation is one of the fastest routes to getting stopped out of a valid setup. This single distinction separates traders who use trend lines consistently from those who treat them as loose guidelines price can ignore at will.
How to Draw Trend Lines the Institutional Way
The institutional drawing process follows a specific sequence built around confirmed price structure, not visual appeal. This is not about finding the line that looks neatest on the chart. It is about identifying where genuine order flow has respected a structural level over multiple tests.
Start on a clean chart at the right timeframe before applying any of the steps below. The daily chart is the most reliable starting point for identifying major trend lines. The 4-hour chart adds precision for entry refinement once the major line is established.
- Identify the dominant direction by reading the sequence of swing points. Uptrends produce higher highs and higher lows. Downtrends produce lower highs and lower lows. Confirm this structural sequence before drawing anything.
- Locate the two most significant swing lows for an uptrend, or the two most significant swing highs for a downtrend. These are the anchor points. They must be clear structural pivots, not minor candle wicks inside a congestion zone or narrow range.
- Connect the two points using candle closes as the primary reference. Institutional order flow commits at the closing price, not at intraday wick extremes. Start with closes, then observe whether wick clusters on subsequent tests align with the extended line.
- Extend the line forward and wait for price to return to it. Do not act on the line before a third touch occurs. The reaction at the third touch is the confirmation, not the line drawing itself.
- Check the angle before considering any trade. A line outside the 30-to-60-degree range requires additional caution. The angle section below explains exactly what each range signals and why it matters for trade planning.
- Label the line as a working hypothesis until the third touch confirms it. Using a different color or line style for hypothesis lines versus confirmed ones keeps the chart readable and prevents directional bias from building around unconfirmed structure.
Trend lines sit inside a broader framework of price structure. The Asia Forex Mentor guide on market structure trading covers how swing points connect to the full picture of institutional price behavior and why location within the structure matters as much as the trend line itself.
Why the Angle of Your Trend Line Matters
The angle of a trend line tells traders whether the move behind it has sustainable institutional momentum or is burning out in real time. Most retail traders ignore angle entirely, which means they treat all trend lines as equal. A line drawn at the right angle reflects genuine, paced institutional participation. A line at the wrong angle reflects either retail euphoria or the final stage of a weakening trend.
The 30 to 60 Degree Sweet Spot
The ideal trend line angle in forex sits between 30 and 60 degrees on a standard proportionally scaled chart. A line in this range shows price moving steadily in one direction while giving the market enough room to pull back without breaking the trend. Trends at this angle have durability. They have the kind of steady institutional participation that produces reliable bounces when price returns to the line on a third or fourth touch.
A trend line that exceeds 60 to 65 degrees is a warning signal. Price is moving too fast. Steep lines are driven by retail momentum chasing, news events, or short squeezes rather than by sustainable institutional demand. Steep trend lines break almost without exception. When they do, the reversal is often sharp because there are no intermediate pullback zones with accumulated orders to slow the decline.
Shallow Lines and What They Signal
A trend line below 25 degrees signals a weak trend. Price may technically still be making higher lows, but the rate of change is so slow that the market is essentially range-bound. Shallow trend lines are common during consolidation phases or in the final stage of a trend losing institutional backing. Trading trend-following setups off a near-horizontal line means taking trend risk inside what is functionally a range.
When three consecutive trend lines on the same asset show a progressive flattening of angle, that pattern signals trend exhaustion. The first line is steep. The second is shallower. The third is nearly flat. This sequential flattening shows institutional participation declining with each leg of the trend. Spotting this angle shift across multiple trend lines is an edge that requires viewing the structure as a whole rather than drawing one line at a time.
The Three Angle Ranges at a Glance
The table below maps each angle range to its market signal and trading implication.
| Angle Range | What It Signals | Trading Implication |
|---|---|---|
| Below 25 degrees | Weak trend, near-range conditions | Avoid trend-following setups |
| 30 to 60 degrees | Healthy, sustainable trend | High-probability trend line entries on confirmed touches |
| Above 65 degrees | Parabolic move, exhaustion risk | Wait for break and retest before acting |
How to Confirm a Trend Line Break
A trend line break is one of the most acted-upon signals in forex trading. It is also one of the most frequently faked. Price breaking a trend line and price confirming a trend line break are two different events. The difference determines whether a trader catches a genuine reversal or absorbs a loss on a false move that immediately reverses back into the trend.
The Candlestick Close Rule
The most important rule for confirming a trend line break is that the candle must close on the other side of the line. A wick through the line is a test. A close through the line is the beginning of a genuine shift in price structure. The candlestick body is where institutional commitment shows up.
A bearish engulfing candle or a decisive bearish close below a rising trend line signals that sellers committed with enough conviction to overcome accumulated support. A small-bodied candle that barely clips through the line tells traders almost nothing on its own. Both the size and the decisiveness of the close matter when assessing whether a break carries real intent. For a breakdown of the specific candlestick signals that confirm high-probability breaks and continuations, the guide to forex candle patterns covers the 14 formations institutional traders track across all major currency pairs.
The Retest Confirmation
After a valid close through the trend line, the highest-probability confirmation comes from a retest. Price breaks the line, pulls back to test the broken level from the other side, finds rejection, and then continues in the breakout direction. The retest is where the best post-break entries are available, not at the initial close through the line.
The retest works because of a structural role reversal. Former support becomes resistance. Former resistance becomes support. Institutional traders who missed the initial break often place orders at the retest level, which is why the reaction there tends to be sharp and decisive. Waiting for the retest is not missing the trade. It is taking the trade at the point of maximum structural confirmation.
What a False Break Looks Like
A false break has a recognizable fingerprint. Price spikes through the trend line on a long wick, triggering stop losses clustered just beyond the line. The candle then closes back inside the original structure. The candle immediately following the spike typically engulfs it and pushes back into the trend direction. Volume is usually thin on the spike, which signals the move lacked broad participation behind it.
When traders recognize this fingerprint, the correct response is to wait rather than act. A false break that reverses back into the original trend structure with a strong confirming candle is itself a high-probability setup in the original trend direction. The failed break is the signal. Patience at this exact moment separates traders who read trend line behavior from those who react to every spike through a line as if it were confirmed.
Understanding how trend line breaks look differently across timeframes adds important context. The Asia Forex Mentor guide on top-down analysis explains how to read trend line behavior based on which timeframe initiated the break versus which timeframe confirmed it, and why the two do not always align.
Common Mistakes Forex Traders Make With Trend Lines
Trend lines are simple in concept and easy to misuse in practice. The mistakes below account for the vast majority of failed trend line trades. Almost all of them trace back to impatience, imprecision, or ignoring the structural context around the line itself.
Here are the five most damaging mistakes traders make when working with trend lines.
- Drawing too many lines: A chart covered in trend lines creates confirmation bias. Traders find whichever line supports their current directional view and trade it. The institutional rule is to keep no more than two or three active trend lines on a chart at once, drawn only from confirmed structural swing points.
- Using the wrong timeframe: A trend line on a 5-minute chart has almost no structural weight on its own. Major trend lines must begin on the daily chart and get refined on the 4-hour or 1-hour for entry precision. Trading lower-timeframe trend lines without daily context means taking losses on intraday noise that was never real structure.
- Treating a wick as a valid touch: A wick that probes beyond a level and closes back inside is not a confirmed touch. Valid touches are determined by how price closes relative to the line, not by how far the wick extended. Counting wicks as valid touches inflates the apparent strength of a line that may have no genuine institutional respect behind it.
- Ignoring the angle: A line above 65 degrees or below 25 degrees carries completely different risk than a line in the healthy 30-to-60-degree range. Treating all trend lines as equal regardless of angle leads to entering exhaustion moves or near-flat ranges as if they were sustained institutional trends.
- Acting before the third touch: A two-touch line is still a hypothesis. The third touch is the confirmation. Entering a position before the third touch means taking on full risk at reduced probability, which means the trade starts at a structural disadvantage before the first bar has even closed.
Price action reading provides the structural foundation that makes trend line analysis consistent rather than guesswork. The Asia Forex Mentor breakdown of price action trading explains the structural principles behind why price behaves the way it does at trend lines, swing points, and key support and resistance zones.
Mixing Timeframes Without a Clear Hierarchy
One additional mistake worth addressing is applying trend lines from multiple timeframes without a clear hierarchy. A rising trend line on the 1-hour chart that runs directly against a falling trend line on the daily chart creates a conflict. Most retail traders resolve that conflict by choosing whichever line supports their current bias. The correct method is to treat the higher timeframe trend line as dominant and use the lower timeframe only to refine entries that align with the same direction.
Asia Forex Mentor covers timeframe hierarchy as part of the complete trading system in the free forex training , where trend structure, timeframe alignment, and entry confirmation work together as a unified system rather than as isolated techniques applied independently.
Also Read: Understanding What Is Price Action Trading in 2026
Conclusion
Trend lines in trading are not complicated. They are misused. The difference between a trader who gets stopped out on supposedly valid trend lines and one who reads price structure cleanly comes down to three things: genuine swing points as anchors, angle awareness before entering, and the patience to wait for a third touch and a confirmed candlestick close before taking a position.
Every principle covered in this guide points back to the same foundation. Price structure is not random. It leaves deliberate footprints in the form of swing points, angle shifts, and candlestick closes. When those footprints are read correctly, trend lines become some of the highest-probability structures available in forex.
Frequently Asked Questions
How many touches does a trend line need to be valid?
Two touches define a trend line, but three touches confirm it. With only two points, the line remains a hypothesis the market has not yet tested under real conditions. When price returns to the line a third time and reacts with clear rejection or a bounce, that confirms genuine structural respect. Lines with four or five confirmed touches over multiple weeks carry significantly more weight than any two-touch line drawn over a few sessions.
Should trend lines be drawn through wicks or candle closes?
Candle closes are the primary reference for drawing valid trend lines in forex. Wicks represent intraday probing behavior where price temporarily tested a level but failed to sustain commitment on the close. The institutional method anchors trend lines at closing prices first. If subsequent tests show wick clusters aligning consistently at the extended line, traders can make a minor adjustment to account for them. Closing prices always take priority over wick extremes.
What angle should a healthy trend line have in forex trading?
A healthy trend line in forex sits between 30 and 60 degrees on a proportionally scaled chart. Lines below 25 degrees indicate a near-flat, range-like market where directional momentum is too weak for reliable trend-following setups. Lines above 65 degrees indicate a parabolic or event-driven move prone to sharp reversal when momentum fades. The 30-to-60-degree zone is where sustained institutional participation tends to produce consistently reliable trend line reactions on repeated touches.
How do traders confirm a trend line break in forex?
Trend line break confirmation requires a full candlestick close on the opposite side of the line, not just a wick extension through it. The most reliable confirmation occurs when price breaks the line with a decisive close, pulls back to retest the broken level from the other side, and then continues in the breakout direction. That retest reaction, where former support becomes resistance or former resistance becomes support, is where the highest-probability post-break entries are found.
What is a false trend line breakout?
A false breakout occurs when price spikes through a trend line on a long wick, triggering stop losses just beyond the line, and then closes back inside the original structure. The candle following the spike typically reverses it with strong conviction. Volume is usually thin on the initial spike. When a false break reverses strongly back into the original trend direction with a confirming follow-through candle, that reversal is itself a high-probability setup in the original trend direction.