Singapore
 Malaysia
 Indonesia
 Philippines
 Thailand
 Vietnam
 Cambodia
 Myanmar
 Brunei
 China
China Japan
Japan South Korea
 Taiwan
 India
India Australia
  New Zealand
 United Kingdom
 Switzerland
 Italy
Italy Spain
Spain UAE
UAE United States
 Mexico
 Argentina
 South Africa
 IC Markets
 Pepperstone
 AvaTrade
 XM
XM Plus500
 RoboForex
 TMGM
TMGM Exness
 JustMarkets
 Orbex
Orbex Interactive Brokers
 Saxo
Saxo Tiger Brokers
 Binance
 Coinbase
 Gemini Exchange
 Kraken
 iFunds
 IC Funded
 The 5%ers
 TopStep
 IQ Option
 Pocket Option
 RaceOption
 IQCent
Most forex traders who get stopped out consistently are missing the same thing: multiple timeframe analysis. They always blindly enter trades based from the the larger market structure is doing.
|
ABOUT THIS GUIDE |
This guide explains the complete multiple timeframe analysis process used by institutional forex traders. It covers why a single chart fails, how the three-layer top-down structure works, the exact timeframe combination Asia Forex Mentor teaches, and the five most common mistakes that destroy traders who try to apply this method without a system. |
|
QUICK ANSWER |
Multiple timeframe analysis is a top-down process where traders use three charts to build a complete trade. The highest timeframe sets the directional bias. The middle timeframe identifies the setup pattern. The lowest timeframe times the entry trigger. A trade is only taken when all three timeframes agree on direction. |
Why Trading One Timeframe Keeps Most Forex Traders Stuck
Most traders start in the wrong place. They open a 15-minute or 1-hour chart, find a pattern they like, feel good about it, and take the trade. What they skip is the one question that matters, whether that pattern is moving with the bigger trend or straight into it. That blind spot costs more trades than any bad indicator ever will.
It comes down to context. A bullish reversal on the 1-hour chart can look great on its own, but zoom out to the Daily and the picture changes. That same spot might be sitting at the top of a weak bounce inside a downtrend that never let up. The pattern itself was fine. The direction it pointed you was wrong, because the bigger chart had already made its call.
Institutional traders never encounter this problem because they never start analysis at the entry. They start with the macro picture first. They identify the direction of the dominant trend, then work down to find setups within that trend, then drop lower to time the entry precisely. This sequence eliminates an entire category of trades that retail traders place every day: setups that look valid in isolation but fight the larger market structure.
The Three-Layer Top-Down Structure Professionals Use
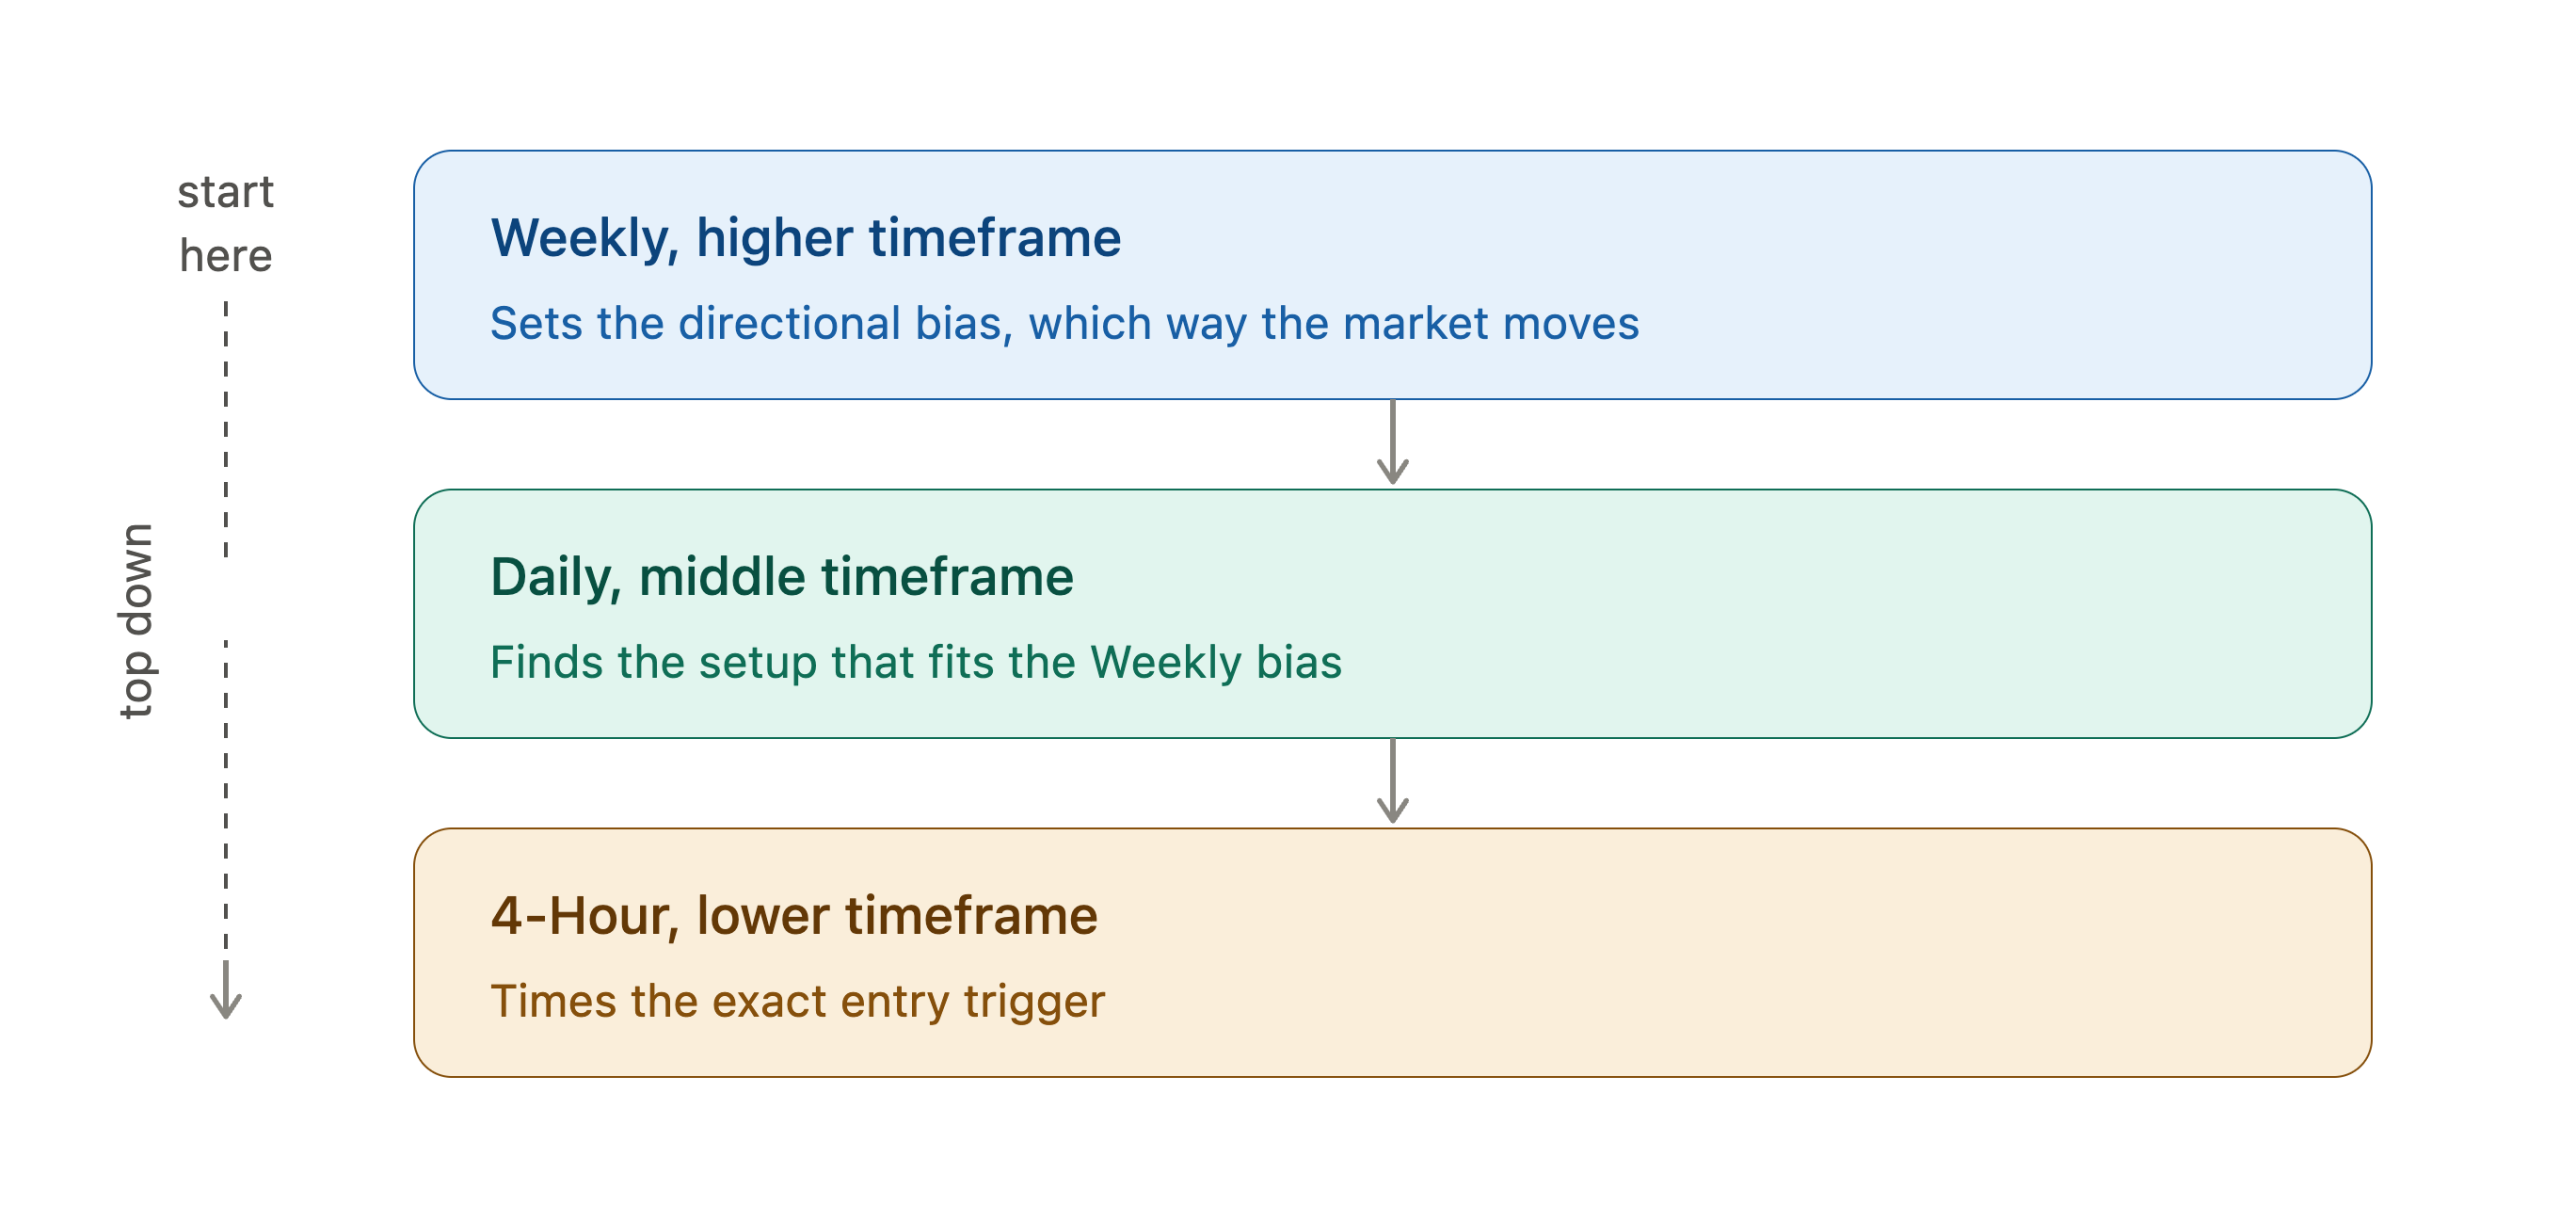
The institutional approach to multi timeframe analysis runs on three layers, and each one has a single job it never steps outside of. Nothing skips ahead, nothing overrides anything else. By the time an order goes in, direction, setup, and entry are all pointing the same way.
Higher Timeframe for Directional Bias
The highest timeframe exists to answer one thing, which direction the market is actually moving. That is the only layer allowed to set the bias. So if it is showing a downtrend, you are looking for shorts on the lower charts and nothing else. Bullish signals down there get ignored, no matter how good they look in the moment.
Middle Timeframe for Setup Identification
The middle timeframe shows you how price is behaving inside that bigger trend. Once the bias is set, this is where you go looking for a pattern that fits it, maybe a pullback to a key level, a stretch of consolidation, or a structural break heading the same way as the trend. Whatever it is, the setup has to match the higher timeframe direction before an entry is even on the table.
Lower Timeframe for Entry Timing
The lowest timeframe has one narrow job, and that is timing the entry. You are not using it to pick direction or hunt for setups, that work is already done on the two charts above it. Once the bias and the setup both check out, you drop down here for the trigger. That trigger is something specific, like a candlestick pattern, a shift in momentum, or a short-term break in structure that tells you the setup is firing right now.
What Each Layer Decides
The three layers work together as a system. Each one answers a different question, and all three must return a clear yes before a trade is taken.
| Layer | Role | Question It Answers |
|---|---|---|
| Higher | Macro context | Which direction is the market moving? |
| Middle | Setup identification | Is a valid pattern forming in that direction? |
| Lower | Entry precision | Where exactly is the entry trigger? |
Any missing or contradictory answer stops the process. There is no trade without a yes from all three layers.
The Weekly Chart for Directional Bias
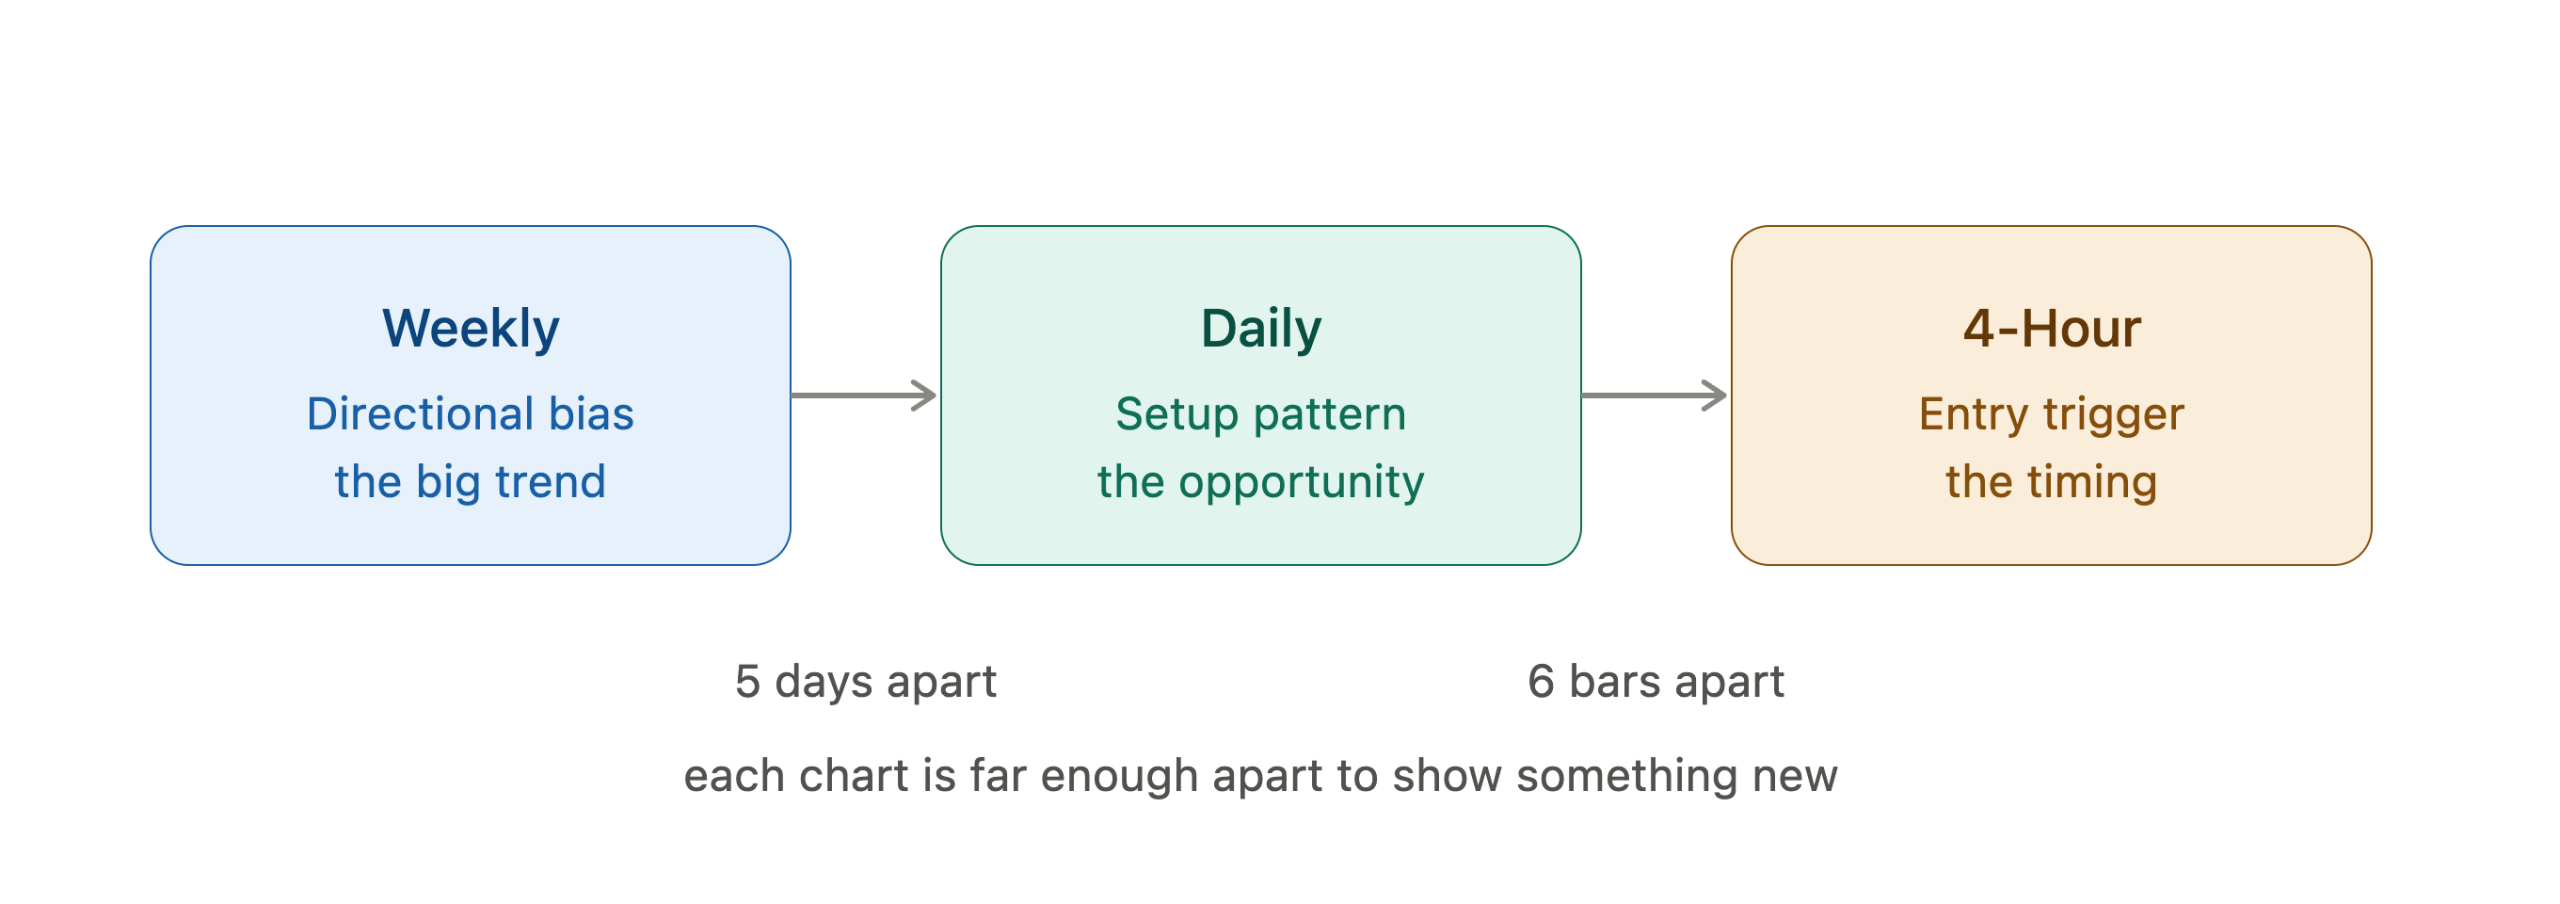
The Weekly chart is the starting point for every trade under the AFM method. No other chart is opened until the Weekly is analyzed first.
On the Weekly chart, you check three things before you go any further. First, which way the market is moving. Higher highs and higher lows mean an uptrend, lower highs and lower lows mean a downtrend. Next, you mark the big support and resistance zones, since those are the edges of the current trend. Last, you look at whether the Weekly is trending or just moving sideways, because that tells you what kind of setup to hunt for on the Daily.
The Daily Chart for Setup Identification
After the Weekly bias is confirmed, traders move to the Daily chart. This is where the actual trading setup forms, within the context the Weekly chart established.
Here are the most common Daily setups within an AFM-aligned Weekly uptrend:
- A pullback to a major support zone that held on a previous Weekly swing
- A false break below key Daily support that quickly reclaims the level
- A consolidation pattern forming at a major Weekly structural zone before continuation
Each setup must align with the Weekly direction. A bearish Daily pattern inside a Weekly uptrend is a retracement to watch, not a reversal to trade short.
The 4-Hour Chart for Entry Timing
With the Weekly bias confirmed and the Daily setup identified, traders drop to the 4-Hour chart. This is the execution layer.
Here are common 4-Hour entry triggers in a bullish uptrend scenario:
- A bullish rejection candle forming precisely at the Daily support level
- A break above a short-term resistance created during the Daily pullback phase
- A clear shift in 4-Hour momentum from bearish to bullish, confirmed by a structural change
The entry is placed at this trigger. The stop loss is placed below the 4-Hour structural low. The target is set at the next significant Daily or Weekly resistance zone.
How Timeframe Alignment Works Before Entering a Trade
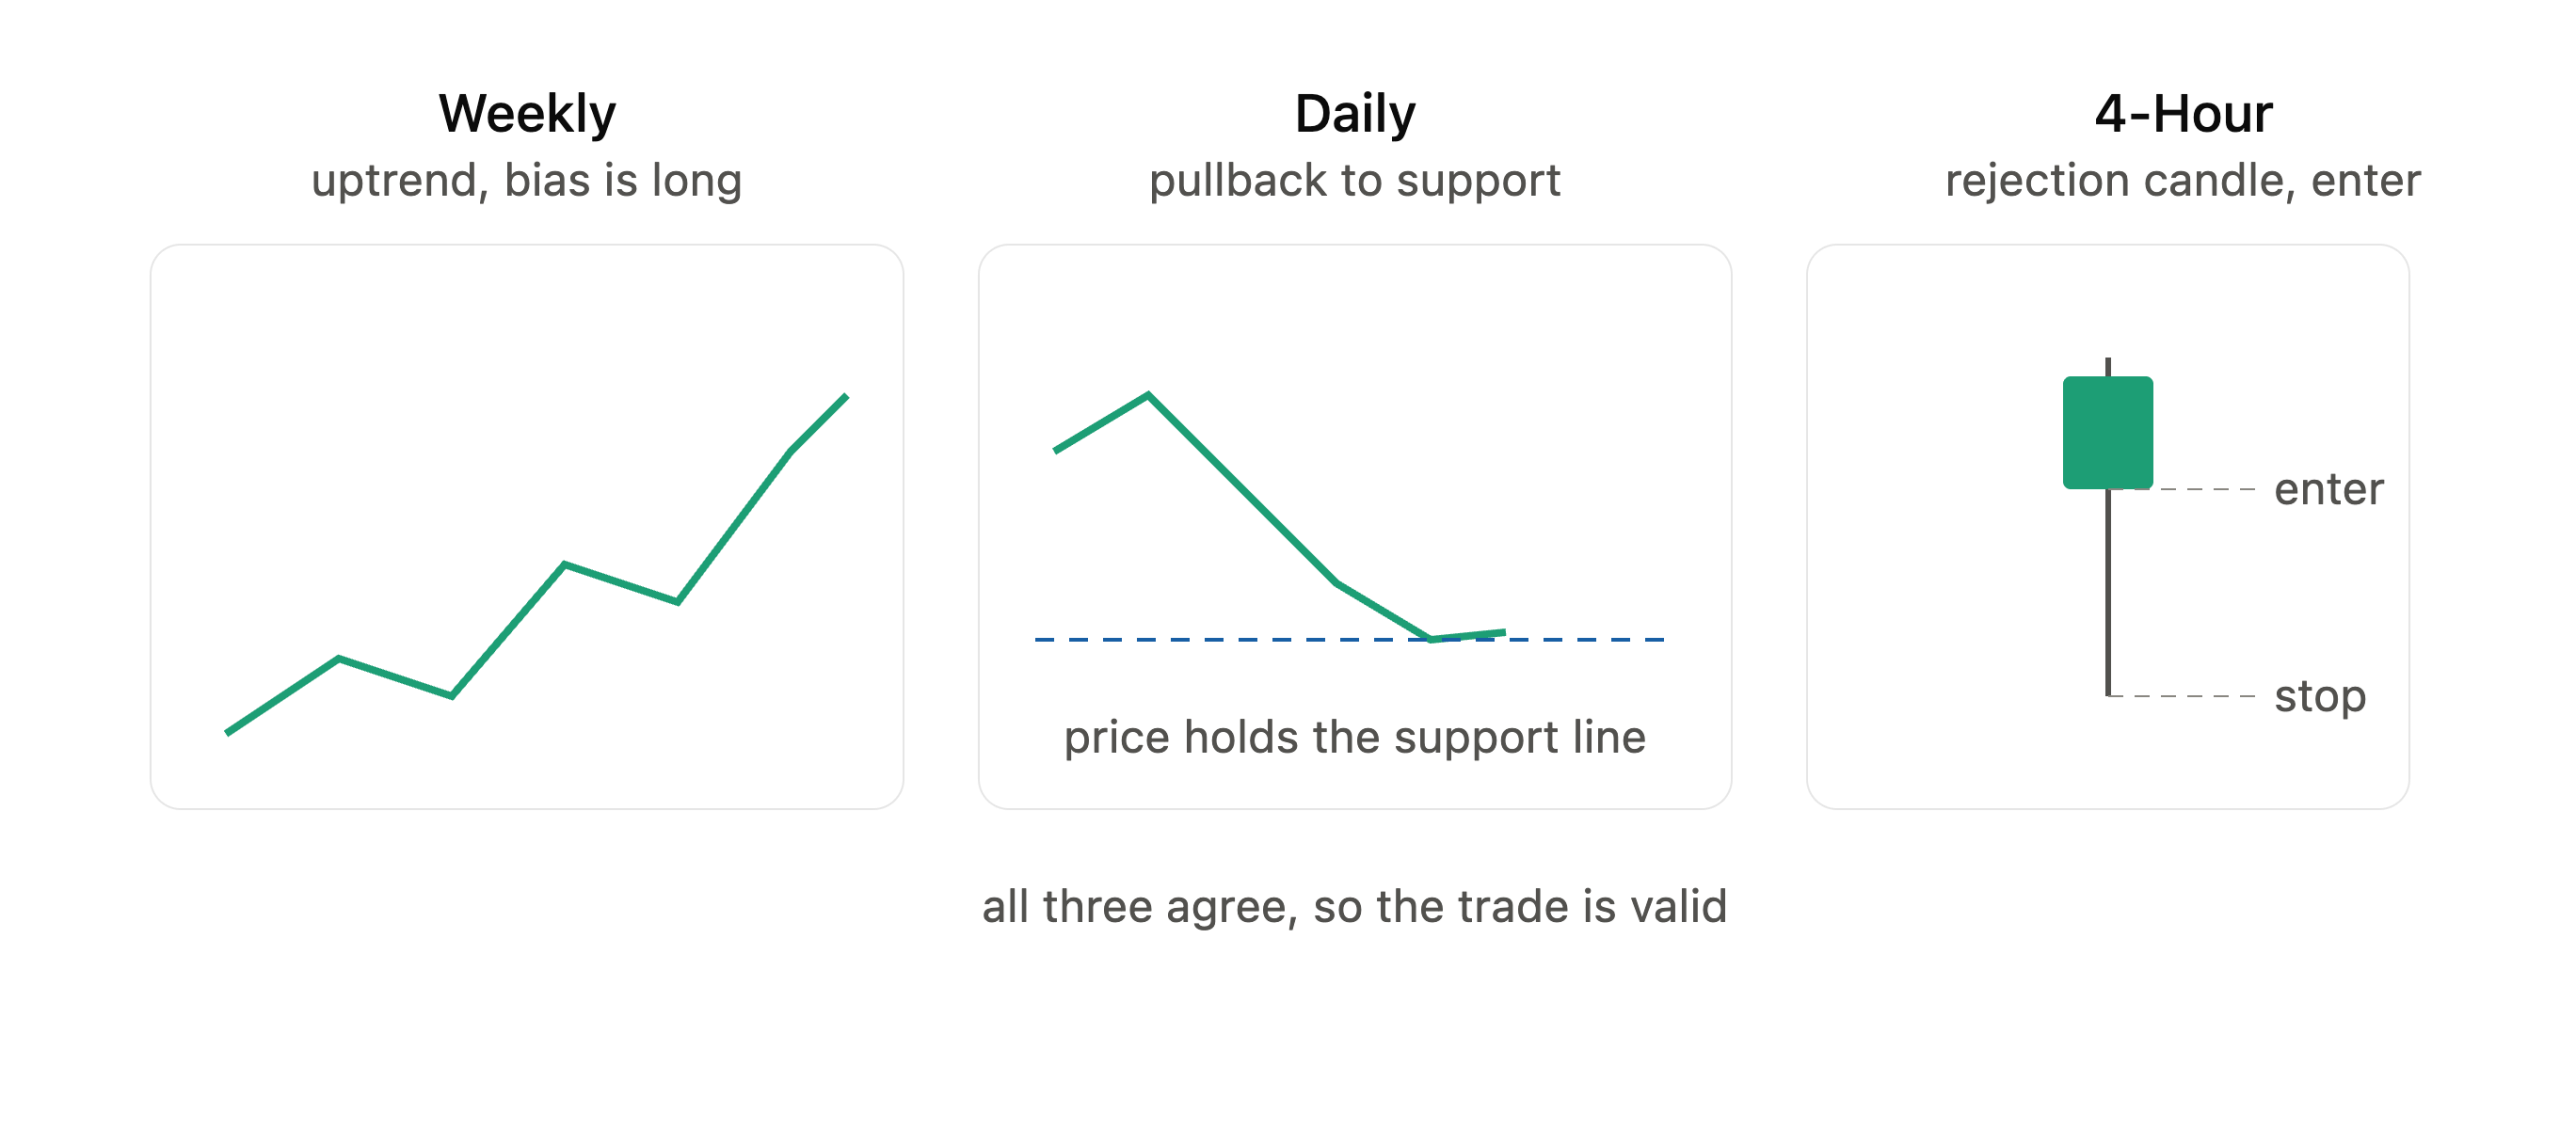
Alignment just means all three layers agree before you place an order. That is the heart of the whole multiple time frame trading strategy. When you wait for it, you stop taking snap entries and force yourself to walk through the full top-down sequence before any money is on the line.
Here is the step-by-step alignment process Asia Forex Mentor teaches:
- Open the Weekly chart first. Identify whether price is making higher highs and higher lows or lower highs and lower lows. Mark the major support and resistance levels that define the current structure.
- Move to the Daily chart. Confirm the Weekly trend is still intact. Check whether price is at or near a key Daily level where a setup could be forming. Look for a pullback, a consolidation, or a reversal pattern that matches the Weekly bias.
- Verify the Daily setup is valid. A setup is valid when price sits at a meaningful level, the direction matches the Weekly bias, and the pattern shows the market pausing within the trend rather than reversing against it.
- Drop to the 4-Hour chart. Only after completing steps 1 through 3, check the 4-Hour for an entry trigger. The trigger must confirm the Daily setup is activating now, not simply that price is near a level.
- Confirm full alignment. The Weekly sets direction, the Daily confirms the conditions are right, and the 4-Hour tells you the move is actually starting. Miss that three-way agreement and there is no trade.
The alignment process becomes reliable only with consistent practice. Understanding top-down analysis in forex and why most traders still execute it incorrectly is the foundation that makes this checklist work in live conditions.
Identifying Key Levels Across Timeframes
A support or resistance level that shows up on the Weekly chart matters far more than one you only see on the 4-Hour. The reason is simple. Bigger charts reflect the decisions of bigger players, so a Weekly level is where serious money tends to sit. When that same level lines up across all three timeframes, you are looking at a zone where the largest orders are most likely stacked, and price rarely moves through it without a fight.
That kind of setup, one you can see on the Weekly, confirm on the Daily, and trigger on the 4-Hour, is about as high-probability as it gets. The catch is drawing those zones correctly in the first place, since a level marked in the wrong spot gives you false confidence instead of real confluence. For a full walkthrough on marking these areas the right way, see the guide to supply and demand zones.
What Happens When the Three Timeframes Conflict
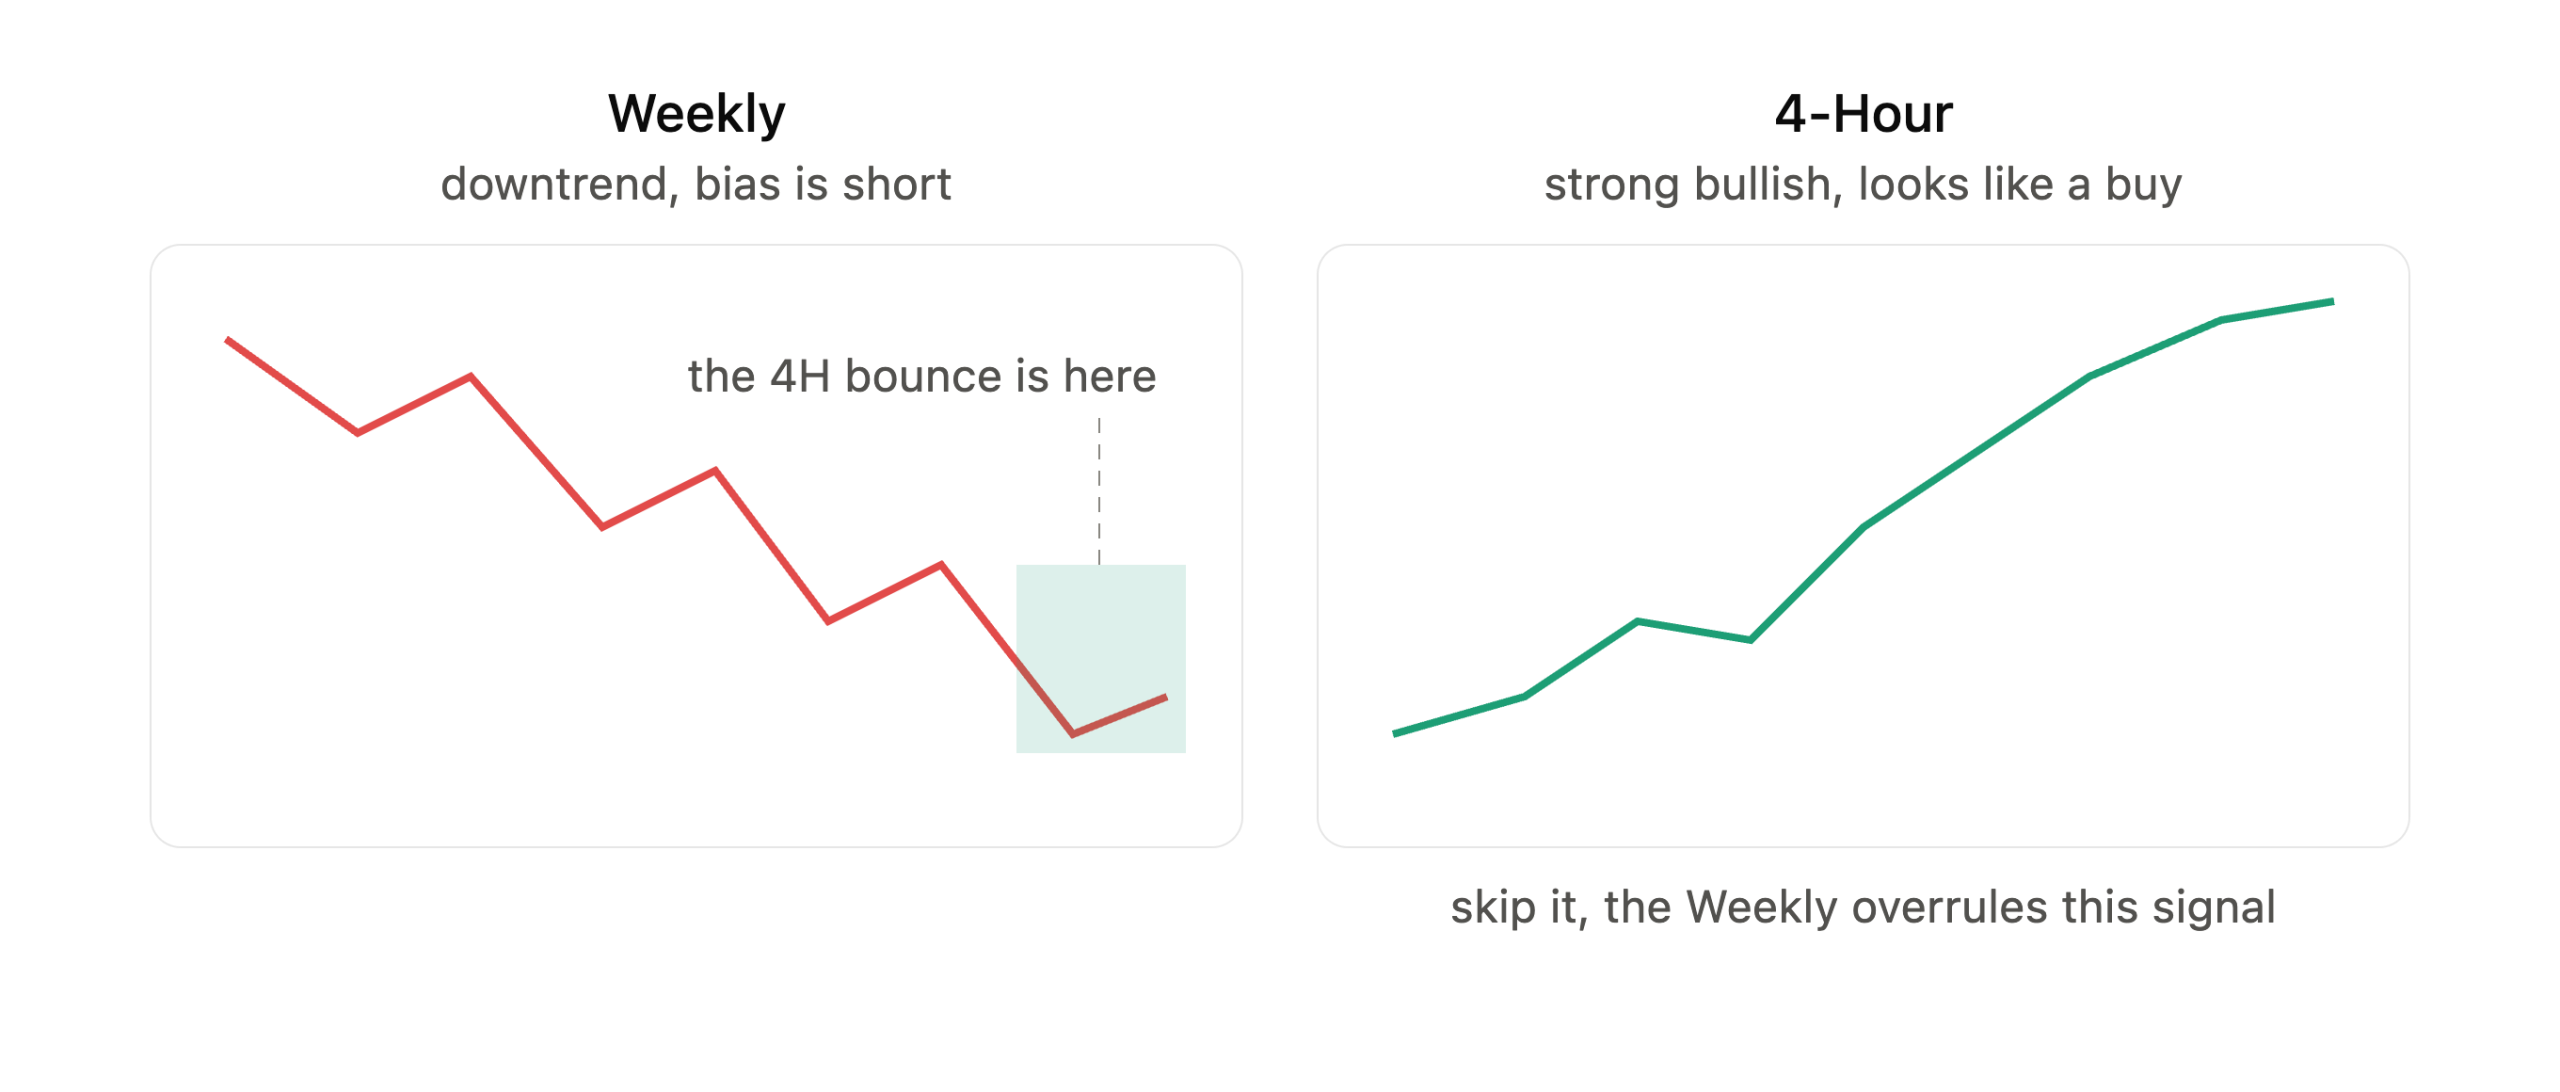
Timeframe conflict is just part of trading. The charts will not always line up into a clean three-timeframe picture, and that is normal. Knowing what to do when they disagree matters just as much as knowing how to trade a setup where everything agrees.
The rule that keeps you out of trouble is simple. The higher timeframe always wins. A strong bullish pattern on the 4-Hour inside a Weekly downtrend is not a buy signal, it is a move against the trend. What you are really looking at is a short bounce inside a bigger move down. No matter how good that 4-Hour signal looks, it is not a valid long, because the bigger chart already told you which way things are heading.
These are the conflicts that come up most, and how to handle each one:
Weekly Bearish, Daily Neutral, 4-Hour Bullish
The 4-Hour signal is counter-trend. The correct action is to skip the long trade. Wait for the 4-Hour bullish move to exhaust itself, then look for a short setup that aligns with the Weekly bearish bias.
Weekly Bullish, Daily Bearish Pullback, 4-Hour Unclear
The Daily pullback is normal within a Weekly uptrend. This is a setup in progress, not a conflict. The correct action is to wait for the Daily pullback to complete and produce a clear reversal signal, then drop to the 4-Hour for the entry trigger.
Weekly Bullish, Daily Bullish, 4-Hour Has Not Yet Triggered
The two higher layers agree. This is a valid pending setup, not a conflict. The correct action is to wait for the 4-Hour trigger. Entering before the trigger appears means entering too early and getting stopped out by short-term noise before the move develops.
When timeframes conflict, patience wins by default. Asia Forex Mentor drills one idea into students here, which is that the best trade is often no trade at all. Missing a setup costs you nothing, but forcing one in conflict costs real money.
Five Multiple Timeframe Analysis Mistakes That Destroy Trades
Everybody in retail forex talks about multiple timeframe analysis, but most people use it wrong. The same five mistakes keep showing up over and over, and each one quietly wrecks your results.
Here is what they are and why they hurt.
- Analyzing bottom-up instead of top-down. Opening the 4-Hour or 1-Hour first and only glancing at the higher timeframe afterward flips the whole method backward. The higher timeframe is supposed to set your direction before you ever touch a lower chart. Checking it after you have already spotted an entry is not analysis, it is just looking for a reason to take the trade you already wanted. That habit leads you straight into counter-trend trades, and you take them feeling completely sure of yourself.
- Using timeframes that are too close together. A trader flipping between the 5-minute, 15-minute, and 30-minute is looking at the same short-term noise three times over, just from slightly different angles. Those charts do not give you three real layers of context, they give you one layer repeated. To actually see something different on each chart, every step up should be at least four times longer than the one below it.
- Letting the lower timeframe override the higher timeframe bias. One strong bullish candle on the 4-Hour does not undo a Weekly downtrend. But traders see that burst of momentum on the lower chart and throw out the bias they set just minutes ago. That is the number one reason people end up in counter-trend trades without even noticing. The higher timeframe wins every time, no exceptions.
- Switching the higher timeframe bias too quickly. One bearish candle on the Daily inside a Weekly uptrend does not flip your bias to bearish. For the Weekly bias to actually change, you need a real structural break, meaning price closes below a major Weekly swing low in a downtrend, or closes above a major Weekly swing high in an uptrend. If you flip your bias on every little pullback, you end up confused and inconsistent, and it shows across a whole run of trades.
- Adding a fourth or fifth timeframe. More charts do not make things clearer. They just give you more signals that fight each other and more reasons to talk yourself out of a good trade. Three timeframes work because each one has its own job. Add a fourth and you create a tie you cannot break cleanly, and a lot of experienced traders will tell you that is exactly where their whole process fell apart. consistently describe it as the point where their process broke down.
Learning how to read forex charts accurately at each timeframe is the foundational skill that makes avoiding all five mistakes possible. The price action framework taught by Asia Forex Mentor is specifically designed to work with the Weekly-Daily-4H structure described in this guide. Students who apply both together build a repeatable process for reading the forex market with institutional-level clarity.
Also Read: Top Down Analysis and Why Most Traders Still Get It Wrong
Conclusion
Multiple timeframe analysis is easy to get and hard to live by. The idea is simple, start high, work your way down, and only pull the trigger when all three charts agree. Living it is the hard part. You have to walk away from those juicy lower-timeframe signals that go against your bias. You have to sit through long dead stretches where nothing lines up and do nothing. And you have to make peace with the fact that a handful of good trades will always beat a stack of rushed ones.
That patience is really the whole edge. The Weekly tells you the direction, the Daily hands you the setup, the 4-Hour times the entry, but none of it counts unless all three are pointing the same way. Run that same check on every trade and consistency starts to build on its own. Learn to spot the levels where all three timeframes overlap. And when they clash, treat it as your cue to wait, not a problem to muscle through.
Do that long enough and you stop reacting to the market and start actually reading it. You see the whole thing before a single dollar is at risk, and that is what gives you fewer nasty surprises and steadier results over a long run of trades.
Asia Forex Mentor’s free training walks through how this method integrates with a complete trading system, covering market reading, risk management, and consistent execution from start to finish.
Frequently Asked Questions
What Is Multiple Timeframe Analysis in Forex?
Multiple timeframe analysis is a top-down process where traders use three charts at different time scales before entering any trade. The highest timeframe establishes the directional bias. The middle timeframe identifies a valid setup aligned with that bias. The lowest timeframe times the precise entry. All three layers must agree before an order is placed. Trades taken without all three layers confirming are high-risk by definition.
Which Timeframes Are Best for Multiple Timeframe Analysis?
Asia Forex Mentor teaches the Weekly, Daily, and 4-Hour combination as the most effective set for forex traders. The gap between each timeframe is large enough that each chart shows genuinely different market information. Timeframes that are too close together, such as 5-minute, 15-minute, and 30-minute, show the same short-term noise from slightly different angles without adding real context or improving trade quality.
What Is the Top-Down Approach in Forex Trading?
The top-down approach starts analysis at the highest timeframe first and works down to the lowest timeframe last. It is the opposite of starting from an entry signal and then looking at higher timeframes for confirmation. Top-down analysis ensures the directional bias is established before any setup is considered. This single discipline prevents the most common retail mistake: entering counter-trend trades that look valid on the entry chart but fight the macro structure.
Can Multiple Timeframe Analysis Be Used for Day Trading?
Yes, but the specific combination shifts. A day trader might use the Daily chart for directional bias, the 4-Hour chart for setup identification, and the 1-Hour chart for entry timing. The three-layer structure remains exactly the same: macro bias first, setup second, trigger third. The minimum gap between consecutive timeframes should remain approximately 4 to 1, regardless of whether the trader is day trading, swing trading, or holding positions for weeks.
What Is the Biggest Mistake in Multiple Timeframe Analysis?
The most damaging mistake is letting a lower-timeframe signal override the higher-timeframe bias. When a strong 4-Hour bullish pattern forms inside a Weekly downtrend, many traders take the long trade because the 4-Hour signal looks powerful. The 4-Hour signal is a short-term bounce within a bearish macro structure. The Weekly bias overrules it completely. Ignoring this rule is the single most common reason traders enter counter-trend positions and get stopped out by the very trend they ignored.